
Abstract
Aim: It is to be elucidated the risk-predictive role of differentially expressed fatty acid metabolism related genes (DE-FRGs) in dilated cardiomyopathy (DCM) and myocardial infarction. Materials & methods: Four gene enrichment analyses defined DE-FRGs’ biological functions and pathways. Three strategies were applied to identify risk biomarkers and construct a nomogram. The 4-DE-FRG correlation with immune cell infiltration, drugs, and ceRNA was explored. Results: DE-FRGs were enriched in lipid metabolism. A risk nomogram was established by ACSL1, ALDH2, CYP27A1 and PPARA, demonstrating a good ability for DCM and myocardial infarction prediction. PPARA was positively correlated with adaptive immunocytes. Thirty-five drugs are candidate therapeutic targets. Conclusion: A nomogram and new biological targets for early diagnosis and treatment of DCM and myocardial infarction were provided.
Plain Language Summary
Dilated cardiomyopathy (DCM) and myocardial infarction (MI) are two common types of heart disease. This study investigated the fatty acid metabolism related genes to predict the risk of DCM or MI. Four of them (ACSL1, ALDH2, CYP27A1 and PPARA) were effective in predicting disease risk. Additionally, PPARA was found to be associated with immune cell infiltration, and 35 drugs emerged as potential therapeutic targets for these diseases. This study may provide insights into the early diagnosis and treatment of DCM and MI.
Graphical abstract
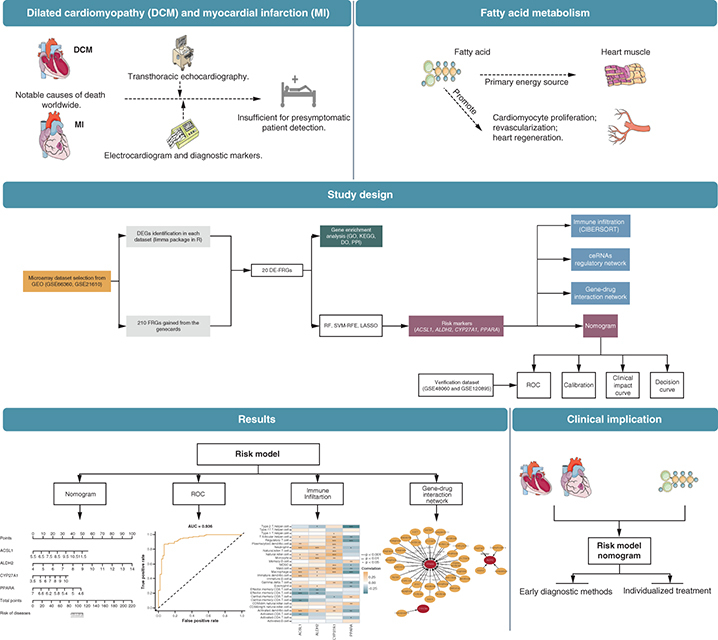
Dilated cardiomyopathy (DCM) and myocardial infarction (MI) are highly fatal cardiovascular diseases that pose significant public health threats globally [Citation1,Citation2]. DCM is characterized by heart muscle dilation and dysfunction, commonly ending in heart failure (HF) [Citation1–3]; MI is caused by a sudden blockage of blood flow to the heart, leading to tissue damage and HF failure [Citation4]. Nevertheless, current diagnostic tools that fail to predict DCM before changes in left ventricular ejection fraction [Citation5,Citation6] and MI before its sudden onset [Citation4,Citation7], are inadequate in detecting presymptomatic patients.
DCM and MI are inextricably linked. They share a few risk factors in common, including infections, inflammation and family history [Citation8,Citation9]. Moreover, overexpression of MI-associated transcripts has been observed in patients with inflammatory DCM [Citation10]. Considering these observations, characterizing genetic profiles to construct a shared risk prediction model may hold promising implications for early intervention improvement.
Fatty acid, as the primary energy source for heart muscle [Citation11], may substantially contribute to the pathogenesis of DCM and MI. Decreased expression of PPARα (fatty acid metabolism related protein) caused by doxorubicin may induce DCM [Citation12]. Administration of eicosatetraenoic acid improved cardiac metabolism, attenuated histological remodeling and resulted in functional improvements after MI [Citation13]. Identifying novel predictive genes in this pathway may provide valuable insights into disease pathogenesis and innovative therapeutic strategies development.
The present study aims at constructing a shared risk prediction model for DCM and MI related to fatty acid metabolism. The association between risk signatures and infiltrating immune cells, drugs and competing endogenous RNA (ceRNA) was also analyzed, which may assist in developing personalized preventive strategies to reduce the burden of cardiovascular disease.
Materials & methods
Data collection & data processing
First, GSE21610, GSE66360, GSE120895 and GSE48060 were downloaded as candidate datasets from the Gene Expression Omnibus (GEO) database (www.ncbi.nlm.nih.gov/geo/). The basic information of retrieved datasets is shown in . Additional clinical information for the dataset can be found in Supplementary Table 1. The raw data were normalized with quantile normalization and transformed into a base two logarithmic scale using the R package ‘LIMMA.’ Subsequently, a principal component analysis was performed to verify their quality [Citation14]. Then, we combined GSE21610 and GSE66360 as the train set and GSE120895 and GSE48060 as the test set. The R package ‘sva’ [Citation15] removed the merged dataset’s batch effects, and principal component analysis verified the quality (Supplementary Figure 1).
Table 1. Data sets implemented for analysis.
Differential expression analysis
Differentially expressed genes (DEGs) between control (healthy samples) and disease (DCM or MI samples) group in the training set were identified by R packages ‘LIMMA’. DEGs with the p-value < 0.05 and |log2 FC| >1 were statistically significant. A total of 210 FRGs with a Relevance score >32 were obtained from the Genecards database. The intersection of obtained FRGs and DEGs yielded a set of DEGs associated with fatty acid metabolism (DE-FRG), visualized by R packages ‘LIMMA’, ‘pheatmap’ and ‘ggpubr’ [Citation14,Citation20,Citation21].
Gene enrichment analysis
Gene ontology (GO), Kyoto Encyclopedia of Genes and Genomes (KEGG) and Gene Set Enrichment Analysis (GSEA) were conducted with the use of the R package ‘clusterProfiler’ [Citation22] to explore the function and pathway of the DE-FRGs. Disease ontology (DO) enrichment analysis was performed with the R package ‘DOSE’. p < 0.05 was considered to show the statistical significance.
Construction & validation of the risk nomogram
Three algorithms were applied to the DE-FRGs for screening risk biomarkers for DCM and MI, including the random forests (RF) [Citation23,Citation24], the least absolute shrinkage and selection operator (LASSO) logistic regression [Citation25] and the support vector machine recursive feature elimination (SVM-RFE) [Citation26]. The RF algorithm was adopted with the R package ‘randomForest.’ The LASSO logistic regression investigation was conducted with R package ‘glmnet,’ and minimal lambda was considered optimal. Later, three screening results were intersected to obtain risk biomarkers, visualized with a nomogram. The test set was used for in-depth testing of the efficacy of key biomarkers. The receiver operating characteristic curve (ROC), calibration curve, clinical impact curve and decision curve were used to judge the predictive ability of the nomogram.
The train set and the test set were assessed based on the investigation of ROC curves, and the area under the curve (AUC) was calculated to evaluate the predictive effect achieved by the algorithms. These steps were achieved via R package ‘dplyr’ [Citation27], ‘timeROC’ [Citation28], ‘rms’ [Citation29] and ‘ROCR’ [Citation30]. Following this, the calibration curve (relationship between observation probability and prediction probability) and clinical impact curve were performed to evaluate the degree of consistency between observed and predicted outcomes. The decision curve analysis examined the theoretical relationship between patients’ threshold death or relapse probability and the relative value of false-positive and false-negative results to evaluate the nomogram benefit further [Citation31]. These steps were achieved via R package ‘Hmisc’ [Citation32], ‘lattice’ [Citation33] and ‘Formula’ [Citation34].
Evaluation & correlation analysis of infiltration related immune cells
The CIBERSORT website filters 28 kinds of the immune cell matrix. According to p < 0.05, the immune cell infiltration matrix was obtained. The present study adopted the R package ‘corrplot’ for drawing the correlation heatmap for visualizing the correlation of 28 kinds of infiltrating immune cells. The ‘ggstatsplot’ and ‘ggplot2’ packages were adopted to analyze the Spearman relationship between characteristic risk markers and immune infiltrating cells and visualize the result.
Construction of the gene–drug interaction network
Drugs and their target genes were downloaded from the gene-drug interaction database (DGIdb v3.0, www.dgidb.org) [Citation35]. Cytoscape v3.9.1 was applied to extend the gene–drug interaction network (https://cytoscape.org/).
Construction of ceRNA network
A ceRNA network was built based on three public websites, TargetScan, miRDB, and miranda, to determine whether the DE-FRGs exist in competing endogenous regulating networks mediated by long non-coding RNAs (lncRNAs) and micro RNAs (miRNAs). Visualization of the ceRNA was performed by Cytoscape v3.9.1 (https://cytoscape.org/).
Data analysis
R v4.1.2 (R Foundation for Statistical Computing, Vienna, Austria, www.r-project.org/) and RStudio v1.1.463 (Integrated Development for R. RStudio, Inc., MA, USA, www.rstudio.com/) were operated to perform data analysis. Significance evaluation was fulfilled by t-test for distributed data and by Wilcoxon Mann–Whitney test for other data. The Spearman correlation coefficient was calculated to identify the associations between the DE-FRGs and 28 infiltrating immune cells. A multivariate logistic regression model was established to estimate the hazards ratio along with 95% CI. Analysis with a p-value is statistically significant when it is <0.05 and considered statistically highly significant if it is <0.01.
Results
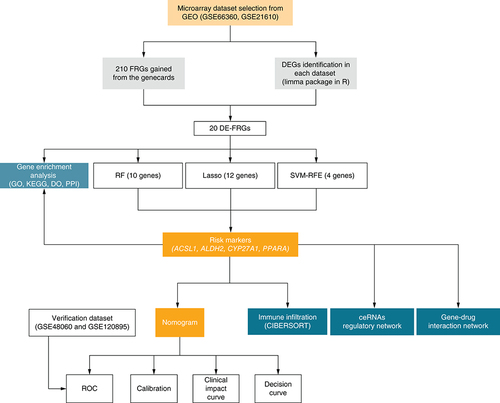
Research flow & the collection of DE-FRGs
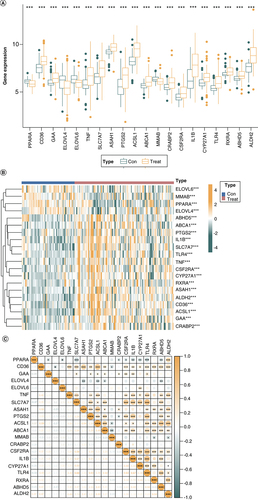
After downloading the dataset from GEO, quality control and normalization of the gene expression matrix were performed. Subsequently, differential analysis was executed for DEGs, intersecting with FRGs to generate 20 DE-FRGs. Among them, four were identified as risk biomarkers by the SVM-RFE algorithm, 12 by the LASSO algorithm, and 10 by the RF algorithm, respectively. After the intersection of these genes, four DE-FRGs were finally selected for nomogram. We then conducted KEGG, GO and DO analysis and established a protein–protein Interaction (PPI) network of the 20 DE-FRGs. Immuno-infiltration analysis, ceRNA regulatory network construction and gene–drug interaction network construction were undertaken based on the 4-DE-FRG (). Differential gene expression analysis was performed on the control and disease groups of the train set, and a total of 20 DE-FRGs were obtained. In the disease groups, the PPARA, CD36, ELOVL4, PTGS2, ACSL1, MMAB, CSF2RA, CYP27A1, RXRA, ABHD5 and ALDH2 were downregulated and GAA, ELOVL6, TNF, SLC7A7, ASAH1, ABCA1, CRABP2, IL1B and TLR4 were upregulated (A & B).
GO: Gene ontology; KEGG: Kyoto Encyclopedia of Genes and Genomes; GSEA: Gene Set Enrichment Analysis; PPI: Protein–protein Interaction.
(A) Box plots showing the differential gene expression in diseases and control samples. (B) Heat map showing the enrichment of 20-DE-FRG in control samples and disease samples. (C) Scatter plot showing the correlation among 20-DE-FRG.
*p < 0.05; **p < 0.01; ***p < 0.001, determined by Kruskal–Wallis test.
DE-FRG: Differentially expressed fatty acid metabolism related gene.
Construction & validation of the risk nomogram based on DE-FRGs
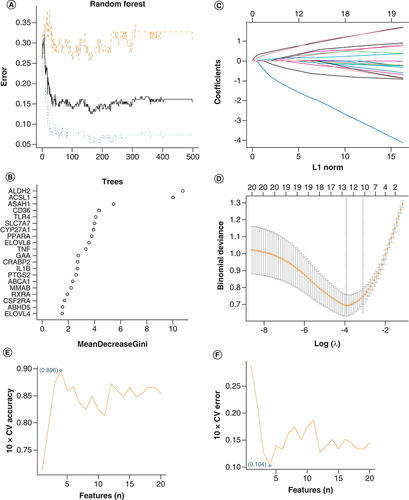
Among the 20 DE-FRGs, ten key biomarkers were identified by the RF algorithm with an importance score greater than 3 (A & B). Twelve genes were identified as important biomarkers with LASSO logistic regression algorithm (C & D). Later, four genes were identified as key biomarkers by the SVM-RFE algorithm (E & F). Following the intersection, four genes (ACSL1, ALDH2, CYP27A1 and PPARA) were obtained for subsequent analysis.
(A) Based on RF algorithm to screen biomarkers. (B) The mean decrease Gini of risk factors associated DE-FRGs based on RF analysis. (C & D) LASSO logistic regression algorithm to screen risk markers. (E & F) Based on SVM-RFE to screen biomarkers.
DE-FRG: Differentially expressed fatty acid metabolism related gene; SVM-RFE: Support vector machine recursive feature elimination.
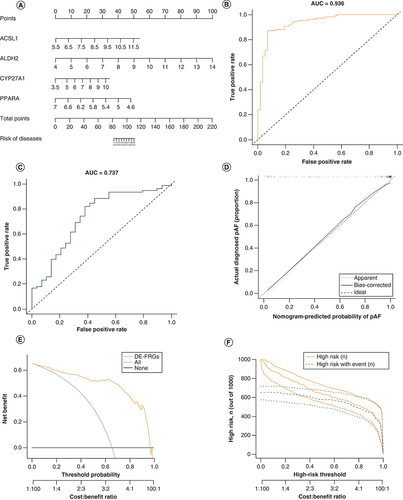
A risk model based on the 4-DE-FRG (ACSL1, ALDH2, CYP27A1 and PPARA) was constructed, and a nomogram (A) was drawn for clinical ease of use. According to the measurements of the 4 DE-FRGs expression levels in the patients blood, the user can find them on the corresponding scale in the nomogram and project them onto the top scale to read the points for each variant. The sum of each point is the total number of points, and the risk of disease for this patient can be obtained by projecting the total points downwards. The AUC of the train set was 0.936 (B), indicating that the risk nomogram had an excellent accuracy of predictive value. It was also confirmed by the test set (AUC = 0.737) (C). The calibration curves of the nomogram showed a good agreement in the train set (D). In addition, the clinical impact curves and the decision curve were proposed to assess the clinical usefulness of the risk prediction nomogram (E & F).
(A) Nomogram for the 4-DE-FRG risk model. (B) ROC curves of the train set. (C) ROC curves of the test set. (D) Calibration. The disease probabilities predicted by the nomogram are plotted on the x-axis, and the actual disease probabilities are plotted on the y-axis. (E) Decision curve. The abscissa of this graph is the threshold probability, and the ordinate is the net benefit. (F) Clinical impact curve. The green curve indicates the number of people classified as positive (diseases) by the model at each threshold probability; the orange curve is the number of true positives at each threshold probability.
AUC: Area under the curve; DE-FRG: Differentially expressed fatty acid metabolism related gene; ROC: Receiver operating characteristic.
Enrichment analysis of DE-FRGs in DCM & MI
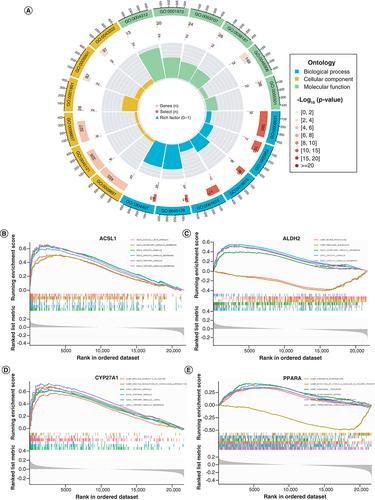
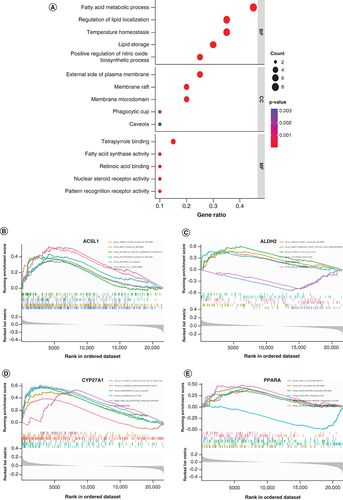
GO analysis revealed that DE-FRGs were mainly enriched in biological processes related to lipid metabolisms and small-molecule transport, such as fatty acid metabolic process, external side of plasma membrane and fatty acid synthase activity (A). The enriched GO terms for individual 4-DE-FRG were shown separately in B–E.
(A) GO analyses results of 20 DE-FRGs. (B–E) Sequentially, the significantly enriched GO terms for ACSL1, ALDH2, CYP27A1 and PPARA.
DE-FRG: Differentially expressed fatty acid metabolism related gene; GO: Gene ontology.
Similarly, KEGG analysis showed that DE-FRGs were mainly enriched in lipid metabolism pathways, such as adipocytokine signaling pathway, PPAR signaling pathway and lipid and atherosclerosis (A). The enriched KEGG terms for individual 4-DE-FRG were shown separately in B–E. These enrichments in DCM or MI suggested that their inhibitors could be considered potential therapeutic strategies for patients with DCM or MI.
(A) Pathway analysis results of 20 DE-FRGs; (B–E) The significantly enriched KEGG terms for ACSL1, ALDH2, CYP27A1 and PPARA, sequentially.
DE-FRG: Differentially expressed fatty acid metabolism related gene.
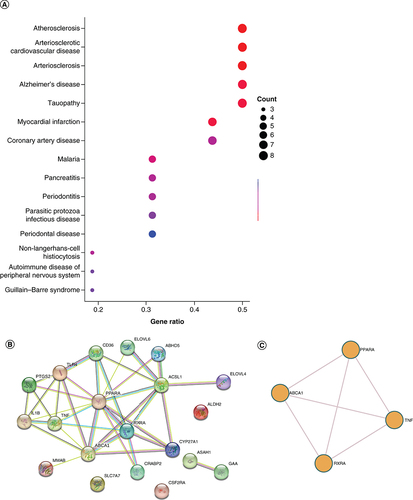
DO analysis presents 4 DE-FRGs associated diseases to facilitate further study of disease mechanisms. The top 15 most enriched diseases are atherosclerosis, arteriosclerotic, cardiovascular disease, arteriosclerosis, myocardial infarction, Alzheimer’s disease, tauopathy, malaria, coronary artery disease, pancreatitis, non-Langerhans-cell histiocytosis, periodontitis, parasitic protozoa infectious disease, autoimmune disease of peripheral nervous system, Guillain–Barre syndrome and periodontal disease (A). The STRING database was used to construct the PPI interaction network of 20 DE-FRGs (B). It was revealed that PPARA might be the hub node in all 20 DE-FRGs. Additionally, we performed enrichment analysis using Metascape (C), and the result is similar to B.
(A) DO analysis of the 20 DE-FRGs. (B) The PPI network on 20 DE-FRGs. (C) A network of enriched terms analyzed by Metascape.
DE-FRG: Differentially expressed fatty acid metabolism related gene; DO: Disease ontology. PPI network: Protein–protein Interaction network.
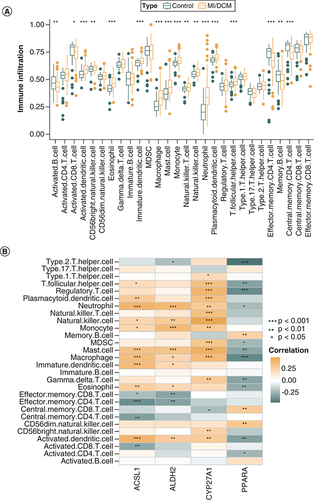
Analysis of immune infiltration
Seventeen immune cells significantly differed between MI or DCM patients and healthy individuals (A). Among them, activated B cell, activated CD8+ T cell, effector memory CD4+ T cell, memory B cell and central memory CD4+ T cell were lowly expressed in the disease group. PPARA was mainly positively correlated with adaptive immune cells and negatively correlated with innate immune cells, while ACSL1, ALDH2 and CYP27A1 were the opposite. (B).
(A) Box plot of the proportion of 28 types of immune cells. (B) Heatmap of the correlation between risk markers and infiltrating immune cells.
*p < 0.05; **p < 0.01; ***p < 0.001, determined by Kruskal–Wallis test.
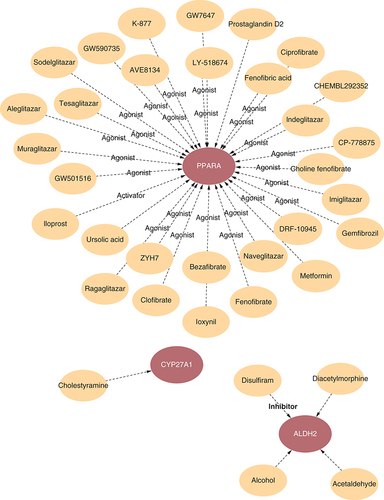
Construction of regulatory gene–drug network
A gene-drug network was created to provide more detailed information to illustrate the complex associations between drugs and the 4-DE-FRG targets. According to and Supplementary Table 2, multiple drugs have agonist roles in PPARA.
The red ovals represent the 4-DE-FRG affected by drugs. The orange ovals represent DCM/MI associated drugs.
DCM: Dilated cardiomyopathy; DE-FRG: Differentially expressed fatty acid metabolism related gene; MI: Myocardial infarction.
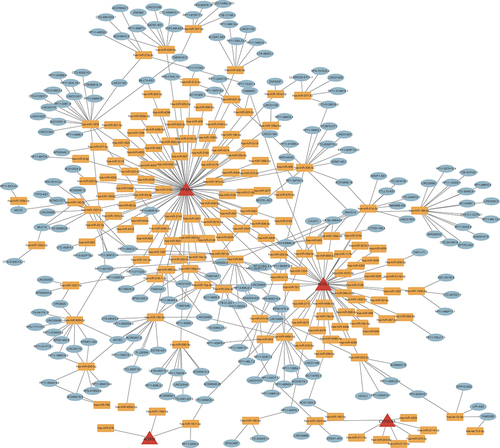
Construction of ceRNA network
To better explain the interactions of multiple RNA types at the gene level, three public websites, TargetScan, miRDB and miranda, were used to predict potential combinations between 4-DE-FRG and transcription factors. As shown in , all edges contained 412 nodes, 150 positively correlated miRNA-mRNA edges and 262 positively correlated miRNA-lncRNA edges.
The red triangles represent 4-DE-FRG. The orange squares represent miRNAs. The green ovals represent mRNAs or lncRNAs.
DE-FRG: Differentially expressed fatty acid metabolism related gene.
Discussion
The lack of effective diagnostic methods for DCM and MI presymptomatic patients makes it important to develop a stable risk model. Our study constructed a risk prediction nomogram for DCM and MI based on the 4-DE-FRG (ACSL1, ALDH2, CYP27A1 and PPARA), showing good performance in external validation (AUC = 0.737). Notably, all the four genes were upregulated in disease groups. Later pathway enrichment analysis uncovered that the 4 DE-FRGs are associated with lipid metabolism and small molecule transport pathways. In addition, the 4-DE-FRG was highly correlated with infiltrating immune and 35 drug candidates in DCM and MI.
The heart is a highly energy demanding organ with fatty acids as its leading energy supplier. Davila et al. found that cardiac fatty acid metabolism was decreased in DCM patients [Citation36]. Malonic acid can promote cardiomyocyte proliferation and heart regeneration in MI mice [Citation37]. Moreover, short-chain fatty acids are more easily oxidized and utilized in failing hearts [Citation38], representing a promising metabolic target.
PPARA regulates lipid metabolism, making it the core of atherosclerotic plaque formation [Citation39]. PPARA is protective against DCM and MI [Citation40,Citation41]. The PPARA agonist fenofibrate attenuates left ventricular diastolic abnormalities and systolic dysfunction to delay HF's progression and improve survival in HF animal models [Citation40,Citation42]. That is consistent with our belief that PPARA is protective. Exploring the mechanisms of PPARA in DCM and MI may be a breakthrough.
Seventeen immune cells significantly differed between MI or DCM patients and healthy individuals. Neutrophils may be a risk marker for the severity of HF in DCM patients [Citation43], and their elevation is related to poor prognosis in MI [Citation44]. Mast cells are influential in ventricular remodeling and HF progression in DCM mice [Citation43], and their stabilizers reduce ischemia/reperfusion injury in MI [Citation45,Citation46]. Blockade of NK cells and their receptors reduces inflammation and injury in DCM [Citation47–50]; similarly, NK cells increase inflammation in the infarct zone during MI. The function of adaptive immune cells during MI, such as CD4+ T [Citation51,Citation52], CD8+T [Citation53,Citation54], and Th2 [Citation55,Citation56], remains elusive. Few studies have considered how the 4 DE-FRGs affect DCM and MI inflammation, which may be necessary as the essential polyunsaturated fatty acids produce the most potent inflammatory mediators of MI [Citation57,Citation58]. According to our results and the research mentioned above, ACSL1, ALDH2 and CYP27A1 were positively associated with more harmful cells, whereas PPARA was negatively associated with them. That corresponds to our nomogram that ACSL1, ALDH2 and CYP27A1 are risk factors and PPARA is a protective factor. However, uncertainty about the role of immune cells in DCM and MI leaves these speculations to further investigation.
By KEGG and GO analysis, we found that lipid metabolism and small molecule transport-related pathways, such as the fatty acid metabolic process, the external side of the plasma membrane and the fatty acid synthase activity, were enriched in DCM and MI. By constructing a gene–drug regulatory network, we also revealed that thirty agonists and activators were sensitive to PPARA, which might be a promising drug target against DCM and MI. In contrast, the correlation between other genes and existing drugs requires more investigation. Noncoding RNAs have been evaluated as potential diagnostic and therapeutic targets for various cardiovascular diseases [Citation59,Citation60], including DCM [Citation61,Citation62]. Simultaneously, the lncRNA-miRNA-mRNA axis can link lncRNAs to various regulatory functions in MI [Citation63]. Therefore, constructing ceRNA regulatory networks may lead to potential diagnostic and therapeutic targets. Our result shows that PPARA was regulated by the maximum number of miRNAs among the 4 DE-FRGs, suggesting that it might be a hub node of the diagnosis and treatment for DCM and MI.
Limitations
First, this study is a retrospective study designed based on a public database, and the developed model lacks evidence from in vivo and in vitro experiments. More animal experiments and extensive clinical samples are needed. Second, the public datasets provided limited information on the samples, with missing data on the source of the samples, age, BMI and gender of the sample donors. Additionally, DCM is a complex disease with heterogeneous pathological mechanisms [Citation64]. We did not consider that different etiologies expressed relevant pathways may respond differently to treatment, possibly leading to inaccurate model predictions. In the future, it is of prospective clinical value to experimentally investigate the role of immune cells and ceRNA regulatory networks in the development of DCM or MI.
Conclusion
In this study, we constructed a 4-DE-FRG nomogram and identified potential biological targets for the early diagnosis and treatment of DCM and MI.
A risk model based on the 4-differentially expressed fatty acid metabolism related gene (DE-FRG) (ACSL1, ALDH2, CYP27A1 and PPARA) was constructed. The area under the curve of the train set was 0.936 (B), and that of the test set was 0.737 (C).
PPARA was mainly positively correlated with adaptive immune cells and negatively correlated with innate immune cells, while ACSL1, ALDH2 and CYP27A1 were the opposite. That corresponds to our nomogram that ACSL1, ALDH2 and CYP27A1 are risk factors and PPARA is a protective factor.
Lipid metabolism and small molecule transport-related pathways, such as the fatty acid metabolic process, the external side of the plasma membrane and the fatty acid synthase activity, were enriched in dilated cardiomyopathy and myocardial infarction.
The PPI interaction network of 20 DE-FRGs revealed that PPARA might be the hub node in all 20 DE-FRGs. Multiple drugs have agonist roles in PPARA. PPARA was regulated by the maximum number of miRNAs among the 4 DE-FRGs.
Author contributions
Conception and design: B Huang, H Lin, Z Zhuo, Y Luo, B Zhou; Administrative support: Q Zhang, H Zhang, K Chen; Provision of study materials or patients: B Huang, H Lin, Z Zhuo, Y Luo, B Zhou; Collection and assembly of data: B Huang, H Lin, Z Zhuo, Y Luo, B Zhou, W Sha, J Wei; Data analysis and interpretation: B Huang, H Lin, Z Zhuo, Y Luo, B Zhou, L Luo; Manuscript writing: All authors; Final approval of manuscript: All authors. K Chen, H Zhang, Q Zhang and have contributed equally as corresponding authors.
Ethical conduct of research
The authors state that they have obtained appropriate institutional review board approval or have followed the principles outlined in the Declaration of Helsinki for all human or animal experimental investigations.
Data sharing statement
The authors certify that this manuscript reports the secondary analysis of clinical trial data that have been shared with them, and that the use of this shared data is in accordance with the terms (if any) agreed upon their receipt.
Supplemental Text 1
Download PNG Image (167.7 KB)
Supplemental Text 2
Download MS Excel (67 KB)Supplemental Text 3
Download MS Excel (10.1 KB)Acknowledgments
The original data in our study were retrieved from the GEO database (https://www.ncbi.nlm.nih.gov/geo) and we gratefully acknowledge the contributions from public available databases.
Supplementary data
To view the supplementary data that accompany this paper please visit the journal website at:www.tandfonline.com/doi/suppl/10.2144/fsoa-2023-0008
Financial & competing interests disclosure
This work was funded by the National Natural Science Foundation of China (82171698, 81300279, 81741067, 82170561), Project to Attract Foreign Experts from Minister of Science and Technology of China (G2022030047L), the Natural Science Foundation for Distinguished Young Scholars of Guangdong Province (2021B1515020003), famous overseas teachers from Science and Technology Department of Province (KD0120220129), national-level university students Innovative Training Program (202210570012), Natural Science Foundation of Guangdong Province (2022A1515012081), the Climbing Program of Introduced Talents and High-level Hospital Construction Project of Provincial People’s Hospital (KJ012019099, KJ012021143, KY012021183, DFJH201803), Guangdong Science and Technology Innovation Strategy Special Funds (pdjh2023b0429), Jointly funded by Guangzhou Municipal Bureau of Science and Technology for ‘Dengfeng Hospital’ project (SL2022A03J00586, SL2023A03J00586), Science and Technology Innovation Project for college students of Guangzhou Medical University (2021A028). The authors have no other relevant affiliations or financial involvement with any organization or entity with a financial interest in or financial conflict with the subject matter or materials discussed in the manuscript apart from those disclosed.
No writing assistance was utilized in the production of this manuscript.
References
- MerloM , PivettaA , PinamontiBet al.Long-term prognostic impact of therapeutic strategies in patients with idiopathic dilated cardiomyopathy: changing mortality over the last 30 years. Eur. J. Heart Fail.16(3), 317–324 (2014).
- SamskyMD , MorrowDA , ProudfootAG , HochmanJS , ThieleH , RaoSV. Cardiogenic shock after acute myocardial infarction: a review. J. Am. Med. Assoc.326(18), 1840–1850 (2021).
- ReichartD , MagnussenC , ZellerT , BlankenbergS. Dilated cardiomyopathy: from epidemiologic to genetic phenotypes: a translational review of current literature. J. Intern. Med.286(4), 362–372 (2019).
- TirdeaC , HostiucS , MoldovanH , Scafa-UdristeA. Identification of risk genes associated with myocardial infarction-big data analysis and literature review. Int. J. Mol. Sci.23(23), 15008 (2022).
- KwongJC , SchwartzKL , CampitelliMAet al.Acute myocardial infarction after laboratory-confirmed influenza infection. N. Engl. J. Med.378(4), 345–353 (2018).
- MerloM , CannataA , GobboM , StolfoD , ElliottPM , SinagraG. Evolving concepts in dilated cardiomyopathy. Eur. J. Heart Fail.20(2), 228–239 (2018).
- BraunwaldE. Unstable angina and non-ST elevation myocardial infarction. Am. J. Respir. Crit. Care Med.185(9), 924–932 (2012).
- SchultheissHP , FairweatherD , CaforioALPet al.Dilated cardiomyopathy. Nat. Rev. Dis. Primers5(1), 32 (2019).
- YusufS , HawkenS , OunpuuSet al.Effect of potentially modifiable risk factors associated with myocardial infarction in 52 countries (the INTERHEART study): case–control study. Lancet364(9438), 937–952 (2004).
- FradeAF , LaugierL , FerreiraLRet al.Myocardial infarction-associated transcript, a long noncoding RNA, is overexpressed during dilated cardiomyopathy due to chronic chagas disease. J. Infect. Dis.214(1), 161–165 (2016).
- BelkeDD , LopaschukGD. Fatty acid metabolism in the reperfused ischemic heart. In: Advances in Lipobiology.GrossRW ( Ed.). Elsevier, 29–46 (1997).
- YangY , ZhangH , LiX , YangT , JiangQ. Effects of PPARα/PGC-1α on the energy metabolism remodeling and apoptosis in the doxorubicin induced mice cardiomyocytes in vitro. Int. J. Clin. Exp. Pathol.8(10), 12216–12224 (2015).
- KobaraM , ShiraishiT , NodaK , TobaH , NakataT. Eicosapentaenoic acid preserves mitochondrial quality and attenuates cardiac remodeling after myocardial infarction in rats. J. Cardiovasc. Transl.Res. (2023).
- RitchieME , PhipsonB , WuDet al.limma powers differential expression analyses for RNA-sequencing and microarray studies. Nucleic Acids Res.43(7), e47 (2015).
- LeekJT , StoreyJD. Capturing heterogeneity in gene expression studies by surrogate variable analysis. PLoS Genet.3(9), 1724–1735 (2007).
- SchwientekP , EllinghausP , SteppanSet al.Global gene expression analysis in nonfailing and failing myocardium pre-and postpulsatile and nonpulsatile ventricular assist device support. Physiol. Genom.42(3), 397–405 (2010).
- MuseED , KramerER , WangHet al.A whole blood molecular signature for acute myocardial infarction. Sci. Rep.7(1), 1–9 (2017).
- WittE , HammerE , DörrMet al.Correlation of gene expression and clinical parameters identifies a set of genes reflecting LV systolic dysfunction and morphological alterations. Physiol. Genom.51(8), 356–367 (2019).
- SureshR , LiX , ChiriacAet al.Transcriptome from circulating cells suggests dysregulated pathways associated with long-term recurrent events following first-time myocardial infarction. J. Mol. Cell. Cardiol.74, 13–21 (2014).
- KoldeR , KoldeM. Package ‘pheatmap’. R. Package1(7), (2015).
- KassambaraA , KassambaraMA. Package ‘ggpubr’. R Package Version 0.16, (2020).
- YuG , WangLG , HanY , HeQY. clusterProfiler: an R package for comparing biological themes among gene clusters. OMICS16(5), 284–287 (2012).
- StroblC , BoulesteixAL , ZeileisA , HothornT. Bias in random forest variable importance measures: illustrations, sources and a solution. BMC Bioinform.8, 25 (2007).
- WangH , YangF , LuoZ. An experimental study of the intrinsic stability of random forest variable importance measures. BMC Bioinform.17, 60 (2016).
- TibshiraniR. Regression shrinkage and selection via the Lasso. J. Royal Stat. Society: Ser. B (Methodological)58(1), 267–288 (1996).
- SuykensJAK , VandewalleJ. Generation of n-Double Scrolls (n = 1, 2, 3, 4, …). IEEE Trans. Circuits Syst.–I40(11), 861–167 (1993).
- WickhamH , FrançoisR , HenryL , MüllerK. dplyr: a grammar of data manipulation. R package version 1.0.0. (2020). https://dplyr.tidyverse.org/
- BlancheP , DartiguesJF , Jacqmin-GaddaH. Estimating and comparing time-dependent areas under receiver operating characteristic curves for censored event times with competing risks. Stat. Med.32(30), 5381–5397 (2013).
- HarrellFEJr. rms: regression modeling strategies. R package version5(2), 1–263 (2016).
- SingT , SanderO , BeerenwinkelN , LengauerT. ROCR: visualizing classifier performance in R. Bioinformatics21(20), 3940–3941 (2005).
- WeiJ , HuangB , NongYet al.Identification of a novel cuproptosis-related gene signature in eutopic endometrium of women with endometriosis. Reproduct. Sci.29(12), 1–13 (2022).
- HarrellFEJr , HarrellMFEJr. Package ‘hmisc’. CRAN20182019, 235–236 (2019).
- GrothendieckG. lattice: Multivariate Data Visualization with R. J. Stat. Softw.25, 1–3 (2008).
- ZeileisA , CroissantY. Extended model formulas in R: multiple parts and multiple responses. J. Stat. Softw.34, 1–13 (2010).
- CottoKC , WagnerAH , FengYYet al.DGIdb 3.0: a redesign and expansion of the drug-gene interaction database. Nucleic Acids Res.46(D1), D1068–D1073 (2018).
- Davila-RomanVG , VedalaG , HerreroPet al.Altered myocardial fatty acid and glucose metabolism in idiopathic dilated cardiomyopathy. J. Am. Coll. Cardiol.40(2), 271–277 (2002).
- BaeJ , SalamonRJ , BrandtEBet al.Malonate promotes adult cardiomyocyte proliferation and heart regeneration. Circulation143(20), 1973–1986 (2021).
- CarleyAN , MauryaSK , FasanoMet al.Short-chain fatty acids outpace ketone oxidation in the failing heart. Circulation143(18), 1797–1808 (2021).
- RicoteM , HuangJT , WelchJS , GlassCK. The peroxisome proliferator-activated receptor (PPARgamma) as a regulator of monocyte/macrophage function. J. Leukoc. Biol.66(5), 733–739 (1999).
- IchiharaS , ObataK , YamadaYet al.Attenuation of cardiac dysfunction by a PPAR-alpha agonist is associated with down-regulation of redox-regulated transcription factors. J. Mol. Cell. Cardiol.41(2), 318–329 (2006).
- LiY , XiongZ , YanWet al.Branched chain amino acids exacerbate myocardial ischemia/reperfusion vulnerability via enhancing GCN2/ATF6/PPAR-alpha pathway-dependent fatty acid oxidation. Theranostics10(12), 5623–5640 (2020).
- BrigadeauF , GeleP , WibauxMet al.The PPARalpha activator fenofibrate slows down the progression of the left ventricular dysfunction in porcine tachycardia-induced cardiomyopathy. J. Cardiovasc. Pharmacol.49(6), 408–415 (2007).
- AvciA , AlizadeE , FidanSet al.Neutrophil/lymphocyte ratio is related to the severity of idiopathic dilated cardiomyopathy. Scand. Cardiovasc. J.48(4), 202–208 (2014).
- KologrivovaI , ShtatolkinaM , SuslovaT , RyabovV. Cells of the immune system in cardiac remodeling: main players in resolution of inflammation and repair after myocardial infarction. Front. Immunol.12, 664457 (2021).
- PalaniyandiSelvaraj S , WatanabeK , MaM , TachikawaH , KodamaM , AizawaY. Involvement of mast cells in the development of fibrosis in rats with postmyocarditis dilated cardiomyopathy. Biol. Pharm. Bull.28(11), 2128–2132 (2005).
- KupreishviliK , FuijkschotWW , VonkABet al.Mast cells are increased in the media of coronary lesions in patients with myocardial infarction and may favor atherosclerotic plaque instability. J. Cardiol.69(3), 548–554 (2017).
- JaggiAS , SinghM , SharmaA , SinghD , SinghN. Cardioprotective effects of mast cell modulators in ischemia-reperfusion-induced injury in rats. Methods Find. Exp. Clin. Pharmacol.29(9), 593–600 (2007).
- KlarlundK , PedersenBK , TheanderTG , AndersenV. Depressed natural killer cell activity in acute myocardial infarction. Clin. Exp. Immunol.70(1), 209–216 (1987).
- GalatiD , DeMartino M , TrottaAet al.Peripheral depletion of NK cells and imbalance of the Treg/Th17 axis in idiopathic pulmonary fibrosis patients. Cytokine66(2), 119–126 (2014).
- ZhangZX , HuangX , JiangJet al.Natural killer cells play a critical role in cardiac allograft vasculopathy in an interleukin-6--dependent manner. Transplantation98(10), 1029–1039 (2014).
- YangZ , DayYJ , ToufektsianMCet al.Myocardial infarct-sparing effect of adenosine A2A receptor activation is due to its action on CD4+ T lymphocytes. Circulation114(19), 2056–2064 (2006).
- YanX , ShichitaT , KatsumataYet al.Deleterious effect of the IL-23/IL-17A axis and gammadeltaT cells on left ventricular remodeling after myocardial infarction. J. Am. Heart Assoc.1(5), e004408 (2012).
- ShintaniY , ItoT , FieldsLet al.IL-4 as a repurposed biological drug for myocardial infarction through augmentation of reparative cardiac macrophages: Proof-of-Concept Data in Mice. Sci. Rep.7(1), 6877 (2017).
- LiC , ZongW , ZhangMet al.Increased ratio of circulating T-helper 1 to T-helper 2 cells and severity of coronary artery disease in patients with acute myocardial infarction: a prospective observational study. Med. Sci. Monit.25, 6034–6042 (2019).
- SavvaGM , PachnioA , KaulBet al.Cytomegalovirus infection is associated with increased mortality in the older population. Aging Cell12(3), 381–387 (2013).
- IlatovskayaDV , PittsC , ClaytonJet al.CD8(+) T-cells negatively regulate inflammation post-myocardial infarction. Am. J. Physiol. Heart Circ. Physiol.317(3), H581–H596 (2019).
- HaladeGV , TourkiB. Specialized pro-resolving mediators directs cardiac healing and repair with activation of inflammation and resolution program in heart failure. Adv. Exp. Med. Biol.1161, 45–64 (2019).
- SerhanCN , LevyBD. Resolvins in inflammation: emergence of the pro-resolving superfamily of mediators. J. Clin. Invest.128(7), 2657–2669 (2018).
- BeermannJ , PiccoliMT , ViereckJ , ThumT. Non-coding RNAs in development and disease: background, mechanisms, and therapeutic approaches. Physiol. Rev.96(4), 1297–1325 (2016).
- LuD , ThumT. RNA-based diagnostic and therapeutic strategies for cardiovascular disease. Nat. Rev. Cardiol.16(11), 661–674 (2019).
- LiH , ChenC , FanJet al.Identification of cardiac long non-coding RNA profile in human dilated cardiomyopathy. Cardiovasc. Res.114(5), 747–758 (2018).
- WangK , LongB , ZhouLYet al.CARL lncRNA inhibits anoxia-induced mitochondrial fission and apoptosis in cardiomyocytes by impairing miR-539-dependent PHB2 downregulation. Nat. Commun.5, 3596 (2014).
- CesanaM , CacchiarelliD , LegniniIet al.A long noncoding RNA controls muscle differentiation by functioning as a competing endogenous RNA. Cell147(2), 358–369 (2011).
- Calderon-DominguezM , BelmonteT , Quezada-FeijooMet al.Emerging role of microRNAs in dilated cardiomyopathy: evidence regarding etiology. Transl. Res.215, 86–101 (2020).