 ?Mathematical formulae have been encoded as MathML and are displayed in this HTML version using MathJax in order to improve their display. Uncheck the box to turn MathJax off. This feature requires Javascript. Click on a formula to zoom.
Abstract
Many segmentation techniques have been published, and some of them have been widely used in different application problems. Most of these segmentation techniques have been motivated by specific application purposes. Unsupervised methods, which do not assume any prior scene knowledge can be learned to help the segmentation process, and are obviously more challenging than the supervised ones. In this paper, we present an unsupervised strategy for biomedical image segmentation using an algorithm based on recursively applying mean shift filtering, where entropy is used as a stopping criterion. This strategy is proven with many real images, and a comparison is carried out with manual segmentation. With the proposed strategy, errors less than 20% for false positives and 0% for false negatives are obtained.
Introduction
Image segmentation is a fundamental process in many image, video, and computer vision applications. It is often used to partition an image into separate clusters or regions, which ideally correspond to different real-world objects. The definition of suitable similarity and homogeneity measures is a fundamental task in many important applications, ranging from geology and remote sensing to biology and medicine in the determination of the homogeneity of an organ. Image segmentation is a critical step towards visual pattern recognition and image understanding.
For years, image segmentation has been used in a supervised and an unsupervised way.Citation1–Citation7 However, unsupervised methods, which do not assume any prior scene knowledge in order to help the segmentation process, are obviously more challenging than supervised methods. In this paper, an unsupervised approach will be proposed which does not depend strongly on previously acquired information. The aim of such an unsupervised strategy is to find an appropriate segmentation process in difficult image scenes, just as is done for biomedical images.
It is known that biomedical images are often corrupted by noise and sampling artifacts, which can cause considerable difficulties when applying rigid methods. However, segmented biomedical images are now used routinely in a multitude of different applications, including diagnosis, treatment planning, localization of pathology, study of anatomic structure, and computer-integrated surgery. Thus, it is important to obtain robust segmentation methods for these types of images.
Nevertheless, in spite of the most complex algorithms developed until the present, segmentation continues to be very dependent on the application used, and there is no single method that can solve the multitude of present problems.
An example of the unsupervised segmentation method is mean shift. In this paper, we present an unsupervised strategy for biomedical image segmentation using an algorithm based on recursively applying mean shift filtering, where entropy is used as a stopping criterion.
Mean shift is a robust technique which has been used in many computer vision tasks. This is a nonparametric procedure and is an extremely versatile tool for feature analysis and can provide reliable solutions in many applications. Citation8,Citation9 Mean shift was proposed in 1975 by Fukunaga and Hostetler,Citation10 and largely forgotten until Cheng’s paperCitation11 rekindled interest in it.
The term entropy is not a new concept in the field of information theory. Entropy has been used in image restoration, edge detection, and recently, as an objective evaluation method for image segmentation.Citation12
The results obtained with the proposed algorithm are compared with manually segmented images. Our interest and main motivation for this research was to determine the robustness of our algorithm for biomedical images, while segmenting some types of lesions in an unsupervised way. In this work, lesions are the important information to be extracted from these images.
Theoretic aspects
The basic concept of the mean shift algorithm is as follows. Let xi be an arbitrary set of n points in the d dimensional space. The kernel density estimation f(x) is obtained with the kernel function K(x) and window radius h. The f(x) is defined as:
Here, the Epanechnikov function is chosen as the kernel function. The Epanechnikov function is defined as:
The differential of f(x) is formulated as:
Therefore:
where the region Sh(x) is a hypersphere of radius h having volume hdcd, centered at x, and containing nx data points, ie, the uniform kernel. In addition, in this case d = 3, for the x vector of three dimensions, two for the spatial domain and one for the range domain (gray levels). The last factor in expression (Equation4(4) ) is called the “sample mean shift”:
The quantity nx/n(hd cd) is the kernel density estimate f̂U(x) (where U means the uniform kernel) computed with the hypersphere Sh(x), and thus we can write the expression (Equation4(4) ) as:
which yields:
EquationEquation (7)(7) shows that an estimate of the normalized gradient can be obtained by computing the sample mean shift in a uniform kernel centered on x. In addition, the mean shift has the direction of the gradient of the density estimate at x when this estimate is obtained with the Epanechnikov kernel. Since the mean shift vector always points towards the direction of the maximum increase in the density, it can define a path leading to a local density maximum, ie, to a mode of the density.
Other works have proven that, in the case of unimodal histograms, the mean shift vector points towards the mode.Citation8–Citation10 Another very interesting recent result, in the case of unimodal histogram, is also using the fractal dimension.Citation13
In work by Comaniciu and MeerCitation9 it was proven that the mean shift procedure, obtained by successively computing the mean shift vector Mh (x) and translating the window Sh (x) by Mh (x) guarantees convergence.
Therefore, if the individual mean shift procedure is guaranteed to converge, a recursive procedure of the mean shift also converges. In other words, if one considers the recursive procedure as the sum of many procedures of the mean shift, and each individual procedure converges, the recursive procedure then converges as well. This claim has already been proven by Grenier et al.Citation14 The open question is when to stop the recursive procedure. The answer lies in the use of entropy, as shown below.
Entropy
From the point of view of digital image processing, the entropy of an image is defined as:
where B is the total quantity of bits of the digitized image and by agreement, log2(0) = 0; p(x) is the probability of occurrence of a gray-level value. Within a totally uniform region, entropy reaches the minimum value. Theoretically speaking, the probability of occurrence of the gray-level value within a uniform region is always one. In practice, when one works with real images, the entropy value does not reach, in general, the zero value. This is due to the noise in the image. Therefore, if we consider entropy as a measure of the disorder within a system, it could be used as a good stopping criterion for an iterative process, by using mean shift filtering. Entropy within each region diminishes in measure, so that the regions and the whole image become more homogeneous until reaching a stable value. When convergence is reached, a totally segmented image is obtained, because the mean shift filtering is not idempotent. As pointed out by Comaniciu and Meer,Citation9 the mean shift-based image segmentation procedure is a straightforward extension of the discontinuity preserving smoothing algorithm, and the segmentation step does not add a significant overhead to the filtering process.
The choice of entropy as a measure of goodness deserves several observations. Entropy reduces the randomness in corrupted probability density functions and tries to counteract noise. Then, following this analysis, because the segmented image is a simplified version of the original image, entropy of the segmented image should be smaller. Recently, it was found empirically that the entropy of the noise diminishes faster than that of the signal.Citation12 Therefore, an effective threshold at which to stop would be when the relative rate of change of entropy, from one iteration to the next, falls below a given threshold. This is the essential part of this work.
Algorithms
In this section, two algorithms are given, one related to the filtering of the signal and the other related to the segmentation step.
Algorithm 1
Filtering algorithm by using the mean shift
Let Xi and Zi, i = 1, .., n, be the input and filtered images in the joint spatial-range domain. For each pixel P ∈ Xi, P = (x, y, z)∈R3, where (x, y) ∈ R2 and z ∈ [0, 2β − 1], β being the quantity of bits/pixel in the image. The filtering algorithmCitation9 comprises the following steps:
Initialize j = 1 and yi, 1 = pi.
Compute through the mean shift (see expression (Equation5
(5) ), yi, j+1), the mode where the pixel converges, ie, calculation of the mean shift is carried out until convergence, y = yi,c.
Store at Zi the component of the gray level of calculated value, Zi =(xsi, yri,c), where xsi is the spatial component and yri,c is the range component.
Algorithm 2
Segmentation algorithm by recursively applying the mean shift filtering
Let ent1 be the initial value of entropy of the first iteration. Let ent2 be the second value of entropy after the first iteration. Let errabs be the absolute value of the difference of entropy between the first one and the second iteration. Let edsEnt be the threshold to stop the iterations, ie, this is the threshold to stop when the relative rate of change of entropy, from one iteration to the next, falls below this threshold. Then, the segmentation algorithm comprises the following steps:
Initialize ent2 = 1, errabs = 1, edsEnt = 0.001.
While errabs > edsEnt, then:
Filter image according to the steps of the previous algorithm, and store the filtered image in Z[k]
Calculate entropy from the filtered image according to expression (Equation8
Calculate the absolute difference with the entropy value obtained in the previous step; errabs = /ent1 – ent2/.
Update the value of the parameter; ent2 = ent1; Z[k +1] = Z[k].
It is possible to observe that, in this case, the unsupervised segmentation algorithm is a direct extension of the filtering algorithm, which finishes when entropy reaches stability.
Christoudias et alCitation15 state that the recursive application of the mean shift property yields a simple mode detection procedure. The modes are the local maxima of the density. Therefore, with the new segmentation algorithm, by recursively applying mean shift, convergence is guaranteed. Indeed, the proposed algorithm is a straightforward extension of the filtering process. ComaniciuCitation8 has proven that the mean shift procedure converges. In other words, one can consider the new segmentation algorithm as a concatenated application of individual mean shift-filtering operations. Therefore, if we consider the whole event as linear, the recursive algorithm converges. As one can observe, this algorithm does not need any previous condition to carry out the segmentation process, therefore it is an unsupervised method.
Results and discussion
Method of evaluation
Manual segmentation generally gives the best and most reliable results when identifying structures for a particular clinical task. At present, due to the lack of ground truth, the quantitative evaluation of a segmentation technique is difficult to achieve. An alternative is to use manual- segmentation results as the ground truth.
In order to evaluate the performance of the methods, we calculate the percentage of false negatives (FN [lesions], which are not found by the algorithm) and the false positives (FP, [noise], which are classified as lesions). These are defined according to the following expressions:
where Vp is the actual number quantity of lesions identified by the physician, fn being the quantity of lesions, which were not marked by the algorithm, and fp being the number of spurious regions, which were marked as lesions.
Discussion of experimental results
In order to show more clarity of the lesions isolated and shown here, some details of the original images are given. Studied images were of arteries containing atherosclerotic lesions obtained from different parts of the human body. These arteries were contrasted with a special tint in order to accentuate the different lesions in the arteries. The arteries were digitalized directly from the working desk via the MADIP system with a resolution of 512 × 512 × 8 bit/pixels.Citation16 For more details on the characteristics of these images, see the paper by Rodríguez and Pacheco.Citation17 Another lesion type isolated is caused by glaucoma, a group of diseases of the visual system that can lead to damage of the optic nerve and result in blindness.
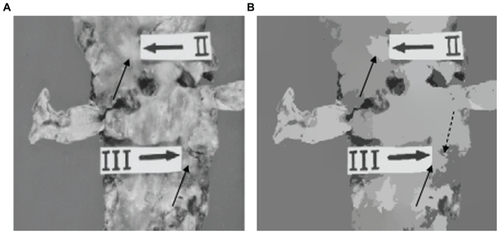
shows a first unsupervised segmentation example. Although another segmentation method was already applied to other atherosclerotic lesions,Citation17 here one can observe the obtained result when applying an unsupervised strategy. In , one can note that lesion Type IV that appears in the original image was isolated (see arrows in ). According to the criteria of physicians, this is a good result, because the algorithm is able to isolate the lesion without any previous condition. In addition, one can also see that the segmented image with the mean shift algorithm is totally free of noise. This is another important aspect when the mean shift filtering is used. In , another example of the application of our unsupervised strategy on an atherosclerosis image is shown. According to the criteria of physicians, the obtained results were good, and in particular for lesion Type II. However, in lesion Type III, a small area was generated, due to preparation of the samples.
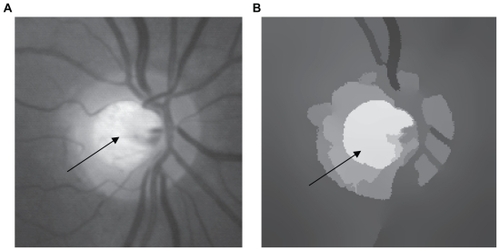
Figure 1 (A) Original image and (B) unsupervised segmentation using our algorithm. The arrows mark the isolated lesions.
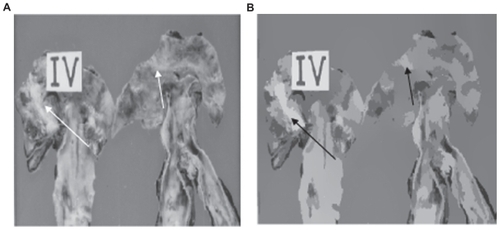
Figure 2 (A) Original image and (B) segmentation using our unsupervised strategy. The arrows indicate isolated lesions. The split arrow indicates a zone which is not a lesion.
Other examples of real images are shown in and . Here one can see the results obtained by applying our unsupervised segmentation strategy. According to the criteria of physicians, one can see that the unsupervised method is able to isolate atherosclerotic lesions effectively. Again, the segmented images with the mean shift algorithm were very clean of noise, which is very important in a segmentation process. However, some FP were generated (see split arrows). In practice, it is very difficult to eliminate the problem of FP completely in real images. FP can arise in the segmentation process due to bad preparation of the samples or abrupt changes in illumination. Another example is shown in . In this case, the main objective is to isolate the oval from the vascular net of the eye (see arrow). This is of great importance for the study of glaucoma. According to the criteria of physicians, the discrimination of this area is of great importance in order to identify the stage of the disease. In this example, the zone is isolated effectively.
Figure 3 (A) Original image. (B) Segmentation by using our unsupervised strategy. The arrows indicate the isolated lesions. Note the quality of segmentation of the Type lesion in (B).
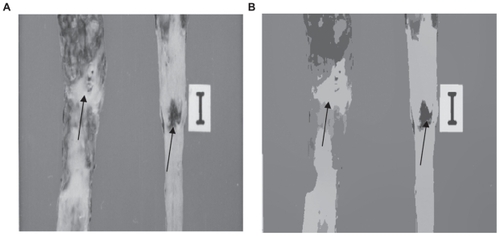
Figure 4 (A) Original image and (B) segmentation using our unsupervised strategy. The arrows indicate the isolated lesions. The split arrows indicate zones which are not lesions.
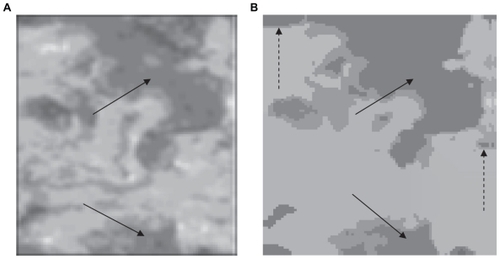
Figure 5 (A) Original image and (B) segmentation using our unsupervised strategy. The arrow indicates the isolated lesion.
It is important to point out that in all segmentation experiments, we use the same parameters hs and hr when applying the mean shift filtering (hr = 15, hs = 12). The value of hs is related to the spatial resolution of the analysis, while the value hr defines the range resolution. It is necessary to note that the spatial resolution hs has a different effect on the output image when compared with the gray level resolution (hr, spatial range). Only features with large spatial support are represented in the segmented image with our algorithm when hs is increased. On the other hand, only features with high contrast survive when hr is large. Therefore, the quality of segmentation is controlled by the spatial value hs and the range (gray level) hr, with the resolution parameters defining the radii of the windows in the respective domains.
Verification of results
Because the main purpose of this work was to analyze the performance of our unsupervised segmentation strategy, it is important to compare the results of our approach with those of manual segmentation. Results have been confirmed by qualitative and quantitative comparisons of results obtained by the visual observations of physicians, from which FP and FN were selected. For this reason, we did not do a comparative study with other methods. The numeric results are summarized in the . We carried out this comparison with all images (n = 40), but all images are not shown due to space considerations. Five images are summarized in the , in which it can be observed that the error for FN was 0%, ie, all regions belonging to the lesions were detected. This denotes correct performance of our unsupervised strategy. This behavior was the same for all segmented images. In and , the FP are shown with arrows as indicated, according to the criteria of physicians. We verify that the number of FP is less than 20%. In other words, in and (see arrows) it can be observed that the unsupervised segmentation process was not completely correct. FP may arise due to abrupt variation of illumination or can be created by a problem in preparation of samples. In practice, these problems are very difficult to eliminate completely in real images. Therefore, the result from the unsupervised segmentation process was presented to physicians for manual segmentation. With a few mouse clicks on the final result, the FP are completely eliminated. This unsupervised strategy applied to this type of lesion is part of a global image analysis process, which will be improved in future research. According to the criteria of physicians, the global performance of this unsupervised strategy can be considered suitable for these applications.
Table 1 Numerical results of the validation
Conclusion
In this work, we propose an unsupervised strategy in order to isolate lesions in biomedical images. We have devised an algorithm which correctly identifies atherosclerotic and glaucomatous lesions. This unsupervised algorithm did not produce spike noise. We showed via experimentation using real-image data that this unsupervised strategy is robust for the type of images considered here. This strategy was tested, according to the criteria of physicians, where the percentage of FN was 0% and for FP less than 20%. In future work, this unsupervised strategy will be applied to these images with a finer stopping threshold. The unsupervised algorithm can be applied to other types of images, and it can be extended to other tasks of biomedical image analysis where methods of segmentation are required.
Disclosure
The authors report no conflicts of interest in this work.
References
- KenongWGauthierDLevineMDLive cell image segmentationIEEE Trans Biomed Engineering1995421111
- SijbersJScheundersPVerhoyeMvan der LindenAvan DyckDRamanEWatershed-based segmentation of 3D MR data for volume quatizationMagn Reson Imaging 19971566796889285807
- Chin-HsingCLeeJWangJMaoCWColor image segmentation for bladder cancer diagnosisMathl Comput Modeling1998272103120
- RodríguezRAlarcónTWongRSanchezLColor segmentation applied to study of the angiogenesis. Part IJ Intell Robot Sys20023418397
- SchmidPSegmentation of digitized dermatoscopic images by two-dimensional color clusteringIEEE Trans Med Imaging199918216417110232673
- KossJENewmanFDJohnsonTKKirchDLAbdominal organ segmentation using texture transforms and a hopfield neural networkIEEE Trans Med Imaging.1999187256264
- BraiekEBCherietMDoreVSKCS – A separable kernel family with compact support to improve visual segmentation of handwritten dataElectronic Lett Computer Vision Image Anal2005511429
- ComaniciuDINonparametric robust method for computer visionPhD thesisNew Brunswick, RutgersThe State University of New Jersey20001
- ComaniciuDMeerPMean shift: A robust approach toward feature space analysisIEEE Trans Patt Anal Mach Intell2002245602619
- FukunagaKHostetlerLDThe estimation of the gradient of a density functionIEEE Trans Info Theory1975213240
- ChengYMean shift, mode seeking, and clusteringIEEE Trans Patt Anal Mach Intell.1995178790729
- ZhangHFrittsJEGoldmanSAAn entropy-based objective evaluation method for image segmentationYeungMLienhartMRainerWStorage and Retrieval Methods and Applications for Multimedia2004Proceedings of The SPIE200353073849
- SalvatelliACaropresiJDelrieuxCIzaguirreMFCasoVCellular outline segmentation using fractal estimatorsJ Comp Sci Technol2007711422
- GrenierTRevol-MullerCDavignonFGimenezGHybrid approach for multiparametric mean shift filteringImage Processing2006IEEE International ConferenceOct 8–11Atlanta, Georgia
- ChristoudiasCMGeorgescuBMeerPSynergism in low level visionProceedings of 16th International Conference on Pattern RecognitionQuebec City, Canada2002 Aug4150155
- RodríguezRAlarcónTSánchezLMADIP: Morphometrical analysis by digital image processingProceedings of the IX Spanish Symposium on Pattern Recognition and Image Analysis20011291298
- RodríguezRPachecoOA strategy for atherosclerosis image segmentation by using robust markersJ Intell Robot Sys2007502121140