 ?Mathematical formulae have been encoded as MathML and are displayed in this HTML version using MathJax in order to improve their display. Uncheck the box to turn MathJax off. This feature requires Javascript. Click on a formula to zoom.
Abstract
Background
A prerequisite for a successful design and discovery of an antibacterial drug is the identification of essential targets as well as potent inhibitors that adversely affect the survival of bacteria. In order to understand how intracellular perturbations occur due to inhibition of essential metabolic pathways, we have built, through the use of ordinary differential equations, a mathematical model of 8 major Escherichia coli pathways.
Results
Individual in vitro enzyme kinetic parameters published in the literature were used to build the network of pathways in such a way that the flux distribution matched that reported from whole cells. Gene regulation at the transcription level as well as feedback regulation of enzyme activity was incorporated as reported in the literature. The unknown kinetic parameters were estimated by trial and error through simulations by observing network stability. Metabolites, whose biosynthetic pathways were not represented in this platform, were provided at a fixed concentration. Unutilized products were maintained at a fixed concentration by removing excess quantities from the platform. This approach enabled us to achieve steady state levels of all the metabolites in the cell. The output of various simulations correlated well with those previously published.
Conclusion
Such a virtual platform can be exploited for target identification through assessment of their vulnerability, desirable mode of target enzyme inhibition, and metabolite profiling to ascribe mechanism of action following a specific target inhibition. Vulnerability of targets in the biosynthetic pathway of coenzyme A was evaluated using this platform. In addition, we also report the utility of this platform in understanding the impact of a physiologically relevant carbon source, glucose versus acetate, on metabolite profiles of bacterial pathogens.
Background
One of the main problems faced by the current paradigm of drug discovery in the therapeutic area of infection is in identification of a valid drug target, followed by an understanding of the concentration dynamics of the metabolites in response to its inhibition. A valid target at the genetic level is the one that is essential for the survival of the pathogen. At the functional level, the target protein structure and/or its biological activity is substantially different from that of the host. However, not all targets with these criteria yield inhibitors that kill the pathogen specifically through the mechanism intended. This necessitates generating a large number of targets suitable for high throughput screening (HTS).Citation1 A recent review of anti-infective HTS by Payne et al indicated that the success rate is abysmally low even with a large number of HTS campaigns.Citation2 Hence there is an urgent need to strategize and modify guidelines that define an ideal anti-infective drug target.
Many potent inhibitors of essential enzymes have been reported to lack antibacterial activity.Citation3 In most cases, efflux or lack of permeability across the bacterial cell wall has been suspected to be a principal factor responsible for this phenomenon. This explanation has remained mainly unsubstantiated since it is difficult to determine the exact cause. However a quantitative relationship between enzyme inhibition and its effect on the growth of the pathogen has been delineated. Eisenthal and Cornish-Bowden have postulated two basic mechanisms by which the enzyme inhibition leads to the cessation of growth of an organism: “either the flux through an essential metabolic pathway can be decreased to a point where life is no longer possible or metabolite concentration can be increased to toxic levels”.Citation4 Recent evidence also indicates that independent of the target inhibited, bacterial cell death ultimately occurs through a generalized mechanism involving modulation of multiple pathways that leads to generation of free radicals.Citation5 Thus there is a need to interconnect inhibition of target enzyme in vitro and inside the cell. It is well known that inhibition or over expression of an enzyme in a metabolic pathway does not guarantee either a change in flux or a concomitant increase or decrease in the metabolite concentration. The activity of any enzyme inside the cell depends on its own substrate concentration and kinetic properties (eg, Km,Vmax) as well as those of other enzymes in that particular pathway. On the other hand, the degree of enzyme inhibition inside the cell is related to the mode of enzyme inhibition (MOI) as well as to the enzyme-inhibitor dissociation constant (Ki). Therefore, it is essential to consider a network of enzymes or pathways around a particular target enzyme so as to predict the effect of its inhibition on the overall cell metabolism. Since target gene knockouts mimic complete inhibition inside the cell, it may not be possible to achieve the same inhibition through compound-mediated inhibition. It is thus necessary to assess the effect of partial inhibition through regulated expression of a target gene.Citation6 Since this involves extensive experimentation, a better alternative is to predict cell vulnerability in response to a specific target enzyme inhibition through in silico simulations. Vulnerability is defined as the extent of inhibition of a target required to have a negative impact on growth leading to cell death.Citation7
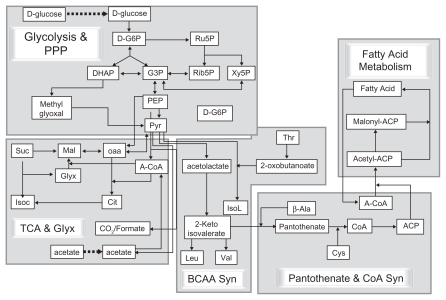
Towards this objective, we have built an in silico dynamic network of 8 major pathways in Escherichia coli, including glycolysis, pentose phosphate pathway, and tricarboxylic acid (TCA) cycle along with glyoxylate shunt, fatty acid metabolism, and biosyntheses of branched chain amino acids, pantothenic acid, and coenzyme A (CoA) (). These pathways were chosen based on their connection to central carbon metabolism and their potential for possessing drug targets, for example, isocitrate lyase or pantothenate kinase, in drug discovery against pathogens like Mycobacterium tuberculosis. Published data on enzyme kinetics, pathway flux distribution, operon structure, and gene regulation were used to build this platform. The pathway dynamics were simulated by interconnecting ordinary differential equations describing kinetic behavior of each enzyme in the pathway. Such a kinetic model is thus a computational and mathematical framework, built by using intracellular enzyme as well as metabolite concentration and other kinetic parameters. This platform is expected to elicit responses to perturbations in a fashion similar to the way the natural system in question would. This type of modeling has been referred to as an “impossible” problem, primarily because of the dearth of parametric data required to give meaning to flux equations, and, secondly, the absence of a software that can simulate and give stable solutions to systems comprising thousands of ordinary differential equations (ODEs). The proprietary Cellworks (Cellworks Group, Inc., Saratoga, CA, USA) technology, iC-PHYS™, can be used to create and simulate such a platform. Cell growth could be simulated by providing glucose or acetate as a carbon source (C-source) along with essential metabolites (metabolites not synthesized on this platform) such as beta-alanine, threonine, and cysteine. Altogether, 189 genes and 449 biochemical reactions covering 434 metabolites were modeled on this platform. The model was aligned (see Materials and Methods – Alignment of the platform) with data reported in the literature and “frozen” so that the subsequent validation studies did not require any alteration in the model parameters or equations. Validation studies were carried out using published data for E. coli. Various enzymes were evaluated as potential drug targets and those that were either vulnerable or relatively immune to inhibition of a specific type were identified and some experimentally verified. Since there is a significant overlap in the metabolic pathways among various bacteria, we tested the predictive capability of the in silico platform by correlating model predictions with experiments carried out on Mycobacterium bovis BCG as a surrogate for M. tuberculosis.
Figure 1 Schematic representation of pathways modeled on this platform. Each pathway is represented by central reactions or metabolites, truncated such for simplistic representation.
Pathway abbreviations: PPP, pentose phosphate pathway; Fatty Acid Metabolism, pathway of synthesis and breakdown of fatty acids; Pantothenate and CoA Syn, pathway of pantothenate and coenzyme A synthesis; BCAA synthesis, branched chain amino acid synthesis pathway; TCA and Glyx, pathways of tricarboxylic acid cycle and glyoxylate shunt; Methyglyoxal, methyglyoxal pathway.
Metabolite abbreviations: D-G6P, D-glucose-6-phosphate; Ru5P, ribulose-5-phosphate; Rib5P, ribose-5-phosphate; Xy5P, xylose-5-phosphate; G3P, glyceraldehyde-3-phosphate; DHAP, dihydroxyacetone phosphate; PEP, phosphoenolpyruvate; Pyr, pyruvate; A-CoA, acetyl-CoA; OAA, oxaloacetate; Mal, malate; Suc, succinate; Isoc, isocitrate; Glyx, glyoxylate; Cit, citrate; Thr, Threonine; IsoL, isoleucine; Leu, leucine; Val, valine; ACP, acyl carrier protein; CoA, coenzyme A; Cys, cysteine; β-Ala, beta-alanine.
Results
Glycolysis, TCA cycle, and glyoxylate shunt
From the glycolytic pathway, tpiA (triose phosphate isomerase) knockout was used for validation. This knockout showed normal cell growth due to activation of the methylglyoxal pathway and the flux distribution () indicated 18-fold higher flux of dihydroxyacetone phosphate (DHAP) to methylglyoxal. This was similar to the experimental values reported earlier.Citation8
Table 1 Comparison of predicted flux distribution values for tpiA gene knockout (KO) mutant with reported experimental values obtained using glucose as sole source of carbon
The ability of the platform to predict growth of E. coli on acetate as C-source was tested and the resulting flux data compared with the reported values.Citation9–Citation11 With equimolar quantities of acetate or glucose as sole source of carbon, it was found that the rate of biomass generation on acetate was 2.8-fold lower (), comparable to the experimental value of 2.18. As a retrospective study, fluxes for various reactions in glycolytic pathway and TCA cycle including glyoxylate shunt were corroborated with the published data after appropriate normalization (). The predicted flux through the pentose phosphate pathway on acetate as C-source was higher than reported values. This discrepancy could be due to activation of trehalose biosynthesis after the osmotic imbalance experienced by E. coli growing on acetate as C-source, thereby accounting for the excess flux through the pentose phosphate pathway.Citation12–Citation14
Figure 2 Growth profile of an E. coli cell on glucose and acetate as carbon source. E. coli cell growth was modeled after providing equimolar quantities of glucose or acetate as the sole source of carbon. Rate of cell growth was found to be 2.8-fold higher on glucose than on acetate.
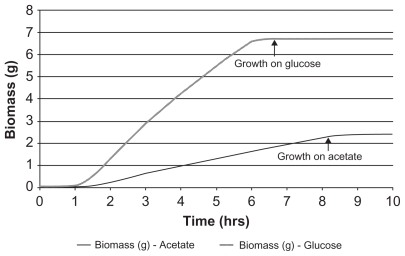
Table 2 Comparison of flux distribution values, normalized with respect to predicted uptake of acetate (16.9 μmoles/sec), obtained using acetate as sole source of carbon
The glyoxylate shunt consists of 2 enzymes, isocitrate lyase (AceA) and malate synthase (AceB). Strains like E. coli MG1665 have two isozymes (AceB and GlcB for malate synthase), while E. coli O:157 Sakai strain has only one of these. Here, we have considered only one malate synthase isozyme, which is AceB. Reported Km values for isocitrate are 604 and 12 μM for isocitrate lyase and isocitrate dehydrogenase (Icd), respectively. On glucose as C-source, most of the carbon flux is reported to go through Icd due to its higher affinity for isocitrate and its low intracellular concentration (30 μM). When acetate is used as C-source, aceBAK operon is switched on which in turn leads to inactivation of Icd by AceK through phosphorylation, resulting in an increased flux of isocitrate through glyoxylate shunt.Citation11 Therefore, virtual knockouts of aceA and aceB were tested on the platform for the effects on the flux of isocitrate through the TCA cycle and glyoxylate shunt using acetate or glucose as C-source. It was observed that the flux from isocitrate to alpha-ketoglutarate was 2-fold higher on glucose whereas the flux through glyoxylate shunt was 10-fold higher on acetate. The relative flux distribution on acetate versus glucose was similar to that reported in the literature ().Citation10 As expected, the rate of biomass generation declined when the C-source was changed from glucose to acetate for wild type and complete inhibition of growth was observed in both the knockouts ().
Figure 3 Essentiality of the glyoxylate shunt during growth on acetate as carbon source. Growth profile of E. coli after aceA A) and aceB B) gene knockout (KO): Initially, wild type (WT) E. coli cell growth was modeled on glucose followed by acetate. In the second phase, growth of gene knockout mutant of E. coli was modeled under similar conditions. Growth profile under each condition was modeled for 12,000 seconds. Although both aceA and aceB knockout mutants showed a similar growth rate on glucose as that of wild type, they did not grow on acetate.
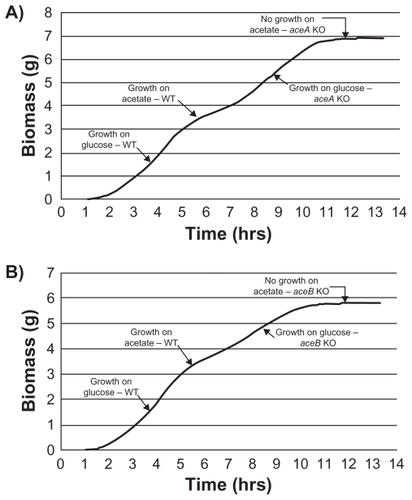
Table 3 Predicted changes in tricarboxylic acid (TCA) cycle and glyoxylate shunt fluxes upon change in sole source of carbon from glucose to acetate were compared with the reported valuesCitation9
Fatty acid biosynthetic pathway
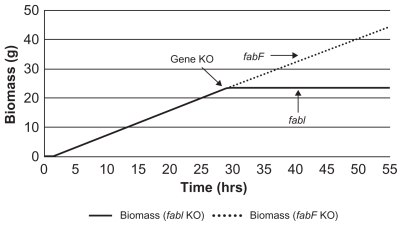
In this pathway, genes fabI, fabD, fabG, fabA, fabZ, and fabB are reported to be essential for cell growth.Citation15 The experimental knockout of fabF resulted in insignificant reduction in growth rate whereas fabI knockout did not grow at all. FabI is responsible for the conversion of trans-2-enoyl-acyl carrier protein (ACP) to a 2,3,4-saturated-ACP wherein both NADH and NADPH can be the reducing agents for the reaction. A knockout of fabI results in growth inhibition since no other enzyme exists to catalyze this particular reaction. The fabF gene is involved in the formation of the beta-ketoacyl ACP form in the initiation as well as the elongation steps in saturated fatty acid biosynthesis. The knockout of fabF results in the flux diversion into other reactions carried out by FabB. Flux distribution in wild type and fabF knockouts can be seen in Tables S4 and S5. This experimental observation could be simulated in this model using the respective virtual gene knockouts at a constant glucose source concentration of 670 μM. Knockouts were performed after permitting initial growth. The fabI knockout did not show growth whereas fabF knockout exhibited normal growth () as expected.
Figure 4 Essentiality of genes involved in fatty acid biosynthesis. Growth profile of E. coli after fabF and fabI gene knockout (KO). E. coli did not grow when fabI gene was knocked out whereas fabF gene knockout did not affect cell growth.
CoA biosynthetic pathway
Steady state levels of the total CoA pool as well as CoA and acetyl CoA, using glucose and acetate as the sole C-source generated using this platform (Table S2), were in close agreement with the experimental values reported in the literature. Citation16 Multiple scenarios such as effects of overexpression of coaA, reduction in levels of CoA, and effect of pantothenate analogs on cell growth were simulated in this platform. The moderate (2- to 3-fold) increase in CoA levels following overexpression of coaA, inhibition of cell growth observed only after 95% reduction in CoA levels, and growth inhibition exerted by N5-pantothenate analogs through depletion of normal CoA levels (data not shown) were similar to the experimental observations reported in literature.Citation17,Citation18
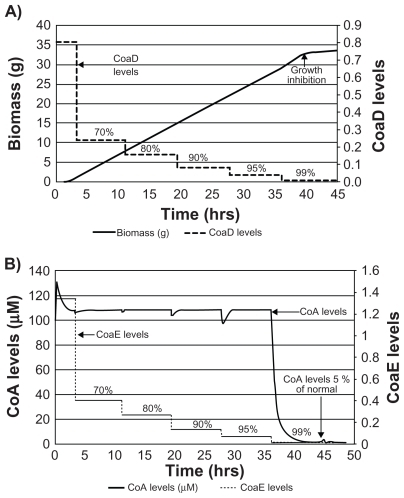
The vulnerability of three major targets in this pathway, CoaA, CoaD, and CoaE, was assessed by predicting the minimum level of target enzyme inhibition required for the cessation of cell growth. Activity was modulated using gene knockdown as well as through various MOI. A gradual reduction in CoA levels was observed following stepwise knockdown of coaA (). On the other hand, a steep decline was observed only after 99% of coaE was knocked down (). As a result, growth inhibition was observed only after 99% knockdown of coaA or coaD ( and ). A similar growth pattern was observed for coaE knockdown (data not shown). A reduction in CoA levels following knockdown of CoaD/E activity could, in turn, alleviate the feedback inhibition on CoaA activity, thereby compensating for the overall flux until 99% activity of CoaD/E is affected. In addition, the flux of the CoA pathway was solely dependent on CoaA levels (data not shown). Both these observations indicated that the CoaA-catalyzed reaction was the rate-limiting step in this pathway. In spite of being described as a rate-limiting enzyme, more than 95% reduction in CoaA activity was required for growth inhibition, as the steady state levels of CoA were in large excess (20-fold) of what is critical for cell survival.
Figure 5 Reduction in coenzyme A levels (CoA) and observed growth inhibition with graded knockdown of coaA. Growth profile of E. coli after coaA gene knockout. Percentage values indicate percentage knockdown. Sequential knockdown of coaA gene product resulted in growth inhibition only after 99% knockdown (A). CoA levels decreased in proportion to percentage knockdown in coaA gene product (B). Growth inhibition was observed after CoA levels were reduced by >95%.
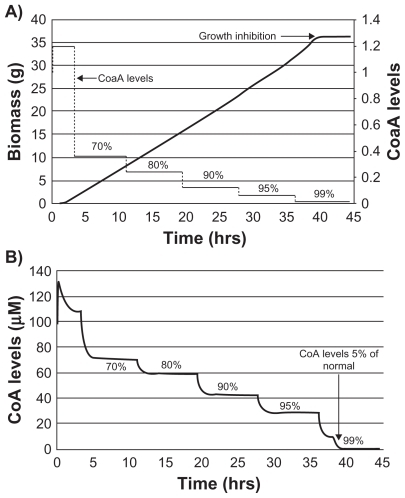
Figure 6 Reduction in CoA levels and growth inhibition with sequential knock down of coaD and coaE. Values in percentage indicate percentage knockdown. A steep reduction in CoA levels was observed only after 99% knockdown of coaD (A). Similarly, inhibition of growth was observed only after 99% knockdown of coaE gene product (B).
Enzyme inhibitors obtained during high throughput screening against an enzyme target could be competitive or uncompetitive or noncompetitive with its substrate. After predicting the extent of target enzyme inhibition required for growth inhibition, various modes of CoaA inhibition were simulated with the aim of ranking them in terms of [I]/ Ki required for growth inhibition. The following equations were used to model an external inhibitor:
Competitive inhibition where the Km for ATP (adenosine tri-phosphate) increases –
Uncompetitive inhibition where the Km for ATP as well as the Vmax decrease –
Since Kie >>> Kies in the case of uncompetitive inhibitors, I/Kie in the numerator tends to zero. Therefore the net effect of I/Kies is a decrease in KmATP in the presence of an uncompetitive inhibitor. For pure noncompetitive inhibition, the Km for ATP remains the same while the Vmax decreases. On the other hand, mixed noncompetitive inhibition entails an increase in the Km for ATP and a decrease in the value for Vmax.
The inhibitor was assumed to bind free enzyme wherein feedback inhibitors such as CoA or acetyl CoA could displace it. Predicted values of flux indicated that a mixed or pure noncompetitive inhibitor would require a 20-fold lower [I]/Ki ratio than the competitive inhibitor (). This result is in accordance with the Cheng-Prusoff relationship between enzyme IC50 and Ki values. Such predictions could be valuable in optimizing CoaA inhibitors to achieve potent antibacterial activity. Growth inhibition in the presence of a mixed noncompetitive inhibitor was preceded by a steady decline in CoA levels and simultaneous accumulation of pantothenate. The time delay observed for growth inhibition corresponded to the time required for CoA levels to drop below a critical level of 5%. This could in turn imply that the cells might require an exposure to CoaA inhibitors for more than five generations for an effective growth inhibition.
Figure 7 Various modes of inhibition of pantothenate kinase and resultant flux through the pathway. Effect of [I]/Ki ratio on the flux of CoA biosynthetic pathway. Preferred mode of inhibition is the one that affects pathway flux at a lesser ratio of [I]/Ki. Predicted [I]/Ki ratio required to reduce the CoA pathway flux below a critical value of ~0.07 umol/sec indicated as Minimum Inhibitory Concentration (MIC) was 1000, 400, 30, and 50 for competitive, uncompetitive, mixed, and pure noncompetitive modes of inhibition respectively.
![Figure 7 Various modes of inhibition of pantothenate kinase and resultant flux through the pathway. Effect of [I]/Ki ratio on the flux of CoA biosynthetic pathway. Preferred mode of inhibition is the one that affects pathway flux at a lesser ratio of [I]/Ki. Predicted [I]/Ki ratio required to reduce the CoA pathway flux below a critical value of ~0.07 umol/sec indicated as Minimum Inhibitory Concentration (MIC) was 1000, 400, 30, and 50 for competitive, uncompetitive, mixed, and pure noncompetitive modes of inhibition respectively.](/cms/asset/3d342ac0-77fe-417f-82f3-59f50c992934/daab_a_14368_f0007_b.jpg)
Pantothenate biosynthetic pathway and its influence on CoaA activity
Valine and L-aspartate are the precursors for pantothenate synthesis in bacteria wherein the gene product of panC catalyzes the conversion of beta-alanine to pantothenate. The panCD knockout strain of M. bovis BCG was reported to grow in vitro with pantothenate supplementation and its growth rate was proportional to a pantothenate concentration of up to 10 μg/mL or 42 uM.Citation19 Similarly, a virtual phenotype for panC knockout mutant could be demonstrated in this model wherein both steady state CoA levels and growth rate were proportional to a pantothenate concentration of up to 1 μM (). The lower concentration of pantothenate required to sustain normal growth on this platform could be due to the fact that 1 μM is simulated under intracellular milieu whereas 42 μM is present in the experimental growth medium.
Figure 8 Growth profile and CoA levels in case of panC knockout (KO) with pantothenate supplementation and effect of coaA knockdown under these conditions. Effect of pantothenate supplementation (0.5, 1, 2, 4, 8 uM) on growth profile of panC knockout mutant of E. coli (A), CoA levels (B), and on growth profile of double mutant with panC knockout and coaA knockdown (percentage values indicate percentage knockdown.) (C). panC knockout results in pantothenate auxotrophy where normal growth was restored at 1 μM pantothenate (A). Steady state CoA levels in panC knockout mutant increased in proportion to the amount of pantothenate supplied (B). In a wild type strain, growth inhibition was observed only after 99% knockdown of coaA whereas in the case of panC knockout grown in the presence of 1 uM pantothenate, 70% knockdown of coaA was sufficient to cause growth inhibition (C).
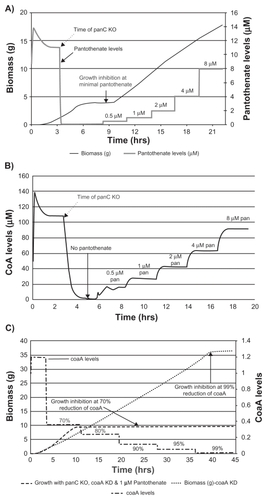
Since poor growth of panC knockout under suboptimal pantothenate levels (<1 μM) was due to limiting levels of CoA, we wanted to test if the cell becomes more vulnerable to CoaA inhibition under this condition. As predicted, the extent of enzyme inhibition required for growth arrest declined from 99% under normal conditions for a wild type strain to 70% for panC knockout (). It can be postulated that due to increased susceptibility to CoaA inhibition, the pantothenate auxotroph could be used for screening CoaA enzyme inhibitors for their antibacterial activity.
Branched chain amino acid biosynthesis
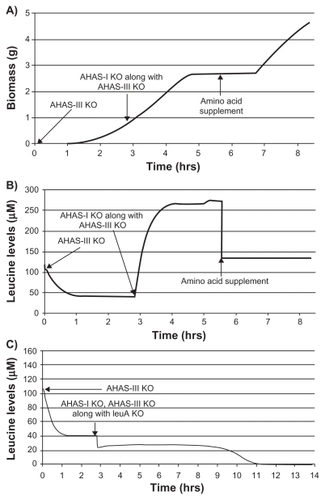
The acetohydroxyacid synthase (AHAS) class of enzymes catalyzes the first reaction in the biosynthetic pathway of branched chain amino acids leucine, isoleucine, and valine. AHAS I and III isozymes catalyze conversion of 2 pyruvate molecules into alpha-acetolactate for valine and leucine biosynthesis and 2 alpha-ketobutarate molecules into alpha-acetohydroxybutyrate for isoleucine biosynthesis. Either AHAS I or AHAS III can support growth of E. coli in minimal media containing glucose as C-source whereas AHAS I alone has been shown to be essential when acetate is used as the sole source of carbon.Citation20 On this platform, an auxotrophic phenotype was observed for the double knockout of AHAS I and III on glucose as well as acetate as C-source, wherein supplementation of all three amino acids could relieve growth inhibition (). Though the levels of isoleucine and valine started declining immediately after knockout, leucine was found to accumulate for a short period of time (). This was due to higher flux of 2-oxoisovalerate to 2-isopropylmalate through LeuA at the branchpoint of pathway for valine biosynthesis. This was confirmed by simultaneous knockout of leuA along with AHAS I and III where leucine accumulation was not observed ().
Figure 9 Effect of AHAS I, AHAS III knockout (KO) on growth and amino acid levels. Growth profile (A) of AHAS III knockout followed by AHAS I and III double knockout with and without isoleucine 30 μM, leucine 135 μM, and valine 200 μM (ILV) supplementation. Auxotrophic growth inhibition observed in the case of AHAS I and III double knockout mutant could be reversed in the presence of ILV supplementation. Leucine accumulation was observed in the case of AHAS I/III double knockout (B) whereas it was absent when leuA was knocked out in addition to AHAS I and III (C).
To evaluate the utility of this platform in other bacterial species like mycobacteria, the effect of a known AHAS inhibitor, flazasulfuron, on intracellular levels of leucine, isoleucine, and valine in M. bovis BCG, a surrogate for M. tuberculosis, was experimentally validated. Following exposure to flazasulfuron, there was a reduction in the levels of leucine, isoleucine, and valine compared with untreated control (). This observation thus confirmed and experimentally validated the predictions of the platform.
Table 4 Experimental validation of acetolactate synthase – inhibition
Discussion
Apart from the basic understanding of how the “tide and ebb” of metabolite flow is related to growth and death of bacteria, one of the major thrusts for carrying out dynamic modeling is to identify vulnerable drug targets. Though genome scale metabolic reconstruction has been attempted in silico for various organisms and more extensively so for E. coli,Citation21,Citation22 it is difficult to incorporate enzyme kinetic parameters into these networks as many of these values are not known and the computational stability of such an operation is yet to be evaluated. On the other hand, individual pathways like the TCA cycle and the glyoxylate shunt have been simulated using in vitro kinetic parameters and used to derive valid correlation between target inhibition and intracellular metabolite concentration.Citation23 We have attempted simulating a network of eight major pathways including the central carbon metabolism so that the effect of C-source on target vulnerability could be assessed.
Vulnerability can vary a lot depending upon the extent of cellular damage caused by the inhibition of a particular target. For example, only partial inhibition of DNA gyrase activity by fluoroquinolones results in cell death through induction of reactive oxygen species.Citation5,Citation24 In contrast, even 97% inhibition of the essential enzyme encoded by pyrG does not inhibit growth in Lactoccus lactis.Citation25 In order to evaluate the vulnerability of a target, one would have to gradually reduce the level of target gene expression and simultaneously monitor the concomitant effect on bacterial growth. The method described here is well suited to predict and generate this critical information. Enzymes in the CoA biosynthetic pathway were evaluated for vulnerability using this platform. Predicted requirement of >95% enzyme inhibition sustained over 4 to 5 generations may pose a challenge in translating enzyme IC50s against CoaA, CoaD, and CoaE enzymes into MICs, especially against slow-growing bacteria like M. tuberculosis.
As the extent of inhibition depends on the nature of inhibition (competitive, uncompetitive, mixed), the current technology can also be exploited to choose the most effective class of inhibitors and, to a certain extent, reduce the chances of failure in translating nanomolar enzyme potencies into MICs. It has long been understood that some competitive inhibitors fail to inhibit the target enzyme within the cellular mileu due to substrate build up – a phenomenon described as metabolic resistance.Citation26 The present technology would be able to depict such events, a valuable addition that would aid medicinal chemists in designing good inhibitors. In this platform, preference for the mixed mode of CoaA inhibition to achieve MICs at a lower inhibitor concentration was clearly predicted.
The central carbon metabolism and most of the auxiliary pathways that feed in and out of the system are generally conserved across the bacterial kingdom. However the differences that arise are in the values of kinetic parameters or in the number of orthologs coding for the same enzyme across species. Thus to migrate from one organism to another we need to do a correction of the kinetic parameters and align the system with its specific isoforms. If the major isoform is conserved across bacterial species, this E. coli platform could even be applied to those as distant as M. tuberculosis. Cross-species applicability of this E. coli platform was tested by comparing predictions made on pathways like branched chain amino acid/pantothenate/CoA biosynthesis with the experimental data generated using a mycobacterial species. Genes coding for 3 isoforms of AHAS (I, II and III) have been reported in E. coli. The ilvB1 gene codes for the major AHAS I activity whereas ilvG coding for AHAS II is not expressed in E. coli K-12. On the other hand, the M. tuberculosis genome contains 4 genes (ilvB1, B2, G and X) coding for large catalytic subunit of AHAS, whereas only 1 gene (ilvN or ilvH) codes for the smaller regulatory subunit of AHAS I. Predicted depletion of leucine, isoleucine, and valine following the virtual knockout of AHAS I was experimentally proven in M. bovis BCG using flazasulfuron, a known inhibitor of AHAS enzyme. Similarly, simulations done with the panC knockout aligned well with the experimental data reported for M. bovis BCG. The results indicated that a hybrid platform could give a satisfactory prediction where the major kinetic parameters were retained from E. coli and only minor differences in isoforms were incorporated from mycobacteria.
Conclusions
A network of 8 major metabolic pathways in E. coli was successfully modeled and used for assessing target vulnerability, desirable biochemical mode of enzyme inhibition to get antibacterial activity, and to predict metabolite profiles upon target inhibition as a marker for studying the mode of action. Assessment of vulnerability and desirable mode of enzyme inhibition was illustrated using CoA biosynthetic pathway whereas change in branched chain amino acid levels illustrated its application in finding suitable metabolite markers following target inhibition. The emphasis behind this approach has been to address target “equity” beyond “essentiality”, a parameter long considered critical for its inclusion as an optimal candidate for designing drugs. The added feature that makes this simulation platform unique is its flexibility to incorporate different kinetic parameters or metabolite concentrations likely to be present either due to presence of alternative isoforms in different microorganisms, varied physiological environments, or changes in the intracellular milieu following treatment with various types of inhibitors. Our current pursuit is to build a kinetic in silico platform for M. tuberculosis that will include pathways unique to this pathogen especially those involved in cell wall biosynthesis. In addition, simulations to identify vulnerable targets in other druggable pathways in M. tuberculosis including energy metabolism, replication, transcription, and translation will also be run. This will lead to the construction of an integrated network of all pathways with the annotated essential genes from mycobacteria in this platform. Another advantage offered by this hybrid platform is its utilization to predict across unrelated bacteria the consequences of inhibition by various agents, provided they share and retain closely related target enzyme isoforms. In such cases, the simulation can be directly extrapolated and this was shown, albeit qualitatively, when the predicted modulation of levels of branched chain amino acids in flazasulfuron-exposed E. coli could be verified experimentally and their actual levels confirmed in the M. tuberculosis surrogate, M. bovis BCG. Studies reported here have also demonstrated the feasibility of measuring the vulnerability of a few genes in E. coli. A follow-up re-evaluation of the same targets in mycobacteria by simulating a stepwise gradient of knockdown analysis will be an interesting study to pursue. Since mycobacterium switches its carbon utilization from C6 to C2 C-source while transiting from extracellular to intracellular mode of survival, a major highlight of this model would be its capability to simulate this biological plasticity. The creation of a kinetic model of the size and complexity described here is a new advancement in the field of systems biology. We invite questions, which can be verified by experimental observations thereby shifting this conceptually “impossible” problem into the realm of experimental possibility. In short, this will be a visualization tool that will predict target vulnerability and its impact on cellular viability, consequent on blockage of important pathways either through genetic or chemical means tested under varied conditions.
Materials and methods
Model construction
Eight pathways in E. coli including glycolysis, pentose phosphate shunt, TCA cycle, fatty-acid metabolism, branched-chain amino acid synthesis, and CoA synthesis were modeled on this platform (). These pathways were integrated with each other and the end products were assimilated into macromolecules such as DNA, RNA, proteins, and lipids, as per the known stoichiometry.Citation27 E. coli growth, represented as a combined mass of macromolecules mentioned above, was simulated on glucose (C6) or acetate (C2) as C-source under aerobic growth conditions. A typical simulation starts with zero biomass and an increase in the same is indicative of cell growth. Gene regulation through various metabolites and regulatory proteins as per the C-source was included but the mechanism of regulation of over expression of regulatory proteins was not considered. The static map representation for each pathway and the operon information was adopted from the published literature.Citation28 This platform was built as a dynamic model with each reaction represented by an ordinary differential equation so that it could predict the quantitative effects of perturbation in any pathway on all the reactions included on this platform. The key aspects of this model are qualitatively described in this section, with important equations and mechanisms tabulated in Table S3.
Central carbon metabolism was modeled using glycolysis coupled to TCA cycle along with the glyoxylate shunt to accommodate acetate as an alternative C-source. Important regulatory mechanisms such as regulation of enzyme activity of phosphofructokinase (Pf kA, Pf kB) by ATP, regulation of isocitrate lyase (aceA) gene expression and enzymatic activity by pyruvate, glyoxylate, and succinate were taken into account. Pentose phosphate pathway and the Entner–Duodoroff pathway were modeled for generating pentose sugars as nucleic acid precursors and glycolytic intermediates, respectively. Metabolites such as ribose 5-phosphate and pyruvate were used for the biosynthesis of nucleotides and peptidoglycan/ protein respectively. Fatty acid metabolism was modeled to supply C14, C16, and C18 derivatives for the synthesis of membrane lipids. Feedback inhibition of acetyl-CoA carboxylases (AccABCD) and beta-ketoacyl-ACP synthase (FabH) through fatty-acyl-ACPs was built into the regulation of fatty acid synthesis.Citation29,Citation30 Synthesis of branched chain amino acids (BCAA) such as leucine, isoleucine, and valine was regulated by stringent feedback inhibition and using different isoforms.Citation31 Out of 3 isoforms of acetohydroxybutanoate synthase (AHAS I, AHAS II, AHAS III), AHAS II flux was not considered as it was reported to be nonfunctional in E. coli.Citation32 CoA biosynthesis was linked to BCAA synthesis through 2-ketoisovalerate which was used as a precursor of pantothenate. Pantothenate was converted to CoA through a series of 4 reactions catalyzed by gene products of coaA, coaB/C, coaD, and coaE. CoA was utilized as a major cofactor, an acyl group donor during protein and fatty acid biosynthesis. In addition, feedback regulation of CoaA and CoaD by CoA was incorporated. Considering the limits of this platform, some of the precursors, which were not synthesized on this platform, were supplied externally at the required stoichiometry. Metabolites produced in this model as well those supplied externally were incorporated into macromolecules required for the cell growth and the excess products were removed to avoid their undesirable effects on the modeled enzyme activities.
Model assumptions
Beyer et al in their studies on yeast, reported strong correlation between mRNA and protein levels in modules such as “energy”, “metabolism”, hinting at the possibility of strongly synchronized regulation of expression within functionally homogenous modules.Citation33 Similarly, correlation between overall mRNA and protein abundance in E. coli using codon adaptation index as a measure of gene expressivity was reported earlier.Citation34 Therefore relative enzyme concentrations on this platform were normalized using mRNA profiles reported under various growth conditions of E. coli. The platform was built to model growth of E. coli using glucose or acetate as C-source. Nitrogen source, oxygen, and other nutrients such as metal ions were externally provided in abundance. In reactions where one of the substrates was not produced on the platform, for example, β-alanine in the reaction catalyzed by pantoate β-alanine ligase, it was provided externally at the concentration reported.Citation35 Generation of ATP using proton motive force was not considered but the generation of ATP through reducing equivalents was incorporated. Total concentration of ATP, ADP (adenosine diphosphate), and AMP (adenosine monophosphate) pool was kept constant by incorporating interconversion of these forms through adenylate kinase-catalyzed reaction. The stoichiometry of ATP produced during electron transport through NDH-1, NDH-2, and cytochrome ‘bo’ was incorporated assuming a constant high energetic efficiency.Citation36 While interpreting flux distribution under various test conditions, the relative values of flux or metabolite concentration were compared with reported values. As data for in vitro enzyme assays may not always correlate with in vivo conditions, the simulation time had no relation to the actual time required for cell growth.
Model alignment and validation
The Cellworks proprietary technology, iC-PHYS™, has the ability to solve systems comprising an unlimited number of simultaneous ODEs.Citation37 It has been tested for systems of about 4000 ODEs. The integrity of the iC-PHYS™ was corroborated by comparing its performance with analytical solutions obtained at various time points in a concentration decay experiment. Further, comparison was carried out between the performance of iC-PHYS™ and Cell Designer 4.0.1Citation38,Citation39 for time-dependent change in the concentration of 2 species within the MAPK system,Citation40 an oscillatory signaling cascade. The correlation observed between iC-PHYS™ and Cell Designer 4.0.1 was found to be 0.98.
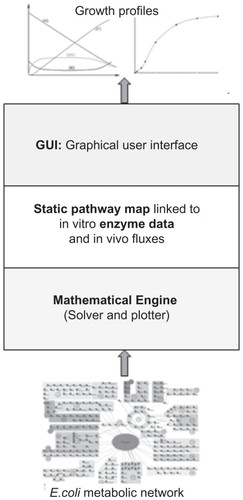
The iC-PHYS™ engine represents a reaction in a given pathway as a kinetic equation capturing the mechanistic data of an enzyme. Further inputs are in the form of kinetic parameters after which concentration of modeled species and other variables are linked through appropriate ODEs. Thus, iC-PHYS™ consists of a 3-tier architecture (), a computational back plane at the foundation level which solves these differential equations, and outputs data in the form of reports and plots whereas the middle layer comprises a static pathway map linked to in vitro enzymatic data and in vivo fluxes. With these 2 layers together forming a background platform, the user interface has a viewer layer where the growth profiles as a result of simulation can be visualized and analyzed. Change of the fluxes, and metabolite and enzyme concentration with time can also be monitored.
Figure 10 Schematic representation of the iC-PHYS™ engine with a 3-tier structure. The mathematical engine, comprising the solver and the plotter, forms the foundation of iC-PHYS™. The interconnected E. coli map with relevant kinetic parameters and equations forms the secondary layer, while the graphical user interface (GUI) forms the uppermost layer. The user manipulates and generates data by using the GUI.
Creation of the platform started with the computational representation of a static map of the pathway to be modeled. In instances of inconsistent or unknown enzyme kinetic parameters, a trial and error method of optimization was followed to attain physiological enzyme behavior. The kinetic parameters (eg, rate constants [Kf or Kr], Km, Vmax [Vf]), concentrations of the substrates and products, reaction equation showing the stoichiometry of substrates and products participating in the specific biochemical reaction, flux equation or kinetic equation for the individual reaction, and compartment (cytosol or membrane or pseudo) where the reaction takes place are provided in the supplementary PDF document (Model equations and parameters). All the 448 reactions used in this platform are described in this document. After alignment, the kinetics of the reaction were frozen and validated against various experimental results in literature. All pathway modules were thus aligned for physiological effects and then validated against published information and/or live experimental data. A thorough qualification of standalone models with respect to biological accuracy ensured physiological behavior when assessed as closed systems. Individual pathway modules were then integrated wherein kinetic parameters were aligned wherever necessary by following the optimization method described above. Thus the complete platform was aligned with training data sets in the form of experimental results reported in the literature so as to ensure reliability in predicted values. The rate of glucose utilization and the flux distribution on the platform were aligned to the experimentally reported values.Citation34,Citation41 The comparison of relative flux distribution in E. coli grown in a continuous culture mode with that simulated on the platform is given in Table S1.
The enzyme levels on the platform were aligned to the microarray profiles generated using E. coli MG1655 grown on a glucose-containing minimal medium.Citation42 The microarray data were extracted from the NCBI GEO database and normalized against the gene panE that was expressed at similar levels on glucose as well as acetate as a C-source. This method was adopted to reduce the intensities to a smaller magnitude, thereby reducing the ODE solver complexities associated with numbers of large magnitude.
Generic simulation procedure
All the simulations in this E. coli platform were done using the iC-PHYS™ graphical user interface (GUI). The iC-PHYS™ GUI grants the user the option to set the maximum biological time of the simulation, specify the C-source, and the mode (continuous or batch supply of C-source) for a particular experiment. Different virtual experiments could be conducted on this platform. For example, aceA knockout was tested for its effect on fluxes in the TCA cycle and the glyoxylate shunt. The simulation was carried out for a total time of 48,000 seconds under 4 different conditions of 12,000 seconds each. The first 2 conditions were set up to simulate the growth of wild type E. coli using a continuous supply of glucose (670 μM) followed by acetate (2010 μM). The next 2 conditions were set up to simulate the growth of aceA knockout mutant under similar growth conditions to that of wild type. Similarly, the effect of a specific percentage knockdown or overexpression of a particular enzyme or enzymes on the growth of E. coli cell was simulated. For example, coaA, coaD, and coaE were knocked down by different percentages to assess the vulnerability of cell growth to inhibition of these targets. Concentration of a desired metabolite could be altered to study the effect of that metabolite on cell growth. For example, the auxotrophy phenotype for the AHAS I/III knockout was tested by supplementing leucine, isoleucine, and valine at fixed concentrations. In such simulations, the concentration of a metabolite generated by the platform under knockout or knockdown conditions was changed to a fixed value in the second stage of supplementation. This procedure could also be employed to check the effect of variation in enzyme kinetic parameters in the presence of external inhibitors. For example, effect of CoaA inhibitors with different [I]/Ki ratio and various MOI was simulated to examine their effect on cell growth.
Experimental validation of predictions made using this platform
Intracellular levels of branched chain amino acids were estimated after subjecting whole cells of M. bovis BCG to a suitable extraction procedureCitation43 followed by detection and analysis by HPLC. Flazasulfuron, a reported AHAS inhibitorCitation44 with an MIC of 2 μg/mL against M. bovis BCG, was tested for its effect on intracellular levels of isoleucine, leucine, and valine. M. bovis BCG was grown in roller bottles in Middle Brook 7H9 (0.05% Tween and ADC) at 37°C until OD600 reached 0.5. The bacterial cells were exposed to the inhibitor and re-incubated at 37°C for 4 hours. The treated cultures were harvested and washed with phosphate buffered saline. The cell pellets were resuspended in chilled 0.6 M perchloric acid, vigorously mixed, and left on ice for 30 minutes. These acid extracts were neutralized using 0.6 M KOH, recentrifuged, and the supernatant vacuum was dried and then reconstituted in water for derivatizationCitation45 prior to HPLC analysis. These extracts were resuspended in derivatization buffer containing 50 μL of PITC (phenylisothiocyanate), 350 μL ethanol, 50 μL triethylamine, and 50 μL water, incubated for 30 minutes at 25°C, and dried in vacuum again. All samples were resuspended in buffer A (140 mM sodium acetate containing 0.5 mL triethylamine/L, pH adjusted to 6.35 with acetic acid) containing 10% acetonitrile prior to injection into HPLC column (C18 LUNA). Gradient used was buffer A to B (60% acetonitrile): 10% to 53% B in 24 minutes, 53% to 100% B in 5 minutes, 100% to 10% B in 5 minutes, and the finally back to 10% B in 5 minutes at a flow rate of 1 mL/min. Derivatized amino acids were monitored for absorbance at 254 nm.
Authors’ contribution
Aditya Barve, Ansu Kumar and Shireen Vali designed, constructed and validated the E. coli computational platform at the Cellworks site. Various simulations carried out by Aditya Barve and Ansu Kumar at Cellworks were reconfirmed by Anvita Gupta and Suresh Solapure at AstraZeneca India. The design and formulation for simulation were carried out by Suresh Solapure, Vasanthi Ramachandran, Kothandaraman Seshadri and Santanu Datta. The experimental validations were carried out by Suresh Solapure and Vasanthi Ramachandran. After contributions from all the contributors, the manuscript was written by Aditya Barve, Suresh Solapure, Vasanthi Ramachandran, Kothandaraman Seshadri and Santanu Datta. All the authors read and approved the final manuscript.
Acknowledgment
We are indebted to Anand Kumar and Umender Sharma for critically reviewing the manuscript. The authors would like to thank Asha Balakrishnan for carrying out the amino acid analysis and Tanmay Banerjee for the microarray data input into the platform.
Disclosure
The authors disclose no conflicts of interest for this work.
References
- ChanPFHolmesDJPayneDJFinding the gems using genomic discovery: antibacterial drug discovery strategies – the successes and the challengesDrug Discov Today Ther Strateg200414519527
- PayneDJGwynnMNHolmesDJPomplianoDLDrugs for bad bugs: confronting the challenges of antibacterial discoveryNat Rev Drug Discov200761294017159923
- BlackMTBrutonGInhibitors of bacterial signal peptidasesCurr Pharm Des19984213315410197037
- EisenthalRCornish-BowdenAProspects for antiparasitic drugs. The case of Trypanosoma brucei, the causative agent of African sleeping sicknessJ Biol Chem199827310550055059488673
- KohanskiMADwyerDJHayeteBLawrenceCACollinsJJA common mechanism of cellular death induced by bactericidal antibioticsCell2007130579781017803904
- KaurPAgarwalSDattaSDelineating bacteriostatic and bactericidal targets in mycobacteria using IPTG inducible antisense expressionPLoS One200946e592319526063
- DattaSUnderstanding the characteristics of a good anti-infective drug targetJ Parasitic Dis199923139140
- FongSSNanchenAPalssonBOSauerULatent pathway activation and increased pathway capacity enable Escherichia coli adaptation to loss of key metabolic enzymesJ Biol Chem2006281128024803316319065
- WalshKKoshlandDEJrBranch point control by the phosphorylation state of isocitrate dehydrogenase. A quantitative examination of fluxes during a regulatory transitionJ Biol Chem198526014843084372861202
- WalshKKoshlandDEJrDetermination of flux through the branch point of two metabolic cycles. The tricarboxylic acid cycle and the glyoxylate shuntJ Biol Chem198425915964696546378912
- HolmsHFlux analysis and control of the central metabolic pathways in Escherichia coliFEMS Microbiol Rev1996192851168988566
- WendischVFde GraafAASahmHEikmannsBJQuantitative determination of metabolic fluxes during coutilization of two carbon sources: comparative analyses with Corynebacterium glutamicum during growth on acetate and/or glucoseJ Bacteriol2000182113088309610809686
- TweeddaleHNotley-McRobbLFerenciTEffect of slow growth on metabolism of Escherichia coli, as revealed by global metabolite pool (“metabolome”) analysisJ Bacteriol199818019510951169748443
- PurvisJEYomanoLPIngramLOEnhanced trehalose production improves growth of Escherichia coli under osmotic stressAppl Environ Microbiol20057173761376916000787
- BabaTAraTHasegawaMConstruction of Escherichia coli K-12 in-frame, single-gene knockout mutants: the Keio collectionMol Syst Biol2006220062008
- ChohnanSIzawaHNishiharaHTakamuraYChanges in size of intracellular pools of coenzyme A and its thioesters in Escherichia coli K-12 cells to various carbon sources and stressesBiosci Biotechnol Biochem1998626112211289692193
- SongWJJackowskiSCloning, sequencing, and expression of the pantothenate kinase (coaA) gene of Escherichia coliJ Bacteriol199217420641164171328157
- ZhangYMFrankMWVirgaKGAcyl carrier protein is a cellular target for the antibacterial action of the pantothenamide class of pantothenate antimetabolitesJ Biol Chem200427949509695097515459190
- TulliusMVHarthGMaslesa-GalicSDillonBJHorwitzMAA Replication-Limited Recombinant Mycobacterium bovis BCG vaccine against tuberculosis designed for human immunodeficiency virus-positive persons is safer and more efficacious than BCGInfect Immun200876115200521418725418
- DaileyFECronanJEJrAcetohydroxy acid synthase I, a required enzyme for isoleucine and valine biosynthesis in Escherichia coli K-12 during growth on acetate as the sole carbon sourceJ Bacteriol198616524534603511034
- FeistAMHenryCSReedJLA genome-scale metabolic reconstruction for Escherichia coli K-12 MG1655 that accounts for 1260 ORFs and thermodynamic informationMol Syst Biol 2007312117593909
- FeistAMPalssonBOThe growing scope of applications of genome-scale metabolic reconstructions using Escherichia coliNat Biotechnol200826665966718536691
- SinghVKGhoshIKinetic modeling of tricarboxylic acid cycle and glyoxylate bypass in Mycobacterium tuberculosis, and its application to assessment of drug targetsTheor Biol Med Model 200632716887020
- DwyerDJKohanskiMAHayeteBCollinsJJGyrase inhibitors induce an oxidative damage cellular death pathway in Escherichia coliMol Syst Biol 200739117353933
- JorgensenCMHammerKJensenPRMartinussenJExpression of the pyrG gene determines the pool sizes of CTP and dCTP in Lactococcus lactisEur J Biochem2004271122438244515182359
- ChristophersonRIDugglebyRGMetabolic resistance: the protection of enzymes against drugs which are tight-binding inhibitors by the accumulation of substrateEur J Biochem198313423313356873066
- IngrahamJLNFEscherichia coli and Salmonella typhimurium: Cellular and Molecular Biology1st editionAmerican Society for Microbiology Press1987
- KarpPDKeselerIMShearerAMultidimensional annotation of the Escherichia coli K-12 genomeNucleic Acids Res200735227577759017940092
- DavisMSCronanJEJrInhibition of Escherichia coli acetyl coenzyme A carboxylase by acyl-acyl carrier proteinJ Bacteriol200118341499150311157970
- HeathRJRockCOInhibition of beta-ketoacyl-acyl carrier protein synthase III (FabH) by acyl-acyl carrier protein in Escherichia coliJ Biol Chem19962711810996110008631920
- UmbargerHEAmino acid biosynthesis and its regulationAnnu Rev Biochem197847532606354503
- FavreRWiaterAPuppoSIaccarinoMExpression of a valineresistant acetolactate synthase activity mediated by the ilv O and ilv G genes of Escherichia coli K-12Mol Gen Genet19761433243252765758
- BeyerAHollunderJNasheuerHPWilhelmTPost-transcriptional expression regulation in the yeast Saccharomyces cerevisiae on a genomic scaleMol Cell Proteomics20043111083109215326222
- IshihamaYSchmidtTRappsilberJProtein abundance profiling of the Escherichia coli cytosolBMC Genomics 2008910218304323
- IshiiNNakahigashiKBabaTMultiple high-throughput analyses monitor the response of E. coli to perturbationsScience2007316582459359717379776
- DWThe Physiology and Biochemistry of Prokaryotes2nd editionOxford University PressUSA1999
- ValiSChintaSJPengJInsights into the effects of alpha-synuclein expression and proteasome inhibition on glutathione metabolism through a dynamic in silico model of Parkinson’s disease: validation by cell culture dataFree Radic Biol Med20084591290130118761401
- FunahashiAMorohashiMKitanoHTanimuraNCellDesigner: a process diagram editor for gene-regulatory and biochemical networksBIOSILICO200315159162
- FunahashiAMatsuokaYJourakuACellDesigner 35: a versatile modeling tool for biochemical networksProceedings of the IEEE200896812541265
- KholodenkoBNNegative feedback and ultrasensitivity can bring about oscillations in the mitogen-activated protein kinase cascadesEur J Biochem200026761583158810712587
- PengLShimizuKGlobal metabolic regulation analysis for Escherichia coli K-12 based on protein expression by 2-dimensional electrophoresis and enzyme activity measurementAppl Microbiol Biotechnol200361216317812655459
- LiuMDurfeeTCabreraJEGlobal transcriptional programs reveal a carbon source foraging strategy by Escherichia coliJ Biol Chem200528016159211592715705577
- PetranovicDMijakovicIPhotometric assay for measuring the intracellular concentration of branched-chain amino acids in bacteriaJ Microbiol Methods200456113313614706758
- LaRossaRASchlossJVThe sulfonylurea herbicide sulfometuron methyl is an extremely potent and selective inhibitor of acetolactate synthase in Salmonella typhimuriumJ Biol Chem198425914875387576378902
- HeinriksonRLMeredithSCAmino acid analysis by reverse-phase high-performance liquid chromatography: precolumn derivatization with phenylisothiocyanateAnal Biochem1984136165746711815