Abstract
Gene set enrichment analysis for analyzing large profiling and screening experiments can reveal unifying biological schemes based on previously accumulated knowledge represented as “gene sets”. Most of the existing implementations use a fixed fold-change or P value cutoff to generate regulated gene lists. However, the threshold selection in most cases is arbitrary, and has a significant effect on the test outcome and interpretation of the experiment. We developed a new gene set enrichment analysis method, ie, FDR-FET, which dynamically optimizes the threshold choice and improves the sensitivity and selectivity of gene set enrichment analysis. The procedure translates experimental results into a series of regulated gene lists at multiple false discovery rate (FDR) cutoffs, and computes the P value of the overrepresentation of a gene set using a Fisher’s exact test (FET) in each of these gene lists. The lowest P value is retained to represent the significance of the gene set. We also implemented improved methods to define a more relevant global reference set for the FET. We demonstrate the validity of the method using a published microarray study of three protease inhibitors of the human immunodeficiency virus and compare the results with those from other popular gene set enrichment analysis algorithms. Our results show that combining FDR with multiple cutoffs allows us to control the error while retaining genes that increase information content. We conclude that FDR-FET can selectively identify significant affected biological processes. Our method can be used for any user-generated gene list in the area of transcriptome, proteome, and other biological and scientific applications.
Introduction
Expression profiling analysis usually begins with the generation of gene lists ranked by fold-changes or P values. Interpretation of the gene lists can be facilitated by analytical approaches such as gene set enrichment analysis,Citation1 which utilizes a priori constructed reference gene sets that groups genes by classifiers, such as biological function or chromosome location.Citation2 This type of analysis can help to identify the underlying biological mechanisms and increase the statistical power by reducing the dimensionality of the problem.
The general framework and methodology of gene set enrichment analysis approaches have been thoroughly analyzed and discussed.Citation2,Citation3 These methods can be classified as either self-contained or competitive, based on the definition of the null hypothesis. A self-contained test compares a gene set with a fixed standard, and is not dependent on genes outside of the set. These methods make use of the raw expression data, and some of them are based on logistic regression models while others utilize Hotelling’s t2-tests or the more general multivariate analysis of variance models.Citation4,Citation5 By contrast, a competitive test compares the differential expression of a gene set with that of its complement. Most of these methods examine whether regulated genes are over-represented in a given gene set by a test of independence in a two-by-two contingency table, where the test statistic can be constructed based on χ2, hypergeometric, or binomial distribution.Citation6 A strict fold-change or P value cutoff is needed to obtain the regulated gene list, but the choice of the cutoff is often arbitrary and can have a significant influence on the test outcome and, subsequently, the interpretation of an experiment.Citation7,Citation8 Alternatively, methods that utilize the whole vector of P values or fold-changes have been developed.Citation9,Citation10 For example, parametric analysis of gene-set enrichment (PAGE) implements a computationally efficient solution based on the central limit theorem to define an enrichment probability.Citation10
Implementation
We have implemented a new gene set enrichment analysis method, FDR-FET, which was first described by Ji et alCitation11 in a transcriptional profiling study of compound dose responses. The current implementation extends the original method and provides options to choose the reference set (ie, “gene universe”).
FDR-FET automatically optimizes the cutoff criterion for a gene list (L) under investigation using a false discovery rate (FDR) procedure that employs a series of linearly increasing critical valuesCitation12 and has been shown to control the FDR at prespecified levels for independent test statistics.Citation13 Rather than employing a single FDR criterion that would represent an arbitrary limitation of the analysis, we calculated a series of regulated gene lists (li, where li ⊂ L, 1 ≤ I ≤ 35), corresponding to FDR cutoff values of 1%–35% (default, or per user-specified) in 1% increments.
We denote the gene set collection as S. The overlap between li and a gene set s of interest (s ⊂ S) is examined using a Fisher’s exact test (FET). We utilize the right test that evaluates the significance of positive association between two lists, ie, an enrichment of elements of list A (eg, li) in list B (eg, s) or vice versa.Citation14 For each s, there are as many as 35 FETs to be performed by default, and the most significant P value is retained. This procedure is repeated for each gene set s in S.
We have implemented FDR-FET as a Perl module (Bio::FDR-FET) with C inline codes. The module expects that gene sets S consisting of gene identifiers and associated classifiers, and gene list L consisting of unique gene identifiers and associated P values from a study of interest. We also provide an executable program that uses this module and reads two input files containing these datasets. The Perl module will evaluate each gene set s and output detailed analysis information such as best P value, odds ratio, and the corresponding FDR cutoff, numbers in the contingency table, and genes in the overlap (between s and the li with the best P value). The C inline code of the Perl module is a slightly modified implementation of the FET code found in RCitation15 that is based on an elegant computation of binomial coefficients.Citation16 The test data in the module contains the Gene Ontology pathways and gene P values are used in the example in the next section.
Additional options are provided to deal more rigorously with the choice of reference set that has a major influence on the P value. We allow four options for the reference set, ie, genes in L (“genes”), union of genes in L and S (“union”), intersection of genes in L and S (“intersection”), and a userspecified arbitrary number (“user”). In particular, the third choice excludes genes with unknown classification from being counted as negative matches, which may be an issue with P value calculations. Details of how to use the Perl module can be found by searching for ‘Bio::FdrFet’ in the CPAN search website (http://search.cpan.org/).
Results and discussion
Here we demonstrate the performance of FDR-FET from three perspectives. First, we assessed the selectivity and sensitivity of the method. Second, we compared FDR-FET with other gene set enrichment analysis methods. Because FDR-FET takes P values as input and does not differentiate the directions of gene regulation, we chose two popular implementations of the same category, ie, a simple FET and PAGE. Third, we compared the results generated from different reference set options.
In general, the sensitivity of gene set enrichment analysis can be improved by removal of background noise, which can have a strong impact on the FDR result through removing the bottom n percentile of low intensity probes or probes flagged as “absent”, or similar. Consolidation of probes onto the gene level is also recommended to improve independence of measures, which is one assumption of FET.Citation3 For example, Affymetrix probe sets can be consolidated by associating each gene with the most significant P value among all probe sets for the gene. Alternatively, one can utilize the updated probe set definitions, which have been shown to improve the precision and accuracy of microarray data analysis.Citation17,Citation18
We utilized a microarray dataset from a published study on the cellular effects of three human immunodeficiency virus (HIV) protease inhibitors.Citation19 It is well known that patients taking protease inhibitor drugs to treat HIV-autoimmune deficiency syndrome often develop a lipodystrophy-like syndrome, including hyperlipidemia, peripheral lipoatrophy, and central fat accumulation.Citation20 Parker et alCitation19 have shown that protease inhibitors could induce gene expression changes indicative of dysregulation of lipid metabolism, endoplasmic reticulum stress, and metabolic disturbance. These results are consistent with clinical observations, and provide a basis for a molecular mechanism for the pathophysiology of protease inhibitor-induced lipodystrophy.
The probe set level expression data was generated using the MAS 5.0 algorithm with quantile normalization,Citation21 and the 20% lowest expressed probe sets were removed. A one-way analysis of variance with respect to the “drug treatment” factor was performed to generate the sorted gene list by P values. We utilized gene sets from both the Gene OntologyCitation22 project and the Kyoto Encyclopedia of Genes and Genomes (KEGG).Citation23
Validation of FDR-FET
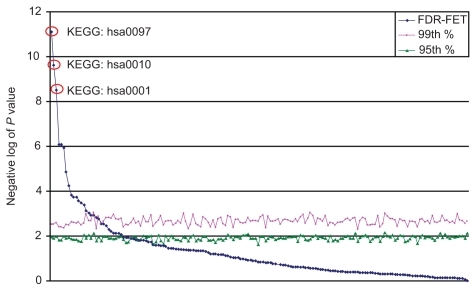
To demonstrate the sensitivity and selectivity of FDR-FET, we generated 1000 randomized gene lists while retaining the same set of P values from the analysis of variance. We ran FDR-FET on each of these gene lists using reference set option 1 (ie, “genes”) and maximal FDR at 35% for every gene set in KEGG. The 95th and 99th percentiles of the negative log of P values were calculated for every gene set, and these values are found to center around 1.9 and 2.6, respectively (). As expected, no gene set shows any large deviation from the others. By contrast, the P values generated from the real dataset exhibit a nonuniform distribution with only a few highly significant gene sets. Importantly, the top three gene sets with the largest separations from the 99th percentiles are the targets of HIV protease inhibitors, ie, aminoacyl-tRNA biosynthesis (KEGG:hsa00970), biosynthesis of steroids (KEGG:hsa00100), and glycolysis/gluconeogenesis (KEGG:hsa00010).
Figure 1 Performance assessment of FDR-FET using simulated datasets. P values are calculated for gene sets from the KEGG for each of the 1000 randomized gene lists using FDR-FET (with the option “genes” and maximal FDR 35%). The 95th (red, squares) and 99th (green, triangles) percentiles of the P values are calculated for each of the gene sets. Gene sets are ordered by their P values calculated from the real dataset (blue, diamonds). The top three gene sets (highlighted in red circles) with the largest separations from the 99th percentiles are the targets of human immunodeficiency virus protease inhibitors, ie, aminoacyl-tRNA biosynthesis (KEG:hsa00970), steroid biosynthesis (KEG:hsa00100), and glycolysis/gluconeogenesis (KEGG:hsa00010).
Comparison of FDR-FET with a simple FET test
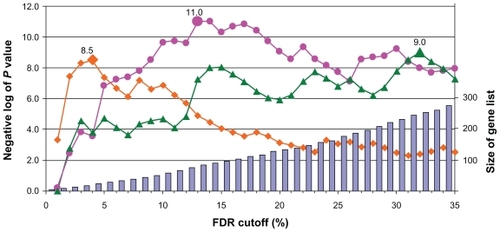
Many of the existing gene set enrichment analysis implementations are based on FET with a fixed P value or fold-change cutoff. To compare the performance of FDR-FET, which employs a flexible cutoff criterion, with that of a typical gene set enrichment analysis, we analyzed the regulated gene list generated with an arbitrary FDR cutoff (35%). Table 1 contains the 10 most significant gene set hits calculated by FDR-FET using reference set option 1 (ie, “genes”) and maximal FDR at 35%. This list includes all the established major targets of the HIV protease inhibitors (lipid metabolism, amino acid metabolism, gluconeogenesis, and endoplasmic reticulum). By contrast, when a single arbitrary FDR cutoff (35%) is used, the effect on gluconeogenesis associated with the pathophysiology of protease inhibitors is missed. Moreover, as depicted in , the P values for three representative gene sets reach the maximal significance at different FDR cutoffs, demonstrating that the utilization of a flexible cutoff criterion indeed maximizes the signal to noise ratio of a gene list for individual gene sets.
Figure 2 The impact of cutoff criterion on gene set analysis result. The influence of the FDR cutoff on the size of regulated gene list (bars, right axis) and on the significance of selected gene sets (calculated with the option “genes”) for the human immunodeficiency virus protease inhibitor experiment, ie, endoplasmic reticulum (GO:0005783; red, circles), lipid biosynthetic process (GO:0008610; green, triangles), and glycolysis/gluconeogenesis (KEG:hsa00010; orange, diamonds). The highlighted data points indicate the maximal P values (labeled) for the respective hits in the gene sets.
Comparison of FDR-FET with PAGE
PAGE analysis was performed using the whole vector of P values from the one way analysis of variance as input. Because PAGE is based on the central limit theorem that requires gene sets to be sufficiently large, we only examined those gene sets with sizes ≥10. The negative log of P values for three gene sets (ie, GO:0006418, GO:0004812, and KEGG:hsa00970) are set to 20 because they all have a P value of zero by PAGE analysis. Again, we could identify all the major targets of HIV protease inhibitors in the top 10 gene set hits from PAGE output (Appendix 1). Interestingly, the results from FDR-FET and PAGE show high concordance, despite the fundamental difference in their underlining methodologies (). Using a gene set negative log P value cutoff of 3, PAGE identified 76 significant affected gene sets, whereas FDR-FET identified 79, among which 63 are shared between the two methods. In particular, the two top 10 hit lists have eight gene sets in common.
Figure 3 Comparison of the analysis result of FDR-FET with that of PAGE. P values are calculated for gene sets from the Gene Ontology and KEG for the human immunodeficiency virus protease inhibitor experiment using FDR-FET (with the option “genes” and maximal FDR 35%) and PAGE (using the whole vector of gene P values as input). Gene sets of size ≥10 are included in the plot.
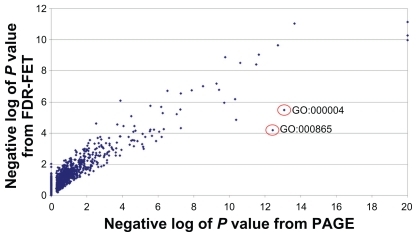
Because PAGE is a parametric test, it is generally more liable to gene outliers. In other words, a gene (or a few genes) with a sufficiently large fold-change may lead to significant testing results for the gene set of which the gene is a member. For instance, GO:0008652 and GO:0000049 have highly significant P values by PAGE, but only modest P values by FDR-FET (). A close examination of the genes annotated to these two gene sets reveals that both contain a couple of genes with extremely low P values from the analysis of variance test (Appendix 2). By contrast, genes in FET-based methods have equal weight, and the P value reflects the gene set enrichment in the regulated gene list, true to the name of gene set enrichment analysis. There are areas where FDR-FET and PAGE can complement each other. For example, FDR-FET is more robust when the gene set size is small and when PAGE cannot produce a reliable P value. On the other hand, incomplete gene annotation may affect FET-based methods more than PAGE because lack of knowledge is counted as a “true negative” in the contingency table.
Comparison of different reference set options
When the biological experiment is performed using a focused gene array (ie, a subset of genes from a genome), the whole genome is used as the reference set, and the number of “true negative” is inflated, leading to unrealistic small P values in gene set enrichment analysis outputs. Therefore, one must evaluate what is (close to) the true “universe” for an enrichment analysis. We have introduced new options to address this issue:
“Genes” whereby all genes tested are counted in the gene set enrichment analysis calculation, assuming that the gene sets are universally representing the genome universe
“Intersection” can be used when the gene sets are selected to represent a restricted universe, eg, signaling pathways; in this case, only genes that are present in at least one of the signaling pathways are counted
“Union” represents the general case by which any genes are counted once they are present in either the regulated gene list or the gene sets (“genome as reference set”). In options “genes” and “union”, annotated and unannotated
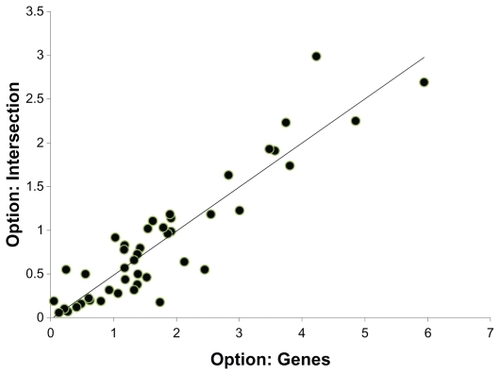
genes are both counted in the reference set, while in option “intersection”, genes are only counted when they are annotated in at least one of the gene sets. Table 2 contains the 10 most significant gene set hits by the option “genes” and the corresponding P values, and ranks by options “union” and “intersection” calculated using maximal FDR at 35%. All three options identified the main HIV protease inhibitor targets, present in the top 10 s, except for gluconeogenesis, which is ranked 12th in results generated from the “union” option. Using a gene set negative log P value cutoff of 3, the options “genes” and “intersection” identified similar numbers of affected gene sets, 79 and 73, respectively, among which 71 gene sets are shared between the two hit lists. By contrast, the “union” option identified 96 gene sets, of which 21 are unique to this option and appear to be nonspecific and unrelated to the drug effects upon close examination, suggesting a possible loss of selectivity with this option (Appendix 1). The effect of “intersection” becomes more apparent when smaller gene sets are used. The P values and the order of the hits are altered when considering smaller reference sets (Appendix 1 and Appendix 3). By selecting an appropriate reference set, we can enhance the sensitivity and selectivity and reduce the number of spurious hits.
Conclusion
In summary, the employment of FDR and multiple cutoffs provides statistical rigor with additional flexibility. The gene list size is dynamically adjusted so that genes that increase information content are retained, but the addition of noise is limited. This methodology can be applied to results from divergent experiments (eg, hit lists from expression profiling and proteomics studies) as often found in chemogenomics and systems biology approaches.
Authors’ contributions
RRJ: method conception and development of Fdr-Fet, data analysis, writing of manuscript; KHO: expert advice of method, conception of altered reference sets, data analysis, writing of manuscript; RY: expert advice of method, data analysis, revision of manuscript; REB: implementation and testing of Fdr-Fet, revision of manuscript. All authors read and approved the final manuscript.
Disclosure
This work was supported by Bristol–Myers Squibb, the past and current employer of the authors.
References
- AllisonDBCuiXPageGPSabripourMMicroarray data analysis: From disarray to consolidation and consensusNat Rev Genet20067556516369572
- AckermannMStrimmerKA general modular framework for gene set enrichment analysisBMC Bioinformatics2009104719192285
- GoemanJJBühlmannPAnalyzing gene expression data in terms of gene sets: Methodological issuesBioinformatics20072398098717303618
- SartorMALeikaufGDMedvedovicMLR path: A logistic regression approach for identifying enriched biological groups in gene expression dataBioinformatics20092521121719038984
- UcarDNeuhausIRoss-MacDonaldPConstruction of a reference gene association network from multiple profiling data: Application to data analysisBioinformatics2007232716272417846039
- KhatriPDrăghiciSOntological analysis of gene expression data: Current tools, limitations, and open problemsBioinformatics2005213587359515994189
- BreitlingRAmtmannAHerzykPIterative group analysis (iGA): A simple tool to enhance sensitivity and facilitate interpretation of microarray experimentsBMC Bioinformatics200453415050037
- Al-ShahrourFDíaz-UriarteRDopazoJDiscovering molecular functions significantly related to phenotypes by combining gene expression data and biological informationBioinformatics2005212988299315840702
- LuoWFriedmanMSSheddenKHankensonKDGAGE: Generally applicable gene set enrichment for pathway analysisBMC Bioinformatics20091016119473525
- KimSYVolskyDJPAGE: Parametric analysis of gene set enrichmentBMC Bioinformatics2005614415941488
- JiRRde SilvaHJinYTranscriptional profiling of the dose response: A more powerful approach for characterizing drug activitiesPLoS Comput Biol20095e100051219763178
- SimesRJAn improved Bonferroni procedure for multiple tests of significanceBiometrika198673751754
- BenjaminiYHochbergYControlling the false discovery rate: A practical and powerful approach to multiple testingJ Roy Statist Soc Ser1995B57289300
- AgrestiAA survey of exact inference for contingency tablesStat Sci19927131153
- R Development Core TeamR: A language and environment for statistical computing2009The R Foundation for Statistical ComputingVienna, Austria Available from: http://www.r-project.orgAccessed February 4, 2011
- LoaderCFast and accurate computation of bionomial probabilities2000 Available from: http://projects.scipy.org/scipy/raw-attachment/ticket/620/loader2000Fast.pdfAccessed February 4, 2011
- DaiMWangPBoydADEvolving gene/transcript definitions significantly alter the interpretation of GeneChip dataNucleic Acids Res200533e17516284200
- SandbergRLarssonOImproved precision and accuracy for microarrays using updated probe set definitionsBMC Bioinformatics200784817288599
- ParkerRAFlintOPMulveyREndoplasmic reticulum stress links dyslipidemia to inhibition of proteasome activity and glucose transport by HIV protease inhibitorsMol Pharmacol2005671909191915755908
- CalzaLManfrediRChiodoFDyslipidaemia associated with anti-retroviral therapy in HIV-infected patientsJ Antimicrob Chemother200453101414645323
- BolstadBMIrizarryRAAstrandMSpeedTPA comparison of normalization methods for high density oligonucleotide array data based on variance and biasBioinformatics20031918519312538238
- AshburnerMBallCABlakeJAGene ontology: Tool for the unification of biology. The gene ontology consortiumNat Genet200025252910802651
- KanehisaMArakiMGotoSKEGG for linking genomes to life and the environmentNucleic Acids Res200836D48048418077471
Appendices
Appendix 1
http://expertbioinfo.com/Papers/FDR_FET/FDR_FET_Appendix1.xls
Appendix 2
http://expertbioinfo.com/Papers/FDR_FET/FDR_FET_Appendix2.xls
Appendix 3
Comparison of the negative log of the P values calculated with the option “Genes” and “Intersection”. Only pathways associated with KEGG metabolism were chosen for this example. With the “Genes” option, ~11,000 genes were considered for the FDR-FET analysis. With the “Intersection” option only ~1000 genes that are represented at least once in 46 metabolism related pathways were considered.