 ?Mathematical formulae have been encoded as MathML and are displayed in this HTML version using MathJax in order to improve their display. Uncheck the box to turn MathJax off. This feature requires Javascript. Click on a formula to zoom.
Abstract
Previously described methods for the combined analysis of common and rare variants have disadvantages such as requiring an arbitrary classification of variants or permutation testing to assess statistical significance. Here we propose a novel method which implements a weighting scheme based on allele frequencies observed in both cases and controls. Because the test is unbiased, scores can be analyzed with a standard t-test. To test its validity we applied it to data for common, rare, and very rare variants simulated under the null hypothesis. To test its power we applied it to simulated data in which association was present, including data using the observed allele frequencies of common and rare variants in NOD2 previously reported in cases of Crohn’s disease and controls. The method produced results that conformed well to those expected under the null hypothesis. It demonstrated more power to detect association when rare and common variants were analyzed jointly, the power further increasing when rare variants were assigned higher weights. 20,000 analyses of a gene containing 62 variants could be performed in 80 minutes on a laptop. This approach shows promise for the analysis of data currently emerging from genome wide sequencing studies.
Introduction
As has previously been pointed out, there are obvious merits for combining information from different variants within a gene when considering whether there is in general, evidence that the gene influences a particular phenotype. Considering variants jointly models the biological reality that a number of different variants may separately impact the functioning of a gene. In addition, in the context of whole genome analyses, consideration of variation at the level of a gene reduces the problem of multiple testing, from having to deal with hundreds of thousands of variants, to having to deal with twenty thousand genes. However, a gene may contain common and rare variants that both affect phenotype but need to be dealt with in different ways. The combined affects of common variants can be dealt with by approaches that incorporate information obtained by analyzing individual variants, for example by utilizing the associated P-values.Citation1,Citation2 However, such methods are not applicable to very rare variants or those only observed once or twice in a sample. Methods to deal with such rare variants have previously been discussed,Citation3,Citation4 and may consist simply of a comparison between the combined counts of all rare variants observed in cases and controls.Citation5 This approach however, is limited in that difficulty may lie in the classification of a variant as “rare”, as common variants cannot be utilized, their much larger allele counts tending to swamp the signal from rare variants.
A more attractive approach is to utilize information jointly from both common and rare variants. One method of doing this, termed the combined multivariate and collapsing method, uses both the above approaches simultaneously to provide an overall test for association at the level of a gene.Citation2 A possible criticism of this approach is that variants with different allele frequencies need to be differentially classified so they can be subjected to different methods of analysis. Once again, it is not clear what criteria should be used to define a variant as “rare.” A previously described method that avoids having to treat common and rare variants as qualitatively different involves introducing a weighting scheme that accords more weight to rare variants, but which nevertheless incorporates information from all variants in a unified analysis. One can assign a weight to each variant, and for each subject one can then produce an overall score consisting of the sum of the allele counts for each variant multiplied by its weight.Citation6,Citation9 Thus, for each variant i the weight, wi, is given by:
Here, mi U is the number of mutant alleles observed for variant i in unaffected subjects, ni U is the number of unaffected subjects genotyped for variant I, and ni is the total number of affected and unaffected subjects genotyped for variant i. We define an indicator variable Iij which takes values of zero, one or two according to the number of mutant alleles of variant i in subject j. The genetic score for subject j is then given by:
These genetic scores can be compared between cases and controls in order to test the hypothesis that the gene is associated with the disease. As the distribution of these scores under the null hypothesis is unknown, the authors recommended a permutation test based on the ranks of these scores, and have stated that this could be completed for 20,000 genes, each with 50 polymorphic loci, in a sample of 1000 cases and 1000 controls in 600 hours.
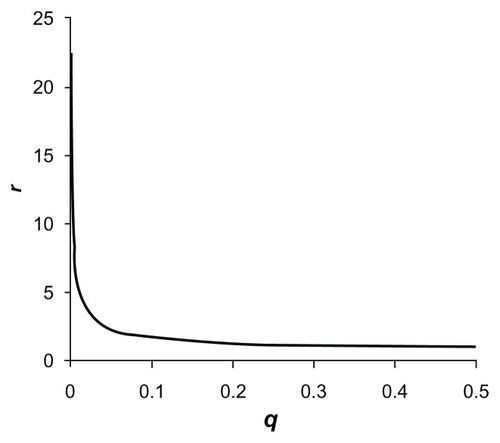
It can be argued, however, that, although attractive in principle, the approach as described has a number of drawbacks. One problem is that the weight accorded to each variant differs markedly with different sample sizes. In order to better understand this effect and how it occurs, we can define a measure rq as the ratio of the weight, w, accorded to a variant with equal allele frequencies (minor allele frequency [MAF] = 0.5) relative to the weight for a variant with MAF, q. As the analysis will depend on the relative rather than the absolute values of weights, r is a useful measure to better understand the performance of the method. It also defines the relative contribution to the genetic score of each allele observed, with the contribution of an allele with MAF = 0.5 being taken to be one. If all variants are genotyped in the same number of subjects (so that ni is constant), then r is given by:
If we define a “very rare” variant as one that is not observed at all in controls, then the method as described will estimate q as 1/(2nU + 2). For samples with equal numbers of cases and controls (so that ni = 2ni U), then for such very rare variants r will equal 7.1 for a sample size of 100 controls, 22.4 for a sample size of 1000, and 70.7 for a sample size of 10,000. The fact that the weights assigned are dependent on sample sizes would mean that studies of the same gene would not be directly comparable across different datasets.
A more critical problem is that there is an intrinsic bias in this approach as the estimated frequency of the variant is only based on observations in control subjects. The rationale for doing this is that one seeks to estimate the frequency of the variant in the general population, without artificially inflating the frequency by taking information from cases in which the frequency of a disease causing variant may be higher. In practice this inevitably introduces a bias into the procedure. This phenomenon has been discussed elsewhere in more general terms.Citation7 In the present context, it means that variants which occur in cases but not controls will be weighted more highly than variants which occur only in controls. Specifically, a variant observed once in cases but not in controls will make a contribution to the score that is
greater than a variant observed once in controls but not in cases. As the value for r falls as q increases, and, because q is calculated from the number of alleles observed in controls, a variant observed twice in cases but not in controls makes a contribution which is
greater than that of a variant observed twice in controls but not in cases. This asymmetrical nature of the analysis is the prime reason why it is necessary to use a permutation test to evaluate the significance of the results.
It might be thought that a simple way to avoid this bias would be to base allele frequency estimates on both cases and controls rather than just on cases. However, this then creates a different problem in that the weight is extremely sensitive to the estimated allele frequency. The relative weight assigned according to allele frequency is illustrated in . This shows how the allocated weight falls dramatically as the frequency increases from zero. We can envisage a scenario whereby a very rare variant occurs only in cases. If we estimate the MAF as q = m/2n (where m is the allele count in both cases and controls and n is the number of cases and controls), then obviously if we observe the variant twice amongst cases rather than once, we will double the estimate of q. If we use these observations to produce a value for w, then the relative weight, r, for a variant observed 4 times is approximately half that for a variant observed only once. If we consider two variants which are seen only amongst cases then the contribution made to the overall genetic score for the sample made by a variant that occurs 4 times will only be twice that of the contribution of a variant that only occurs once. For a variant occurring 10 times in cases and never in controls, its overall contribution is only 3.2 times that of a variant that only occurs once. This loss of information would be expected to reduce the power of the analysis to detect the effects of rare variants.
Figure 1 Plot of the relative weight, r, using the originally proposed weighting scheme accorded to each allele of a variant with frequency q for sample size n = 2000.
The previously proposed weighting scheme generates weights that are sensitive to sample size and that produce genetic scores that can only be analyzed using permutation testing. Here we propose and evaluate an alternative weighting scheme that can produce score statistics with a known null hypothesis distribution. This means that analysis can be very rapid relative to permutation testing. Additional advantages of the approach we propose include weights that do not vary markedly according to sample size and that the user can readily tune the weights which are allocated by using a weighting factor that can be adjusted as appropriate for the dataset being analyzed.
Methods
The method of analysis we propose utilizes a novel weighting scheme that incorporates a weighting factor, f. Using the allele frequency qi derived from the whole sample of cases and controls:
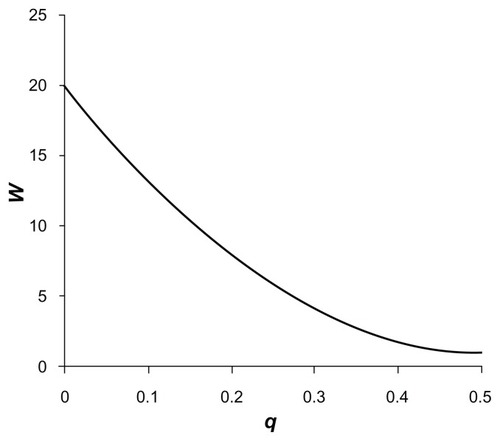
we assign a weight Wi according to this formula:
This is the equation for a parabola with a minimum value of 1 at q = 0.5, which intercepts the y-axis at f when q = 0. (To make the approach easier to understand, we define W so that it increases with rarer variants. This means it can be used as a multiplier for contributions to the score rather than a divider as w was.) illustrates this weighting function for a value of f = 20, showing that allocated weights fall more gradually with the parabolic function than for the approximately inverse square root function previously used. Using different values of f allows the relative weight assigned to rare variants to be varied. If f = 1 is used, then all variants are weighted equally. This will mean that common variants occurring frequently will tend to contribute the most information. On the other hand, if a large value is used such as f = 1000, rare variants will be accorded far more weight and common variants will be relatively ignored. If for some reason one wished to ignore contributions from very rare variants, then one could set f = 0.
Figure 2 Plot of the weight, W, using the novel weighting scheme accorded to each allele of a variant with frequency q and weighting factor f = 20.
Similar to the previous approach, a genetic score is calculated for each subject j, as the sum of the products of the allele count for each variant multiplied by its weight, Wi:
The scores for a set of cases and controls can then be compared with a standard two-sample t-test. The test is one-tailed because it tests the hypothesis that the allele with a lower frequency at each variant tends to be found more commonly amongst cases than controls. This test is expected to be valid as there is no asymmetry in the way cases and controls are treated, hence the test should be unbiased.
In order to demonstrate the validity of this approach, it was applied to simulated datasets containing variants of different frequencies: a common variant with MAF = 0.45, a rare variant with MAF = 0.01, and a combined set of 20 very rare variants each with MAF = 0.0005 analyzed together. A sample size of 1000 cases and 1000 controls was used and 10,000,000 simulations were carried out for each dataset. Each type of variant was analyzed separately and then all three were analyzed jointly. For the individual analyses the weighting was irrelevant, but for the joint analysis different weighting factors of 1, 10, 100, and 1000 were used.
In order to make some assessment of the power of the approach it was applied to datasets simulated with different values for the MAF in cases and controls. For the common variant, values of 0.5 and 0.45 were used, for the rare variant 0.015 and 0.05, and for the very rare variants 0.00025 and 0.000025. These values were chosen so that each type of variant would produce a similar P value if analyzed separately. Again, a sample size of 1000 cases and 1000 controls was used, with variants analyzed individually and jointly with different weighting factors. For each dataset, 1000 simulations were performed. The proportion of simulations achieving critical P-values of 10−3, 10−4, 10−5 and 10−6 was measured and the average −log(p) was calculated.
The method was also applied to a dataset based on a published study of NOD2 (previously named CARD15), in which all variants were identified in a sample of 453 subjects with Crohn’s disease and 103 controls.Citation8 This study identified nine common variants (MAF > 5%) along with 53 rare variants which were observed in cases, controls, or both. Again, 1000 simulations were performed to produce sample datasets that were generated using the observed allele frequencies. The simulations were carried out conditional on the observed allele frequencies and assuming independence between the loci. The new method was applied to each common variant individually, all common variants jointly, all rare variants jointly, and finally all variants in a combined analysis with a range of weighting factors.
In order to gain an assessment of how long the method would take to perform on genome wide data, 20,000 analyses were performed on the combined set of all 62 NOD2 variants.
Results
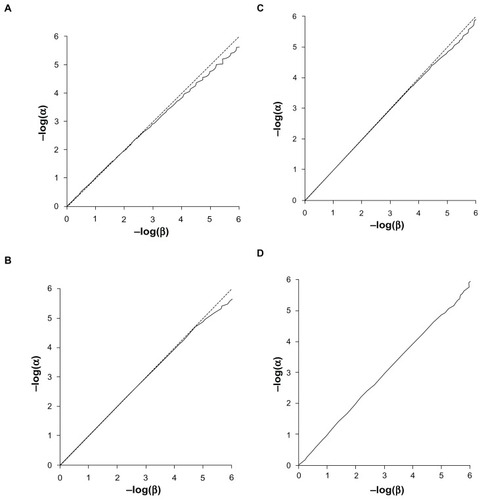
The Q-Q plots for the expected versus observed values for −log(p) are shown in for the common and rare variants considered independently and very rare variants analyzed together. These plots show that the method is valid and conforms fairly well with the expected distribution. The method is mildly anticonservative for small P-values when applied to the common variant. This may reflect the discrete nature of the data, as each subject will have a relative score of 0, 1, or 2 rather than a continuously distributed trait as expected by the t-test. The test is somewhat conservative for small P-values when applied to rare variants, which is likely due to the small total number of variant alleles. This means that the datasets are somewhat under-powered to achieve highly significant results. shows the Q-Q plots when applied to combined analyses of all loci with different values for the weighting factor, f. These show that when variants with different weights contribute to the scores, then the method conforms well to the expected distribution.
Figure 3 Q-Q plot of −log(α) against −log(β). (A) Common variant (MAF = 0.45). (B) Rare variant (MAF = 0.01). (C) 20 very rare variants analyzed together (each with MAF = 0.0005).
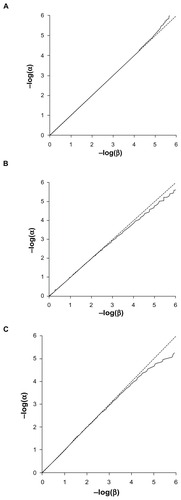
Figure 4 Q-Q plot of −log(α) against −log(β). (A) Weighting factor f = 1. (B) Weighting factor f = 10. (C) Weighting factor f = 100. (D) Weighting factor f = 1000.
The power for the test to produce critical P-values is shown in along with the mean values for −log(p). This shows that the common, rare, and very rare variants when considered separately produce average −log(p) values of 3.28, 3.28, and 3.04, respectively. If they are included in a combined analysis with a weighting factor of 1, so that allele counts of all variants are simply added together, an average −log(p) of 4.74 is obtained with a power of 0.22 to achieve a P-value of 10−6. However, if the weighting factor is increased to 10, then the average −log(p) increases to 7.08 and the power to achieve a P-value of 10−6 increases to 0.69. Larger values for the weighting factor of 100 or 1000 resulted in reduced power although still exceeding that for the unweighted analysis. shows the graph of average −log(p) against different values for the weighting factor. It can be seen that the maximum power occurs with weighting factors somewhat less than 10. In fact, the maximum average −log(p) of 7.29 is obtained with f = 6.3.
Figure 5 Plot of the mean −log(p) value obtained for different values of the weighting factor, f, when applied to combined analysis of all variants in simulated datasets of 1000 cases and 1000 controls.
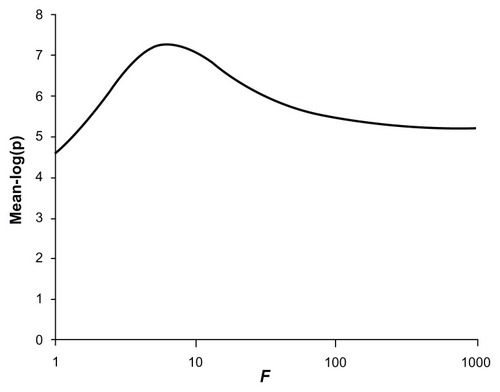
Table 1 Power of score analysis to detect association using different datasets and weighting factors
The P-values obtained when the method is applied to real data are shown in . Six of the nine common variants each produced evidence in favor of association with average −log(p) values ranging from 2.19 to 4.36. When all common variants were analyzed together they produced an average −log(p) of 4.84. The 53 rare variants produced only modest evidence for association and when analyzed together produced an average −log(p) of 2.20. When the common and rare variants were all included in an unweighted analysis they produced a stronger evidence for association with an average −log(p) of 5.78. Changing the weighting factor, f, to 10 resulted in a higher average −log(p) of 6.37. Using this weighting factor produced some increase in power at all P-values, and the power to obtain a P-value of 10−6 increased from 0.42 to 0.57. Using higher values for the weighting factor resulted in diminished power, similar to that for the unweighted analysis. shows the graph of average −log(p) against different values for the weighting factor and shows that the maximum average −log(p) of 7.01 is obtained with f = 2.5.
Figure 6 Plot of the mean −log(p) value obtained for different values of the weighting factor, f, when applied to combined analysis using variant counts generated from those observed in NOD2.
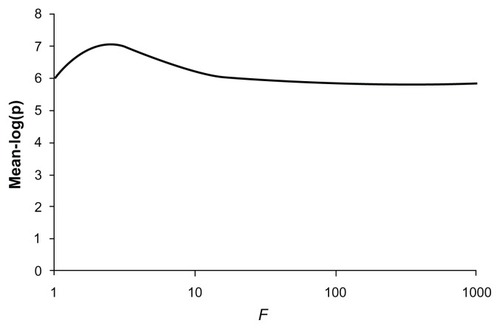
Table 2 Power of score analysis to detect association using different datasets and weighting factors using variant counts generated from those observed in NOD2Citation8
The time taken to carry out 20,000 analyses of repeated simulations from the real data incorporating all 62 variants was 80 minutes on a Windows laptop with a 2.4 GHz Intel Core i7 processor.
Discussion
The proposed method of analysis applies a standard two-sample t-test to genetic scores obtained from allele counts of variants weighted according to their observed frequency in both cases and controls. This avoids the need for permutation testing and allows for rapid analysis. Simulation studies confirm that the method is valid and demonstrate that combining information from both common and rare variants can, in at least some situations, provide more power than considering each separately. Furthermore, it confirms that weighting the scores from different variants can further increase power. The use of a smooth weighting function means that all types of variants are subjected to the same method of analysis. A weighting factor allows the user to choose a weighting scheme appropriate for the type of trait being studied.
Of course, as pointed out previously,Citation6 a variety of different functions could be used to generate weights. We have chosen a parabolic function that can easily be adjusted and that produces weights relative to a value of one for variants with MAF = 0.5. It is possible, however, that more or less sharply curved functions or sigmoid functions might offer some advantages. Most importantly, we are of the opinion that cases and controls should be treated equally to avoid the need for simulation, and that the function should not fall off too sharply with very small values of MAF.
It is easy to speculate that different values for the weighting factor might be appropriate for different situations. A high value, which gave more weight to very rare variants, might be helpful for a disease that appeared often to result from mutations with large effect size, typically a rare disease with Mendelian inheritance. Conversely, one might speculate that a common syndrome that might be expected to arise from the cumulative effects of common variants could be more appropriately analyzed with a relatively low value, although of course rare variants might still exert important effects. As the analyses are quick to perform, it might be reasonable to analyze datasets using a number of different values for the weighting factor, provided that appropriate corrections are then made for multiple testing. The different results obtained using different weighting factors might then allow one to make some inferences about the nature of the effects influencing susceptibility to the trait in terms of the relative contribution of common and rare variants in the gene under consideration.
The method described clearly assumes some kind of additive contribution from different variants; however, it is unclear how well it would perform with variants with recessive effects. It might be possible, in principle, to devise some kind of alternative weighting scheme aimed specifically to detect associations using a recessive model.
In contrast to some approaches, no special treatment is required to deal with linkage disequilibrium (LD) between variants. If this is present it is not expected to affect the validity of the test. In essence this is because all information is combined at the level of the individual subject before being entered into the analysis. Hence, if there is nonindependence of genotypes within a subject, the fact that observations for different subjects are independent of each other is not affected. And so, the total scores are still expected to follow a random distribution under the null hypothesis. To illustrate this, we could consider the situation in which two variants are in complete LD with each other. This would be equivalent to having information from just one variant, but counting it twice for each subject, which would have exactly the same effect as assigning twice the weight to that variant. Thus, LD relationships can be seen as having equivalent effects to varying the weights assigned to variants. As such, they would not influence the validity of the analysis in the sense that they would not impact on the number of statistically significant results expected to occur by chance. They might, however, have an effect on power. If a large number of common variants were in LD with each other, then their contributions to the score might tend to overshadow contributions from individual variants. In such situations, it might be beneficial to identify this and in some way scale down the weights of variants belonging to such LD groups.
As was also noted for the previously described method,Citation6 this implementation implicitly assumes that it is the rare allele of each variant that may be associated with the disease. This allows the effects of different variants to be combined within an individual and also implies that significance testing can be one-sided. This assumption may be reasonable for rare variants when the phenotype being studied reduces fitness. However, the method as it stands could not be applied to a quantitative trait in which there was no a priori assumption as to the direction of effect of each allele.
There are both biological and statistical arguments in favor of considering the alternative hypothesis to be that in general it is the rarer allele of each variant that is associated with disease. The biological argument is that if one begins with the reference sequence and then generates a variant at random, then one is more likely to produce a disease than to prevent one. Additionally, if a randomly generated variant should happen to be beneficial and to confer a survival advantage, then, over time, selection pressures will increase its frequency until it ultimately becomes common. Thus, one may expect that, on average, rare variants will be more likely to be associated with deleterious phenotypes. There is also a statistical argument for basing the test on the assumption that rare variants will be more likely to show association with a rare phenotype, even if it is nondeleterious or even advantageous. To begin with an example, suppose that a particular phenotype has prevalence 0.01 and that a variant with allele frequency 0.001 in the population produces a ten-fold increase in risk of manifesting this rare phenotype. It is simple to calculate that in samples of cases with this phenotype and of controls, we would expect allele frequencies of 0.0099 and 0.00091, respectively. With a sample size of 500 of each we might expect to observe the variant in ten cases and one control. Now, suppose that we have a different variant also with frequency 0.001 but which is “protective” so that it produces a relative risk (RR) of 0.1 rather than ten. In this situation, we calculate the expected allele frequencies in cases and controls to be 0.0001 and 0.001. With the same sample size we might observe the variant once amongst the controls and not at all in the cases. Thus, the excess of the rare variant associated with the rare phenotype amongst subjects with the rare phenotype, is larger than the excess of the rare variant associated with the common phenotype observed amongst subjects with the common phenotype. If we were to count up both variants together we would still expect to find an overall excess of rare alleles amongst subjects with the rare phenotype in spite of the fact that both variants produce an equal and opposite effect on risk. This particular example represents just one instance of a general phenomenon, which is that if one assumes an equal and opposite effect on risk of a pair of variants with equal frequency, then there will be more enrichment of the “risk” variant amongst “cases” than there is enrichment of the “protective” variant amongst “controls.” This statistical effect continues to be active as the MAF of the variants increases. At higher values for the MAF, an additional complication occurs: the rarer allele becomes so enriched amongst cases that when the frequency is jointly estimated from cases and controls, this allele actually becomes designated as the “common” allele, in spite of the fact that in the population as a whole it is rarer. That is, the allele that is rarer in the population becomes the allele that is more common in the case control sample. Even taking this phenomenon into account, for pairs of variants with RR equal to 10 or 0.1, one still expects to observe an excess of more rare alleles amongst cases with true values of MAF up to 0.24. For values of RR of 2 and 0.5, one expects an overall excess of rare alleles for all values of MAF up to 0.42; and for values of RR of 1.5 and 0.7, one expects this up to values of MAF of 0.45. Thus, when variants within a gene affect risk there is a consistent phenomenon that means that, over a wide a range of genetic models, one expects to observe an overall excess of rare alleles amongst subjects having a rare phenotype. This statistical effect applies even before one considers the biological argument that one expects rare variants, a priori, to be deleterious.
It was also noted previouslyCitation6,Citation9 that weighting could be based not on allele frequency, but on the presumed effect of the variant on gene function. This could be equally incorporated into the score test as we describe it, the only additional feature being that we would suggest that the t-test be used for significance testing rather than permutation, provided that cases and controls were treated symmetrically. A further possibility would be to produce a combined weight based on both allele frequency and presumed effect. One simple approach would be to simply multiply the weight based on effect by the weight derived from frequency. Such techniques could mean that for example, a rare variant producing a nonsynonymous coding change would be assigned a higher weight than either a common nonsynonymous variant or a rare synonymous variant.
Tests such as these can be applied at the level of a single gene, a region within a gene, or a set of genes comprising a pathway. It is up to the user to define the region of interest and to make decisions about such matters as to whether or not to include intergenic variants and intronic variants, whether to focus on a particular transcript or particular exon, and what assumptions to make about how to define regulatory regions. Sometimes the same variant will be defined to be included in the analysis of two or more different genes but this does not pose any particular problem for the method.
Which functions and/or weighting schemes in fact produce the best performance when applied to real data can only be properly assessed when more such data becomes available for analysis. As such data emerges over the next few years it will be helpful to undertake a formal comparison of different approaches. For now, it seems reasonable to suggest that a weighting factor of around 10 might be appropriate for analyses of diseases in which it is suspected that both common and rare variants might contribute to risk.
Conclusion
We demonstrate that it is possible to implement a test for which association can combine information from both common and rare variants that has a known distribution under the null hypothesis. It is simple to implement, quick to perform, and could readily be applied to genome-wide sequence data.
Acknowledgment
Thanks to Vincent Plagnol for helpful discussions regarding this topic.
Availability
A program implementing the procedure, named SCOREASSOC, is available as part of the GCPROG package at http://www.mds.qmul.ac.uk/dcurtis/software.html. C source code and a Windows executable are provided.
Disclosure
The author reports no conflicts of interest in this work.
References
- CurtisDVineAEKnightJA simple method for assessing the strength of evidence for association at the level of the whole geneAdv Appl Bioinform Chem2008111512021918610
- LiBLealSMMethods for detecting associations with rare variants for common diseases: application to analysis of sequence dataAm J Hum Genet200883331132118691683
- MorrisAPZegginiEAn evaluation of statistical approaches to rare variant analysis in genetic association studiesGenet Epidemiol201034218819319810025
- Ionita-LazaIMakarovVYoonSFinding disease variants in Mendelian disorders by using sequence data: methods and applicationsAm J Hum Genet201189670171222137099
- LawrenceRDay-WilliamsAGElliottKSMorrisAPZegginiECCRaVAT and QuTie – enabling analysis of rare variants in large-scale case control and quantitative trait association studiesBMC Bioinformatics20101152720964851
- MadsenBEBrowningSRA groupwise association test for rare mutations using a weighted sum statisticPLoS Gene200952e1000384
- PearsonRDBias due to selection of rare variants using frequency in controlsNat Genet2011435392393 author reply 394–39521522173
- LesageSZoualiHCezardJPEPWG-IBD Group; EPIMAD Group; GETAID GroupCARD15/NOD2 mutational analysis and genotype-phenotype correlation in 612 patients with inflammatory bowel diseaseAm J Hum Genet200270484585711875755
- LiMXGuiHSKwanJSShamPCGATES: a rapid and powerful gene-based association test using extended Simes procedureAm J Hum Genet201188328329321397060