
Abstract
One area of great importance in breast cancer (BC) research is the study of gene expression regulated by both estrogenic and antiestrogenic agents. Although many studies have been performed in this area, most of them have only addressed the effects of 17β-estradiol (E2) and tamoxifen (TAM) on MCF7 cells. This study aimed to determine the effect of low doses of E2 and TAM on the expression levels of 84 key genes, which are commonly involved in breast carcinogenesis, in four BC cell lines differentially expressing estrogen receptor (ER) α and HER2 (MCF7, T47D, BT474, and SKBR3). The results allowed us to determine the expression patterns modulated by E2 and TAM in ERα+ and ERα− cell lines, as well as to identify differences in expression patterns. Although the MCF7 cell line is the most frequently used model to determine gene expression profiles in response to E2 and TAM, the changes in gene expression patterns identified in ERα+ and ERα− cell lines could reflect distinctive properties of these cells. Our results could provide important markers to be validated in BC patient samples, and subsequently used for predicting the outcome in ERα+ and ERα− tumors after TAM or hormonal therapy. Considering that BC is a molecularly heterogeneous disease, it is important to understand how well, and which cell lines, best model that diversity.
Introduction
Breast cancer (BC) is the most common cancer in women,Citation1 which has been associated with high exposure to 17β-estradiol (E2). E2 is the main estrogenic hormone, playing an important regulatory role in biological processes such as mammary epithelial cell proliferation and breast development during sexual maturity.Citation2 The pleiotropic effects of E2 on its target tissues are mediated via its receptors, estrogen receptor (ER) α and β, which are members of the nuclear receptor superfamily of ligand-activated transcription factors.Citation3 E2 induces well-established mechanisms to either activate or suppress transcription of its target genes, such as direct interaction with DNA at estrogen response elements,Citation4 through transcription factor cross talk,Citation5 and non-genomic mechanisms whereby E2 binds to ERs localized in the cell membrane and activates signal transduction pathways.Citation6
The ability of ERs to regulate transcription is also dependent on the nature of their ligands with various natural and synthetic selective ER modulators acting as either ER agonists or ER antagonists.Citation7,Citation8 One of them is tamoxifen (TAM), a well-known nonsteroidal antiestrogen with partial agonistic activity, which is extensively used in the treatment of ERα+ BC. Although ERα positivity is a well-established predictor of responses to TAM with ERα− patients considered as nonresponders, it is known that 5–10% of ERα− tumors benefit from adjuvant TAM treatment.Citation9–Citation11 However, responses to TAM have frequently limited durations due to the development of resistance.Citation12,Citation13
The MCF7 BC cell line is one of the most widely used models to study estrogen signaling, because the cells express high levels of ERα and their growth is strongly stimulated by E2 in vitro and in xenografts models.Citation14,Citation15 Considering these aspects, several studies have evaluated gene expression profiles, which focused on identifying changes in gene expression associated with BC prognoses,Citation16–Citation19 drug resistance,Citation20 or tumor aggressiveness.Citation21 Nonetheless, relatively few studies have evaluated gene expression profiles in other ERα+ (T47D and BT474) or ERα− (SKBR3) BC cell lines. Similarly, the number of studies that have evaluated the effect of TAM on the gene expression profiles in these cell lines is limited.
Considering that different cell lines with similar immunophenotypes are used in basic and clinical BC research, identification and comparison of genes and genetic pathways responsive to E2 and TAM are necessary to understand the complex effects of these agents on BC cells. This study aimed to determine the effects of low doses of E2 and TAM (0.01 and 1 µM, respectively) on the expression levels of 84 key genes, which are commonly involved in the regulation of signal transduction and other biological processes related to breast carcinogenesis in ERα+ (MCF7, T47D, and BT474) and ERα− (SKBR3) BC cell lines.
The expression patterns of E2- and TAM-regulated genes identified in ERα+ and ERα− cell lines allowed the identification of variations in gene responses to E2 and suggested genes that might serve as markers of sensitivity and/or resistance to TAM. We found that the expression patterns of some of the genes evaluated in this study clearly discriminate ERα+ and ERα− BC cell lines.
Materials and methods
Cell culture
Human BC cell lines MCF7 (ERα+/HER2−), T47D (ERα+/HER2−), BT474 (ERα+/HER2+), and SKBR3 (ERα−/HER2+) were obtained from the American Type Culture Collection (Manassas, VA, USA). MCF7, T47D, and SKBR3 cells were cultured in RPMI 1640 medium (Sigma, St. Louis, MO, USA), whereas BT474 cells were cultured in Dulbecco’s modified Eagle’s medium (Sigma). All culture media were supplemented with 10% fetal bovine serum (FBS) (Sigma), antibiotic–antimycotic solution (1X) (Sigma), and 2 mM l-glutamine (Thermo Fisher Scientific, Waltham, MA, USA). Cells were maintained at 37°C and 5% CO2. Absence of mycoplasma contamination was verified by conventional PCR assays.
E2 and TAM treatments
At 48 h prior to the addition of E2 (E2758; Sigma) or TAM (T5648; Sigma), culture media were changed to phenol red-free RPMI 1640 (Sigma) containing 10% charcoal-stripped FBS (Sigma) to remove endogenous serum steroids and eliminate the weak estrogen agonistic activity of phenol red.Citation22 E2 and TAM were dissolved in absolute ethanol, diluted in the medium at 0.01 and 1 µM, respectively, and then applied to cells for 24 and 48 h. Each time course experiment was carried out in triplicate. RNA was extracted in all cases and used for cDNA synthesis and quantitative real-time PCR (qPCR) assays. Cells without treatment were used as controls.
RNA extraction
Cell lines were collected in 1 ml TRIZOL Reagent® (Ambion; Thermo Fisher Scientific), and RNA extraction was performed according to the manufacturer’s instructions. Briefly, total RNA was separated by addition of chloroform, followed by precipitation with isopropanol and 75% ethanol. RNA pellets were resuspended in diethyl pyrocarbonate-treated water (Ambion; Thermo Fisher Scientific) and quantified by spectrophotometry using a NanoDrop 1000 spectrophotometer (Thermo Fisher Scientific). RNA was further purified using RNeasy MinElute Cleanup columns (SABiosciences™; Qiagen, Hilden, Germany) and treated with an RNase-Free DNase Set (SABiosciences™; Qiagen) to remove contaminating genomic DNA. Purified RNA samples were stored at −80°C until analysis.
Reverse transcription and qPCR
One microgram of RNA, extracted from cell lines treated with either E2 or TAM for 24 and 48 h, was used to synthesize cDNA with an RT2 First Strand Kit (SABiosciences™; Qiagen) according to the manufacturer’s instructions. The cDNA for each qPCR array test was combined with ready-to-use RT2 SYBR Green qPCR Master Mix (SABiosciences™; Qiagen), and equal aliquots of this mixture (25 µL) were added to each well of a Human Breast Cancer RT2 Profiler™ PCR Array plate (PAHS-131A, SABiosciences™; Qiagen). This PCR array plate contained gene-specific primer sets for 96 genes including 84 genes associated with breast carcinogenesis, five reference genes (B2M, HPRT1, RPL13A, GAPDH, and ACTB), one genomic DNA control, three reverse transcription controls, and three positive PCR controls (). cDNA was amplified using an iCycler® Real-Time PCR System (Bio-Rad Laboratories, Hercules, CA, USA) for 40 cycles (95°C for 15 s and 60°C for 1 min). The threshold cycle (Ct) values were used to calculate the fold changes (FCs) in gene expression (treated cells vs controls – untreated cells) using the PCR array data analysis software (SABiosciences™; Qiagen), which was based on the 2−ΔΔCt method. Gene expression was classified as significantly regulated by E2 or TAM treatments when the FC in expression was at least ±2. qPCR experiments were carried out in three biological replicates, and from each biological replicate, two technical replicates were also performed. The results shown are the average of all the experiments performed.
Table 1 Array layout of genes in the Human Breast Cancer RT2 Profiler™ PCR Array plate (PAHS-131A, SABiosciences™)
Heatmaps of differentially expressed genes (DEGs)
Significant (P<0.05) DEGs (FC: ±2) were selected to graphically evaluate the activation or inhibition of gene expression in each treated cell line. Genes were clustering using the gplots package from the Bioconductor project.Citation23 Euclidean distance was used to calculate the matrix of distances, and clusters were generated using Ward’s method.
Biological interpretation of the DEGs (pathway analysis)
Pathway enrichment analysis was conducted by over-representation analysis (ORA). ORA was performed in DAVID Bioinformatics Resources 6.7 of the National Institute of Allergy and Infectious Diseases (National Institutes of Health, Rockville, MD, USA)Citation24 by employing a pre-filtered list of DEGs. Overrepresented pathways were generated based on the information in the Gene Ontology (GO) project compared with a background limited to the genes analyzed in this study (84 genes). Fisher’s exact test was performed to determine the likelihood of obtaining at least equivalent numbers of genes by an actual overlap between the input gene set and the genes in each identified GO category.
Overall representation of the data
To obtain a simultaneously general representation of the gene expression response of the variously treated cell lines, principal component analysis (PCA) was performed with FCs of all evaluated genes. Because the FC is a ratio of the expression level with a specific treatment and the expression level without treatment, a reference time point for all experimental groups was created (control time 0, FC=1 for all genes). PCA is a linear projection method and an unsupervised exploratory technique used to remove noise, reduce dimensionality, and identify common/dominant signals oriented to find biological meaning. The two principal components (PCs) with the highest degree of variance were plotted. PCA was performed with the prcomp package, and the plot was drawn with gplots, both from the Bioconductor project.Citation23
To identify the main genes responsible for the different PC segments, we used the pcaGoPromoter packageCitation25 implemented in R and part of the Bioconductor project. This methodology allows identification of the loading genes in each PC. Additionally, it quantifies the importance of the genes in the reduced predictor. Hansen et alCitation25 empirically showed that between 0.5 and 8.5% of the total genes is the window to perform the selection of loading genes for good and stable ORA. In this study, a 5% threshold was selected (five genes).
Statistical analysis
Student’s t-test was performed to determine significant differences in FC values between groups (treated and untreated cells). P-values of <0.05 (*) and 0.01 (**) were considered as statistically significant. All tables and graphs show the mean values of three independent experiments.
Results
Gene expression patterns in BC cell lines treated with E2
In MCF7 cells, 19 out of 84 analyzed genes were regulated by E2 at 24 and/or 48 h (22.6%). Among these genes, 47.4% (n=9) were induced and 52.6% (n=10) were suppressed ( and ). These modulated genes were assigned to one of three patterns: genes regulated at 24 h only (early expression; 15.8%), genes regulated at 24 and 48 h (early and late expression; 68.4%), and genes regulated at 48 h only (late expression; 15.8%). Cluster analysis demonstrated two patterns of modulated gene expression at both time points: upregulated (first cluster) and downregulated (second cluster) (). Among the 19 genes regulated by E2 in MCF7 cells, BIRC5, NME1, BRCA1, BRCA2, EGF, HPRT1, MKI67, PGR, and TFF3 were upregulated significantly (P<0.05), while CCND2, IGFBP3, RARB, SLIT2, NR3C1, and CDKN1A genes were downregulated significantly ().
Figure 1 Cluster analysis of the time course of E2-regulated gene expression in (A) MCF7, (B) T47D, (C) BT474, and (D) SKBR3 cells. Gene cluster analysis was performed for 84 genes after E2 exposure at 24 and 48 h. The threshold cycle (Ct) values were used to calculate the FCs in gene expression (treated cells vs controls – untreated cells) using the PCR array data analysis software (SABiosciences™), which was based on the 2−ΔΔCt method. Significant differentially expressed genes (FC=±2; P<0.05) were selected to graphically evaluate the activation or inhibition of gene expression in each treated cell line. Induced genes are shown in red, suppressed genes in green, and unregulated genes in black.
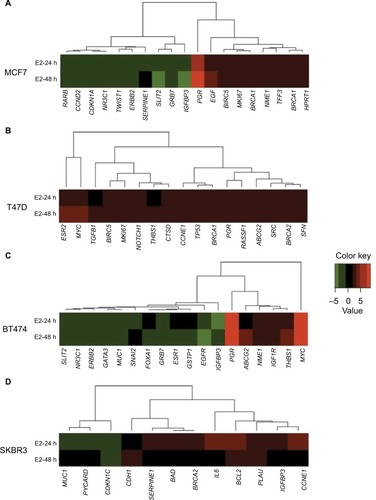
Table 2 List of E2-regulated genes in MCF7, T47D, BT474, and SKBR3 cells
In T47D cells, expressions of 17 out of the 84 analyzed genes were modulated at 24 and/or 48 h (20.2%). In contrast to MCF7 cells, all E2-regulated genes were upregulated ( and ). Among these genes, four (23.5%) showed early expression, six (35.3%) showed early and late expression, and seven (41.25%) showed late expression. Cluster analysis demonstrated three patterns of modulated gene expression with the first cluster including genes with early and late expression, the second cluster including genes regulated at both 24 and 48 h, and the third cluster corresponding to genes mostly regulated at 48 h (). Significantly altered expression (P<0.05) was observed in 10 (BRCA1, CCNE1, PGR, BIRC5, MYC, BRCA2, ESR2, MKI67, TGFB1, and THBS1) out of 17 genes (58.8%) upregulated by E2 in T47D cells ().
In BT474 cells, 18 out of the 84 analyzed genes (21.4%) were regulated by E2 at 24 and/or 48 h. Six (33.3%) were induced, while 12 (66.6%) were suppressed ( and ). Among these genes, two (11.11%) showed early expression, nine (50%) showed early and late expression, and seven (38.88%) showed late expression. Similar to MCF7 cells, cluster analysis demonstrated two patterns of modulated gene expression with the first cluster including upregulated genes and the second cluster including downregulated genes at both examined time points (). However, it is important to note that, in contrast to MCF7 cells, most genes (six out of seven) were suppressed at 48 h (late expression). Twelve genes were regulated significantly (P<0.05) by E2 in BT474 cells: NME1, THBS1, IGF1R, MYC, PGR, and ABCG2 were upregulated, while SNAI2, EGFR, MUC1, GRB7, GSTP1, and NR3C1 were downregulated ().
In SKBR3 (ERα−) cells, E2 treatment resulted in the lowest number of modulated genes, 12 out of 84 (14.3%). Among them, nine (75%) were induced and three (25%) were suppressed ( and ). In contrast to the other cell lines, most genes (nine) underwent early regulation at 24 h only. Cluster analysis demonstrated three patterns of modulated gene expression: upregulated genes (FC: >3) with an early response, upregulated genes (FC: <3) with an early response, and downregulated genes with an early response (). Among the 12 genes regulated by E2, six were significantly upregulated (BRCA2, CCNE1, IL6, PLAU, BCL2, and CDH1), while the significantly downregulated genes included MUC1 and CDKN1C ().
Gene expression patterns in BC cell lines treated with TAM
The number of TAM-regulated genes was lower compared with the E2 response in all cell lines. In MCF7 cells, five out of 84 analyzed genes (5.95%) changed their pattern of expression at 24 and/or 48 h: two of them were induced, while 3 were suppressed ( and ). Only in MCF7 cells, at least one gene was seen in each of the three patterns: three genes showed early expression, one gene showed early and late expression, and one gene showed late expression. Only PGR and EGF (40%) showed significant increases in expression (P<0.05).
Figure 2 Cluster analysis of the time course of TAM-regulated gene expression in (A) MCF7, (B) T47D, (C) BT474, and (D) SKBR3 cells. Gene cluster analysis was performed for 84 genes after TAM exposure at 24 and 48 h. The threshold cycle (Ct) values were used to calculate the FCs in gene expression (treated cells vs controls – untreated cells) using the PCR array data analysis software (SABiosciences™), which was based on the 2−ΔΔCt method. Significant differentially expressed genes (FC=±2; P<0.05) were selected to graphically evaluate the activation or inhibition of gene expression in each treated cell line. Induced genes are shown in red, suppressed genes in green, and unregulated genes in black.
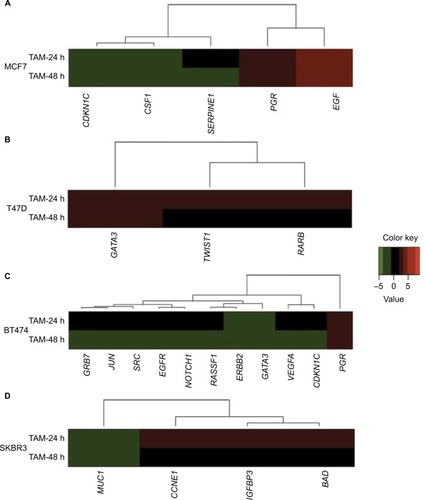
Table 3 List of genes up- or downregulated (negative values) by TAM in MCF7, T47D, BT474, and SKBR3 cells
Conversely, T47D was a cell line in which a smaller effect was seen after TAM addition. Only three out of the 84 analyzed genes were regulated (3.6%), and all of them were upregulated only at 24 h ( and ). None of these three genes showed statistically significant differences in expression.
BT474 was the cell line in which TAM showed a higher effect; 11 out of 84 analyzed genes were regulated (13.1%): one gene (9.1%) was upregulated, while the other 10 genes (90.9%) were suppressed ( and ). In addition, the expression of all of these genes was modified only at later time point (48 h). Among these genes, four (36.3%) showed statistically significant altered expression: three were downregulated (EGFR, JUN, and VEGFA), and one (PGR) was upregulated.
Finally, TAM effects on SKBR3 cells were slight, modulating four out of the 84 analyzed genes (4.8%) at 24 h (early expression): three of them were upregulated and one gene was downregulated ( and ). Only the MUC1 gene showed statistically significant downregulation relative to the control.
Pathway analysis of E2-regulated genes
To further evaluate data at the biological level, pathway analysis was conducted by ORA. lists biological pathways overrepresented after E2 addition with pathways in which the expression levels of significantly modulated genes were changed with respect to those that would be expected to change by chance.
Table 4 List of biological pathways overrepresented by up- or downregulated genes in MCF7, T47D, BT474, and SKBR3 cells after E2 treatments
In MCF7 cells, E2 stimulated the expression of genes associated with the cell cycle process and DNA replication (BRCA2, BIRC5, EGF, and BRCA1). The BIRC5 gene encoding survivin is a member of the inhibitor of apoptosis gene family that encodes negative regulatory proteins that prevent apoptotic cell death. Amplification of this gene has been reported in 15–30% of BCs, and it has been shown to predict the distant recurrence.Citation26 Similarly, overexpression of BRCA1 and BRCA2 genes can cause an aberrant response to DNA damage. Thus, upregulation of these genes probably leads to an overall increase in both proliferation and cell survival. Conversely, addition of E2 to MCF7 cells suppressed genes involved in regulation of cell development (IGFBP3 and SLIT2), and apoptosis activation and cell death (CDKN1A, MMP9, RARB, NR3C1, and IGFBP3). The IGFBP3 gene has antiproliferative effects on cancer. It is involved in the repair of DNA damage in BC cellsCitation27 and controls cell growth by feedback.Citation28 In addition, deregulation or loss of IGFBP3 gene expression has been associated with other carcinomas,Citation29 whereas the SLIT2 gene possesses a suppressive activity against cancer metastasis.Citation30 Deregulation of genes implicated in apoptosis activation and cell death might be related to the increased cell proliferation observed in these cells and could favor tumor development.
In T47D cells, there were several genes upregulated by E2 with known relevant oncogenic functions. Here, we could observe differences in pathway activation according to treatment time points. Thus, at 24 h, E2 activated genes related to signaling pathways of steroid hormones and regulation of transcription (PGR, CCNE1, BRCA2, ESR2, MYC, and BRCA1), while at 48 h, E2 activated genes related to regulation of the cell cycle process and response to abiotic stimulus (MKI67, BRCA2, BIRC5, THBS1, MYC, and TGFB1) ().
Genes preferentially upregulated by E2 in BT474 cells encode proteins with diverse roles in multiple functional pathways including positive regulation of molecular functions (NME1, THBS1, and MYC) and antiapoptosis (IGF1R, THBS1, and MYC) (). NME1 is involved in cell proliferation and differentiation, and its high expression has been associated with sporadic colorectal cancer.Citation31 The THBS1 gene encodes a glycoprotein that mediates cell-to-cell and cell-to-matrix interactions, and has been shown to play roles in the promotion of angiogenesis and metastasis of invasive ductal BC.Citation32 The MYC gene encodes a protein that promotes cell cycle progression, apoptosis, and cellular transformation. Mutations, overexpression, rearrangement, and translocation of this gene have been observed in various tumors.Citation33 Elevated expression levels of the IGF1R gene have been associated with poor survival of patients with invasive BCCitation34 and TAM resistance in xenograft models.Citation35
In SKBR3 cells, E2 caused upregulation of genes associated with growth (CCNE1, BRCA2, and PLAU) and responses to toxins (BCL2 and CDH1). These signaling pathways are involved in positive regulation of cell migration, proliferation, and apoptosis, and all of them correlate with carcinogenesis. Of note, BCL2 is one of the most important antiapoptotic genes and widely related to survival of tumor cells. CCNE1 is an important regulator of cell cycle progression, and its overexpression has been associated with poor overall survival and BC-specific survival.Citation36PLAU encodes a serine protease involved in degradation of the extracellular matrix and possibly tumor cell migration and proliferation.Citation37
Notably, in BT474 and SKBR3 cells, genes downregulated by E2 were not found to be significantly associated with any particular signaling pathway. The number of significantly modulated genes by TAM was insufficient to establish any association with a particular signaling pathway in any of the studied cell lines.
Overall representation of the data (PCA)
For a simultaneously general representation of the gene expression response in treated cell lines, PCA was performed (). After 24 and 48 h of E2 treatment, MCF7 and BT474 cells had the most diverse conditions, differing in the direction of the positive and negative parts of PC1 compared with the control (time 0). Interestingly, the E2 response was also different in BT474 and MCF7 cells according to the position in PC2 (positive and negative parts). TAM-treated cells had a lesser difference compared with the control (time 0). The largest response after TAM treatment for 24 and 48 h was found in MCF7 cells. However, significant differences were not observed between cell lines. In general, T47D and SKBR3 cell lines had a lesser response in all experimental conditions ().
Figure 3 PCA of MCF7, T47D, BT474, and SKBR3 cells after E2 and TAM treatments. PCA was performed for all evaluated genes (84 genes) compared with time 0. Thus grouped, after 24 and 48 h of E2 treatment, MCF7 and BT474 cells showed most diverse conditions compared with the control (time 0) and also between them, differing in the direction of the PC1 and PC2, respectively, while after TAM treatment, the cells had a lesser difference compared with the control (time 0). The largest response after TAM treatment for 24 and 48 h was found in MCF7 cells. Each cell line is represented by a different color, and each treatment performed is represented by a different geometric figure.
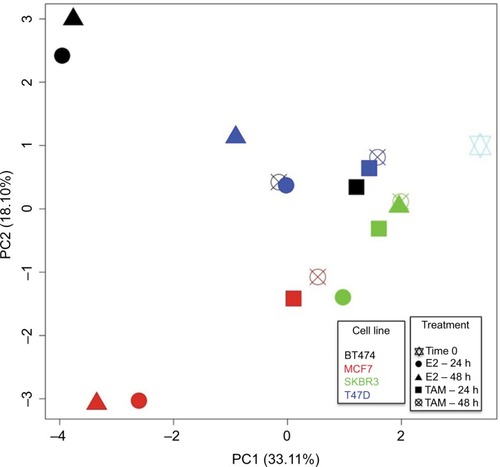
The pcaGoPromoter packageCitation25 was used to identify genes responsible for the differences (loading genes) in each PC (). PC1 positive describes the lesser response to TAM in most treated cell lines and E2 response in SKBR3 and T47D cells. The top five genes involved in the positive part were CCNE1, BCL2, BAD, PTGS2, and GLI1. PC1 negative and PC2 positive describe the common E2 response in MCF7 and BT474 cells in which the top five genes involved were PGR, MYC, IGFBP3, THBS1, and EGFR. However, the specific E2 response in BT474 cells could be explained by the positive part of PC2, in which the top five genes involved were MYC, IGF1R, THBS1, EGFR, and MUC1 (FC: ±2 and P<0.05; ). Conversely, the specific E2 response in MCF7 cells was explained by the negative part of PC2, in which the top five genes involved were EGF, CSF1, BRCA2, CDKN1C, and IGFBP3 (FC: ±2 and P<0.05; ).
Discussion
One area of great importance in BC research is the study of gene expression regulated by both estrogenic and antiestrogenic agents. Although many studies have been performed in this area, most of them have only examined the effects of E2 and TAM on MCF7 cells.Citation14,Citation38–Citation41 In the present study, we analyzed changes in gene expression in not only MCF7 cells but also other ERα+ and ERα− cell lines (T47D, BT474, and SKBR3) for 84 genes related to BC development. This allowed us to determine the expression patterns modulated by E2 and TAM in these cells and perform comparisons between other cell lines and MCF7 cells.
After E2 treatment, several patterns of regulation were apparent: while in MCF7 the number of upregulated and downregulated genes was similar, the majority of them were upregulated in T47D cells, and downregulated in SKBR3 and BT474 cells. After E2 addition to MCF7 cells, we obtained similar results to those reported previously in other studies.Citation39 Interestingly, genes such as EGF, RARB, CCND2, IGFBP3, SLIT2, and HPRT1 were significantly regulated only in this cell line, not only indicating specific signal pathway activation but also revealing that HPRT1 would not be useful as a reference/housekeeping gene at least in MCF7 cells. The BIRC5 gene was upregulated in both MCF7 and T47D cells, which confirmed that hormonal regulation of survivin mediated some of the effects of E2 on programmed cell death in ERα+ BC cells.Citation42,Citation43 Other genes that were upregulated in MCF7 and T47D cells after E2 treatment were MKI67, BRCA1, BRCA2, and PGR, which suggest increased cell responses to genomic damage.Citation39
Although T47D and MCF7 cells are immunohistochemically similar (ERα+/HER2−), we observed differences in regulation of genes such as c-MYC, TGFB1, and THSB1. Nevertheless, although the c-MYC gene has been reported to be upregulated by E2 in MCF7 cells,Citation44 we did not find statistically significant changes in its expression. Conversely, such changes were markedly observed in T47D and BT474 cells.
Similar to MCF7 cells, the BT474 cell line (ERα+/HER2+) showed a larger number of changes in gene expression after E2 treatment, and the number of suppressed genes was greater than that of upregulated genes. In addition to the highest upregulation of c-MYC and PGR genes after E2 treatment, BT474 cells showed specific and important regulation of genes such as THBS1, EGFR, IGF1R, and MUC1. Interestingly, genes associated with the HER2 signaling pathway (IGFBP3, PGR, SLIT2, ERBB2, GRB7, and NR3C1) exhibited the same trend in both MCF7 and BT474 cells, although not significant in all cases, indicating a similar response mediated by ER independently of the HER2 status.
SKBR3 cells (ERα−/HER2+) were clearly different from MCF7 cells, because only the BRCA2 gene showed a similar expression pattern after E2 treatment. Interestingly, activation of antiapoptotic BCL2 was specific for SKBR3 cells, and such regulation has been reported as a direct target of transcriptional regulation by ER in MCF7 cells.Citation45 Although we did not find regulation of BCL2 in MCF7 cells, these observations strongly support the notion that ERα is not always required for E2 regulation and provide evidence that E2 activates other signaling pathways not associated with ERα. In SKBR3 cells, genes such as IL6, PLAU, and CDKN1C also showed specific and important regulation in at least one of the E2 experimental conditions.
Results from pathway analysis suggested that the gene expression program activated by E2 reflects more than a simple mitogenic response to this hormone in all cell lines. Accordingly, many of the E2-regulated genes were involved in cellular functions other than cell cycle control, such as cell development changes (SLIT2 and IGFBP3) and cell survival (BIRC5).Citation14,Citation43,Citation46 Although the immunohistochemical status allows supposing a similar response to E2 in ERα+ BC cell lines (MCF7, T47D, and BT474), PCA showed how ERα+ cells behave differently, not only with respect to ERα− cells (SKBR3) but also between them. Accordingly, MCF7 cells exhibited an important activation of DNA replication through genes such as EGF and BRCA2, whereas in BT474 cells, mainly antiapoptotic mechanisms were activated through MYC, IGF1R, and THSB1 genes.
Even if PCA confirmed that gene expression changes after TAM treatment were not significant to differentiate BC cell lines, a smaller effect was observed and some genes displayed similar expression patterns to those seen after E2 treatment. In three of the tested cell lines, both E2 and TAM modulated the expression of PGR and EGF in MCF7 and BT474 cells, and MUC1 in SKBR3 cells. Our results suggest similarities between signaling pathways activated by E2 and TAM. These similarities could be associated with “non-genomic” actions of E2 in target cells, leading to direct hormonal regulation of multiple cytoplasmic signal transductions, as suggested previously.Citation47–Citation51
Our results are relevant, because many studies have reported that resistance to TAM may be due to its substantial E2 agonist effect in ERα+/HER2+ cells.Citation48,Citation49,Citation51–Citation53 Similarly, our data indicate that TAM could perform this E2 agonist role in not only ERα+/HER2+ (BT474) cells but also both ERα+/HER2− (MCF7) and ERα−/HER2+ (SKBR3) cells, according to the cellular response (gene expression pattern) triggered by this drug. In fact, recently it has been indicated that in BC patients, the balance between agonist and antagonist properties of TAM differs among cell types, supporting our observations.Citation54
Also, it is important to consider that the effects of E2 and TAM on these cells could be explained by genetic heterogeneity among BC cells and also differences in ERα amount. In fact, it has been reported that T47D cells have low levels of ERα compared with MCF7 cells.Citation55 Additionally, it is necessary to note that other ER forms, such as G protein-coupled estrogen receptor (GPER) and ERβ, might also be involved in the effects observed after treatments. GPER, an estrogen transmembrane receptor, which modulates both rapid non-genomic and genomic transcriptional events of estrogens, has been observed in ERα+ cells (MCF7 and T47D).Citation56 In addition, recent emerging evidence demonstrated that GPER could be a potential transducer of E2 in SKBR3 cells.Citation57 Thus, the presence of this receptor could also explain the modulation of gene expression induced by E2 and TAM in all cell lines analyzed. In fact, GPER has been involved in drug resistance, which often occurs during cancer treatments.Citation58 Otherwise, considering that in human BC cell lines the expression of endogenous ERβ has not been clearly described,Citation59 it could be suggested that the modulation of gene expression in ERα+ and ERα− cells could be attributed to both ERα and GPER. However, further functional studies are needed to determine if the observed gene expression changes were modulated by ERα, GPER, or both.
Concurrent with our work, some studies identified genes associated with TAM resistance in ERα+ BC patients. Interestingly, some of these genes were found modified by TAM in our study, which supports our approach. One of these studies found a low expression of CDKN1A after TAM treatment,Citation20 as found by us in MCF7 cells. CDKN1A encodes the protein p21WAF1/CIP1; this protein has been reported to be absent in a clinical case of TAM-stimulated growth.Citation60 p21WAF1/CIP1 interacts with several cell cycle regulators, but the precise mechanism behind its role in TAM resistance is unclear. Additional studies showed significantly lower expression of CDKN1C gene in BC patients treated with adjuvant therapy (TAM)Citation61 and a high expression of PGR gene in TAM-treated patients.Citation62 Similar results were observed by us in ERα+ cell lines (MCF7 and BT474) after TAM addition. CDKN1C is a tumor suppressor gene that regulates cell proliferation and has recently been found to be downregulated in metastatic tumors. PGR gene encodes a protein that mediates the physiological effects of progesterone, which plays a central role in reproductive events associated with the establishment and maintenance of pregnancy. Interestingly, this gene has recently been considered as one of the most promising prognostic biomarkers in TAM-treated patients.Citation62
Taking all together, our results could provide important markers to be validated in BC patient samples, and subsequently used for predicting the outcome in ERα+ and ERα− tumors after TAM or hormonal therapy. Exploring novel markers for TAM therapy will be helpful for the treatment of BC.
Conclusion
Although the MCF7 cell line is the most frequently used model to determine gene expression profiles in response to treatments with E2 and TAM, the changes in gene expression patterns identified in ERα+ and ERα− cell lines could reflect distinctive properties of these cells, which could be exploited not only to identify the response of various cell types to E2 but also to examine whether these genes might serve as markers of TAM sensitivity and/or participate in the development of TAM resistance. Indeed, we have shown that the expression patterns of some genes can be used to discriminate between ERα+ cells, and between ERα+ and ERα− cells.
Author contributions
Milena Rondón-Lagos and Nelson Rangel conceived and designed the study, and wrote the manuscript. Victoria E Villegas contributed to writing of the manuscript and made critical revisions. All authors contributed toward data analysis, drafting and critically revising the paper and agree to be accountable for all aspects of the work.
Disclosure
The authors report no conflicts of interest in this work.
Acknowledgments
Nelson Rangel is supported by a Colciencias Grant (call 617, Colombia). The authors acknowledge the scientific support provided by Professor Anna Sapino. César Payán-Gómez is acknowledged for bioinformatic analyses. The authors thank Mitchell Arico from Edanz Group (www.edanzediting.com/ac) for editing the draft of this manuscript.
References
- FerlayJSoerjomataramIErvikMGLOBOCAN 2012 v1.0, cancer incidence and mortality worldwide: IARC cancer base no. 11 [Internet]LyonIARC2013 Available from: http://globocan.iarc.frAccessed February 20, 2017
- PlatetNCathiardAMGleizesMGarciaMEstrogens and their receptors in breast cancer progression: a dual role in cancer proliferation and invasionCrit Rev Oncol Hematol2004511556715207254
- HallJMCouseJFKorachKSThe multifaceted mechanisms of estradiol and estrogen receptor signalingJ Biol Chem200127640368693687211459850
- KatzenellenbogenBSKatzenellenbogenJAEstrogen receptor transcription and transactivation: estrogen receptor alpha and estrogen receptor beta: regulation by selective estrogen receptor modulators and importance in breast cancerBreast Cancer Res20002533534411250726
- KalaitzidisDGilmoreTDTranscription factor cross-talk: the estrogen receptor and NF-kappaBTrends Endocrinol Metab2005162465215734144
- SommerSFuquaSAEstrogen receptor and breast cancerSemin Cancer Biol200111533935211562176
- KatzenellenbogenBSKatzenellenbogenJABiomedicine. Defining the “S” in SERMsScience200229555642380238111923515
- MargeatEBourdoncleAMargueronRPoujolNCavaillèsVRoyerCLigands differentially modulate the protein interactions of the human estrogen receptors alpha and betaJ Mol Biol20033261779212547192
- Tamoxifen for early breast cancer: an overview of the randomised trials. Early Breast Cancer Trialists’ Collaborative GroupLancet19983519114145114679605801
- Gruvberger-SaalSKBendahlPOSaalLHEstrogen receptor beta expression is associated with tamoxifen response in ERalpha-negative breast carcinomaClin Cancer Res20071371987199417404078
- McGuireWLCurrent status of estrogen receptors in human breast cancerCancer1975362638644168960
- PearceSTJordanVCThe biological role of estrogen receptors alpha and beta in cancerCrit Rev Oncol Hematol200450132215094156
- International Breast Cancer Study GroupColleoniMGelberSGoldhirschATamoxifen after adjuvant chemotherapy for premenopausal women with lymph node-positive breast cancer: International Breast Cancer Study Group Trial 13-93J Clin Oncol20062491332134116505417
- FrasorJDanesJMKommBChangKCLyttleCRKatzenellenbogenBSProfiling of estrogen up- and down-regulated gene expression in human breast cancer cells: insights into gene networks and pathways underlying estrogenic control of proliferation and cell phenotypeEndocrinology2003144104562457412959972
- CreightonCJCorderoKELariosJMGenes regulated by estrogen in breast tumor cells in vitro are similarly regulated in vivo in tumor xenografts and human breast tumorsGenome Biol200674R2816606439
- PerouCMSorlieTEisenMBMolecular portraits of human breast tumoursNature2000406679774775210963602
- JiangYHarlockerSLMoleshDADiscovery of differentially expressed genes in human breast cancer using subtracted cDNA libraries and cDNA microarraysOncogene200221142270228211948410
- ColomboPEMilaneziFWeigeltBReis-FilhoJSMicroarrays in the 2010s: the contribution of microarray-based gene expression profiling to breast cancer classification, prognostication and predictionBreast Cancer Res201113321221787441
- Sheen-ChenSMHuangCYChanYCAn evaluation of focal adhesion kinase in breast cancer by tissue microarraysAnticancer Res20133331169117323482798
- LyngMBLaenkholmAVTanQGene expression signatures that predict outcome of tamoxifen-treated estrogen receptor-positive, high-risk, primary breast cancer patients: a DBCG studyPLoS One201381e5407823342080
- ZajchowskiDABartholdiMFGongYIdentification of gene expression profiles that predict the aggressive behavior of breast cancer cellsCancer Res200161135168517811431356
- BerthoisYKatzenellenbogenJAKatzenellenbogenBSPhenol red in tissue culture media is a weak estrogen: implications concerning the study of estrogen-responsive cells in cultureProc Natl Acad Sci U S A1986838249625003458212
- GentlemanRCCareyVJBatesDMBioconductor: open software development for computational biology and bioinformaticsGenome Biol2004510R8015461798
- Huang daWShermanBTLempickiRASystematic and integrative analysis of large gene lists using DAVID bioinformatics resourcesNat Protoc200941445719131956
- HansenMGerdsTANielsenOHSeidelinJBTroelsenJTOlsenJpcaGoPromoter – an R package for biological and regulatory interpretation of principal components in genome-wide gene expression dataPLoS One201272e3239422384239
- DavisLMHarrisCTangLAmplification patterns of three genomic regions predict distant recurrence in breast carcinomaJ Mol Diagn20079332733617591932
- LinMZMarzecKAMartinJLBaxterRCThe role of insulin-like growth factor binding protein-3 in the breast cancer cell response to DNA-damaging agentsOncogene2014331859623178489
- SchedlichLJYensonVMBaxterRCTGF-beta-induced expression of IGFBP-3 regulates IGF1R signaling in human osteosarcoma cellsMol Cell Endocrinol20133771–2566423831640
- YinJDingJHuangLSND1 affects proliferation of hepatocellular carcinoma cell line SMMC-7721 by regulating IGFBP3 expressionAnat Rec (Hoboken)2013296101568157523878061
- ChenWFGaoWDLiQLZhouPHXuMDYaoLQSLIT2 inhibits cell migration in colorectal cancer through the AKT-GSK3beta signaling pathwayInt J Colorectal Dis201328793394023314850
- WuHWGaoLDWeiGHhMSH2 and nm23 expression in sporadic colorectal cancer and its clinical significanceAsian Pac J Cancer Prev20131431995199823679306
- HoriguchiHYamagataSRong QianZKagawaSSakashitaNThrombospondin-1 is highly expressed in desmoplastic components of invasive ductal carcinoma of the breast and associated with lymph node metastasisJ Med Invest2013601–2919623614916
- GinterPSMosqueraJMMacDonaldTYD’AlfonsoTMRubinMAShinSJDiagnostic utility of MYC amplification and anti-MYC immunohistochemistry in atypical vascular lesions, primary or radiation-induced mammary angiosarcomas, and primary angiosarcomas of other sitesHum Pathol201445470971624457083
- LawJHHabibiGHuKPhosphorylated insulin-like growth factor-i/insulin receptor is present in all breast cancer subtypes and is related to poor survivalCancer Res20086824102381024619074892
- MassarwehSOsborneCKCreightonCJTamoxifen resistance in breast tumors is driven by growth factor receptor signaling with repression of classic estrogen receptor genomic functionCancer Res200868382683318245484
- GaoSMaJJLuCPrognostic value of cyclin E expression in breast cancer: a meta-analysisTumour Biol20133463423343023775012
- DingYZhangHZhongMClinical significance of the uPA system in gastric cancer with peritoneal metastasisEur J Med Res20131812823985164
- BourasTSoutheyMCChangACStanniocalcin 2 is an estrogen-responsive gene coexpressed with the estrogen receptor in human breast cancerCancer Res20026251289129511888893
- BourdeauVDeschênesJLaperrièreDAidMWhiteJHMaderSMechanisms of primary and secondary estrogen target gene regulation in breast cancer cellsNucleic Acids Res2008361769317986456
- GadalFStarzecABozicCIntegrative analysis of gene expression patterns predicts specific modulations of defined cell functions by estrogen and tamoxifen in MCF7 breast cancer cellsJ Mol Endocrinol2005341617515691878
- SadlerAJPugazhendhiDDarbrePDUse of global gene expression patterns in mechanistic studies of oestrogen action in MCF7 human breast cancer cellsJ Steroid Biochem Mol Biol20091141–2213219167489
- ChoiKSLeeTHJungMHRibozyme-mediated cleavage of the human survivin mRNA and inhibition of antiapoptotic function of survivin in MCF-7 cellsCancer Gene Ther2003102879512536196
- ButerinTKochCNaegeliHConvergent transcriptional profiles induced by endogenous estrogen and distinct xenoestrogens in breast cancer cellsCarcinogenesis20062781567157816474171
- LinZReierstadSHuangCCBulunSENovel estrogen receptor-alpha binding sites and estradiol target genes identified by chromatin immunoprecipitation cloning in breast cancerCancer Res200767105017502417510434
- PerilloBSassoAAbbondanzaCPalumboG17beta-estradiol inhibits apoptosis in MCF-7 cells, inducing bcl-2 expression via two estrogen-responsive elements present in the coding sequenceMol Cell Biol20002082890290110733592
- ChenXDuanNZhangCZhangWSurvivin and tumorigenesis: molecular mechanisms and therapeutic strategiesJ Cancer20167331432326918045
- SrinivasanSNawazZMolecular biology of estrogen receptor actionPfaffDWArnoldAPFahrbachSEEtgenAMRubinRTHormones Brain and Behavior2nd edSan Diego, CAAcademic Press200911871220
- ChangMDual roles of estrogen metabolism in mammary carcinogenesisBMB Rep201144742343421777512
- PietrasRJMárquez-GarbánDCMembrane-associated estrogen receptor signaling pathways in human cancersClin Cancer Res200713164672467617699844
- SongRXFanPYueWChenYSantenRJRole of receptor complexes in the extranuclear actions of estrogen receptor alpha in breast cancerEndocr Relat Cancer200613Suppl 1S3S1317259556
- KumarRZakharovMNKhanSHThe dynamic structure of the estrogen receptorJ Amino Acids2011201181254022312471
- DrurySCDetreSLearyAChanges in breast cancer biomarkers in the IGF1R/PI3K pathway in recurrent breast cancer after tamoxifen treatmentEndocr Relat Cancer201118556557721734071
- ShouJMassarwehSOsborneCKMechanisms of tamoxifen resistance: increased estrogen receptor-HER2/neu cross-talk in ER/HER2-positive breast cancerJ Natl Cancer Inst2004961292693515199112
- ChanrionMNegreVFontaineHA gene expression signature that can predict the recurrence of tamoxifen-treated primary breast cancerClin Cancer Res20081461744175218347175
- ReadLDKeithDJrSlamonDJKatzenellenbogenBSHormonal modulation of HER-2/neu protooncogene messenger ribonucleic acid and p185 protein expression in human breast cancer cell linesCancer Res19905013394739511972345
- SamartzisEPNoskeAMeiselAVargaZFinkDImeschPThe G protein-coupled estrogen receptor (GPER) is expressed in two different subcellular localizations reflecting distinct tumor properties in breast cancerPLoS One201491e8329624421881
- ThomasPPangYFilardoEJDongJIdentity of an estrogen membrane receptor coupled to a G protein in human breast cancer cellsEndocrinology2005146262463215539556
- PapaACarusoDTomaoSRossiLZaccarelliETomaoFTriple-negative breast cancer: investigating potential molecular therapeutic targetExpert Opin Ther Targets2015191557525307277
- HaldosénLAZhaoCDahlman-WrightKEstrogen receptor beta in breast cancerMol Cell Endocrinol2014382166567223954741
- AbukhdeirAMVitoloMIArganiPTamoxifen-stimulated growth of breast cancer due to p21 lossProc Natl Acad Sci U S A2008105128829318162533
- PawitanYBjöhleJAmlerLGene expression profiling spares early breast cancer patients from adjuvant therapy: derived and validated in two population-based cohortsBreast Cancer Res200576R953R96416280042
- MihályZKormosMLánczkyAA meta-analysis of gene expression-based biomarkers predicting outcome after tamoxifen treatment in breast cancerBreast Cancer Res Treat2013140221923223836010