Abstract
Reliable early assessment of breast cancer response to neoadjuvant therapy (NAT) would provide considerable benefit to patient care and ongoing research efforts, and demand for accurate and noninvasive early-response biomarkers is likely to increase. Response assessment techniques derived from quantitative magnetic resonance imaging (MRI) hold great potential for integration into treatment algorithms and clinical trials. Quantitative MRI techniques already available for assessing breast cancer response to neoadjuvant therapy include lesion size measurement, dynamic contrast-enhanced MRI, diffusion-weighted MRI, and proton magnetic resonance spectroscopy. Emerging yet promising techniques include magnetization transfer MRI, chemical exchange saturation transfer MRI, magnetic resonance elastography, and hyperpolarized MR. Translating and incorporating these techniques into the clinical setting will require close attention to statistical validation methods, standardization and reproducibility of technique, and scanning protocol design.
Introduction
Chemotherapy and hormonal therapy for early stage breast cancer can be administered in either the adjuvant (after surgery) or neoadjuvant (before surgery) settings. Potential advantages to neoadjuvant therapy (NAT) include presurgical reduction of tumor burden, which may allow certain patients to undergo breast conservation therapy rather than mastectomy, and earlier treatment of possible occult micrometastatic disease with the primary breast mass acting as a “marker” for treatment effectiveness (as opposed to adjuvant chemotherapy, where no such marker exists for response of systemic micrometastases).Citation1 NAT also allows patients time to undergo genetic testing if there is a suspicion of an underlying BRCA 1/2 mutation, which if found may prompt patients to consider mastectomy rather than lumpectomy. At present, NAT is offered primarily to patients with larger tumors, tumors fixed to the chest wall, or clinically matted lymph nodes or skin involvement. However, current clinical trials are evaluating the use of different NAT regimens in multiple patient groups, including those with smaller tumors,Citation2 and it is anticipated that these studies will lead to increased use of NAT in early stage breast cancer across a broad spectrum of patients.
With more breast cancer patient receiving NAT, more available NAT regimens, and multiple emerging drug agents and combinations requiring evaluation and comparison with existing options, reliable assessment of treatment response has emerged as an important challenge in both the clinical and research environments. Pathologic response has been established as an independent prognostic marker for overall survival in breast cancer and is currently the gold standard for assessing response to NAT,Citation3 but techniques that can provide reliable response assessment earlier in the course of therapy are in high demand, driven by several considerations. First, from a clinical perspective, accurate early response assessment would provide the opportunity to replace an ineffective treatment with an alternative regimen, and in so doing potentially avoid or curtail debilitating side effects or toxicities, such as cardiotoxicity from anthracycline agents or neuropathy from taxanes. Second, patients with disease that is refractory to multiple NAT regimens could be referred directly to surgery, assuming this determination is made early enough that their disease is still surgically resectable. Third, from a research perspective, accurate early response assessment would allow for determination of treatment efficacy on a much shortened timescale, with important ramifications for clinical trial design.
At present, there is no uniform approach to the early assessment of breast cancer response to NAT. Palpation, probably the most widely used technique in the clinical setting, is inaccurate for predicting pathologic responseCitation4,Citation5 and is poorly suited for assessment of small tumors. Serial biopsy is invasive and is associated with sampling problems in heterogeneous tumors. Noninvasive imaging techniques, including mammography, ultrasound, and conventional MRI, are often deployed in the clinical setting as ad hoc problem-solving tools and in the research setting as secondary endpoints, but no imaging-based, early-response biomarker has been suitably validated as sufficiently predictive of long-term outcomes to become incorporated either as standard of care in the clinical setting or as a routine component of all clinical trials. The stage is now set for development of accurate, noninvasive, early-response biomarkers for integration into both the clinical and research environments.
This contribution discusses quantitative magnetic resonance imaging (MRI) as a promising platform from which to develop and deploy these biomarkers. We begin by discussing the motivations for using quantitative MRI for assessing breast cancer response to NAT. We then describe, with illustrative examples, several currently available quantitative MRI methods including lesion size measurement, dynamic contrast-enhanced MRI (DCE-MRI), diffusion-weighted MRI (DW-MRI), and proton magnetic resonance spectroscopy (MRS). Looking a bit further on the horizon, we then discuss magnetization transfer (MT) MRI, chemical exchange saturation transfer (CEST) MRI, MR elastography, and hyperpolarized MR, methods that have been deployed in other disease sites and that may be particularly well suited to breast cancer response assessment. We conclude by addressing certain practical challenges in the clinical translation of quantitative MRI methods.
Rationale behind quantitative MRI methods for response assessment
Cancer imaging is undergoing a paradigm shift in which quantitative answers are increasingly being sought for questions that have historically motivated a qualitative response. The query “is this cancer responding to therapy” has traditionally been answered by clinical imaging based on the subjective impressions of the observer. However, modern cancer research and treatment now requires objective and reproducible response assessment variables with which to evaluate and compare different treatment strategies. For evaluating treatment response, qualitative imaging interpretation is yielding ground to quantitative imaging response parameters that can be integrated with other quantitative clinical datasets for rigorous statistical evaluations.Citation6,Citation7
The current mainstay of objective imaging-based response assessment for solid malignancies is the Response Evaluation Criteria in Solid Tumors (RECIST), a set of published guidelines for image acquisition, lesion evaluation and measurement, and response categorization.Citation8 RECIST has been successful in providing a standardized approach for imaging-based response assessment and facilitating “apples to apples” comparisons of different cancer treatments, but its emphasis on changes in lesion size has been criticized as failing to capture meaningful changes in tumor biology.Citation9,Citation10 In particular, RECIST may underestimate the antitumor efficacy of newer drug agents with cytostatic rather than cytotoxic effect, where tumor shrinkage may be minimal or quite delayed. The future of imaging-based quantitative response assessment will likely involve supplementing traditional size-based techniques with more advanced morphological, functional, physiological, cellular, and molecular imaging methods.
For a variety of reasons, MRI is a very promising platform from which to develop advanced quantitative imaging biomarkers for assessing breast cancer response to NAT. First, MRI is already well established as a clinically useful technique in breast cancer detection and characterization,Citation11 and its use for response assessment would be a natural extension of its current role in clinical care. Second, as an intrinsically digital technique, MRI is capable of generating quantitative datasets for direct entry into statistical analyses, thus bypassing the need for analog-to-digital conversion or subjective user interpretation that can add to measurement variability. Third, MRI is an extraordinarily flexible and powerful modality with the ability to report on multiple structural and functional parameters that may be relevant to lesion response assessment, as detailed in this review.
It is important to note that response assessment is only one of two goals for imaging during NAT, with the other being assessment of residual disease as an adjunct to surgical planning.Citation11–Citation14 While it is tempting to think of these two objectives as one and the same, assessment for residual disease fundamentally seeks to depict anatomy, whereas response assessment seeks to evaluate changes in tumor biology and may do so with a variety of techniques reporting on either anatomical or functional changes. The distinction is especially important for MRI, where certain tradeoffs in how images are acquired (eg, between high temporal and high spatial resolution techniques) may theoretically render one imaging protocol more useful for response assessment and another protocol more useful for demonstrating tiny foci of residual tumor. This review focuses on MRI techniques for response assessment, but we address practical issues of protocol design in a later section on clinical translation.
Currently available quantitative MRI techniques for response assessment
A number of MRI techniques are already available for potential deployment into both clinical and research settings for the assessment of breast cancer response to NAT. These methods include anatomical measurement of lesion size (unidimensional, multidimensional, and volumetric), DCE-MRI, DW-MRI, and MRS. In this section we review the basic theory underlying these techniques (including methods of quantitative analysis), provide examples of relevant clinical and research applications, and discuss opportunities for future development.
Lesion size measurement
Theory
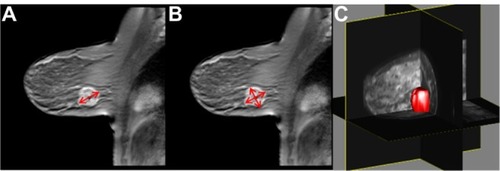
By virtue of its exquisite soft tissue contrast and very high spatial resolution, MRI is an extremely powerful technique for demonstrating the morphology of breast lesions. MRI has therefore been evaluated for assessing breast cancer response to therapy using changes in lesion size as the primary measurement variable. MRI-based evaluation of lesion size relies almost exclusively on “contrast-enhanced” imaging ie, imaging following intravenous injection of a paramagnetic contrast agent (typically a gadolinium chelate) so as to maximize the conspicuity of an enhancing breast lesion against a background of normal breast parenchyma.Citation15 The literature has incorporated unidimensional, bidimensional, and volumetric (ie, three-dimensional) tumor measurements ().
Figure 1 Lesion size measurement by MRI. (A) Unidimensional measurement of tumor long axis diameter. (B) Bidimensional measurement of tumor long and short axis diameters. (C) Three-dimensional measurement of tumor volume.
Applications
Evaluations of MRI-based lesion size measurement in the setting of NAT have focused on two clinical scenarios: (1) evaluation for residual disease at the end of NAT and (2) early assessment of treatment response. With regard to evaluation for residual disease, a significant literature has demonstrated the effectiveness of MRI-based lesion size measurement in predicting results at surgical pathology.Citation5,Citation16–Citation22 Abraham et alCitation19 showed that contrast-enhanced MRI at the end of NAT predicted pathologically determined residual disease in 97 percent of cases, outperforming both physical examination and mammography.Citation19 Balu-Maestro et alCitation23 compared physical examination, mammography, ultrasound, and MRI and found that MRI was the most reliable for evaluating residual tumor size after NAT. Londero et alCitation22 found that MRI after NAT identified residual disease better than mammography and also showed that MRI-measured tumor diameters correlated better with pathologic diameters than either mammography or sonography. Chou et alCitation16 found that tumor volume after NAT (calculated using a segmentation algorithm) was highly correlated with histopathologic estimation of tissue volume.Citation16
With regard to early assessment of treatment response, a number of studies have evaluated the ability of early changes in MRI-based lesion size measurement to predict eventual response.Citation24–Citation26 Martincich et alCitation25 found that a minimum 65 percent reduction in tumor volume after two cycles of NAT was associated with an eventual major histopathological response. Padhani et alCitation27 demonstrated that a decrease in bidimensional tumor area after two cycles of NAT predicted pathological response. Loo et alCitation28 showed that a change in the longest diameter of enhancing tumor predicted pathologic response after two cycles of NAT.Citation28 The recently published ISPY-1 trial showed that volumetric tumor measurement at mid-treatment outperformed clinical assessment in predicting pathologic response.Citation29
Future directions
Although MRI techniques for lesion size measurement are mature and have been shown to predict changes in true lesion size, MRI-based size measurement has not been widely incorporated into the clinical or research settings for NAT response assessment. In the clinical setting, this is probably due to the prevailing opinion that physical examination provides adequate response assessment in the patient population for whom NAT is currently indicated, ie, patients with large tumors. In the research setting, RECIST-based response biomarkers may be incorporated as secondary endpoints, but current trials invariably rely on pathologic response as the primary endpoint for determining antitumor efficacy. The latter remains true despite some preliminary studies correlating MRI-based size measurement changes with long-term outcomes.Citation30
In the future, with the anticipated increased use of NAT in patients with smaller tumors that are poorly assessed by palpation, MRI-based lesion size measurement may become more integrated into clinical algorithms, but there remain several potential problems with lesion size-based response assessment. First, many breast cancers tend to have infiltrative, irregular, and/or multifocal growth, creating problems for reproducible size measurement. Second, as mentioned previously, some new and emerging treatment agents have cytostatic rather than cytotoxic effect and may produce delayed or attenuated lesion shrinkage such that a size-based response assessment methodology may not fully capture relevant changes in tumor biology. Third, when treated, breast cancers can exhibit a variety of different morphological changes including shrinkage from the outside, melting from the inside, and irregular internal (“Swiss cheese”) liquefaction; these different patterns would be poorly assessed by methodologies focusing exclusively on unidimensional, bidimensional, or even volumetric measurement.
The biggest long-term challenge for lesion size measurement-based techniques will therefore probably involve integration with other techniques focused more on assessing functional changes in tumor biology, as described in subsequent sections. Integration of different techniques into a comprehensive, multi-purpose MRI examination may be challenging, and will also be described later.
Dynamic contrast-enhanced MRI (DCE-MRI)
Theory
DCE-MRI involves the rapid, sequential acquisition of T 1-weighted images before and after the injection of a paramagnetic contrast agent.Citation31 As the contrast agent perfuses or diffuses into a voxel or region of interest (ROI), it shortens the native magnetic relaxation times of the tissue as determined by the local concentration of contrast. When the contrast agent leaves the voxel, the relaxation times increase toward their baseline value at a rate determined by local tissue characteristics. Each voxel thus yields a signal intensity time course that can be analyzed to yield estimates of tissue vascularity parameters including perfusion, permeability, and tissue volume fractions.
Both semiquantitative and fully quantitative methods have been developed to perform DCE-MRI analyses. Semiquantitative methods include calculations of the signal enhancement ratio (SER) and the initial area under the enhancement curve (iAUC).Citation32–Citation36 The SER method, used in the ISPY-1 trial, employs the following calculation:
where S 0 represents the signal intensity within the lesion before contrast administration, S 1 represents the signal intensity early after contrast injection, and S 2 represents the late postcontrast signal intensityCitation32 Given a map of SER values, various derivative parameters are accessible including the SER total tumor volume, SER partial tumor volume, SER washout tumor volume, and the peak SER.
Fully quantitative DCE-MRI analysis typically involves the application of various pharmacokinetic equations to model the movement of contrast agent molecules between tissue and blood vessels over time.Citation37 Two main approaches have been deployed in breast cancer: the standard Tofts-Kety (TK) and the extended Tofts-Kety (ETK) models.Citation38 The standard TK model is summarized by:
where Ktrans is the volume transfer constant, ve is the extravascular extracellular volume fraction, Ct(T) is the concentration of contrast in the tissue of interest, and Cp(t) is the concentration of contrast in blood plasma (also known as the arterial input function). The ETK model incorporates the blood plasma volume fraction, vp, as follows:
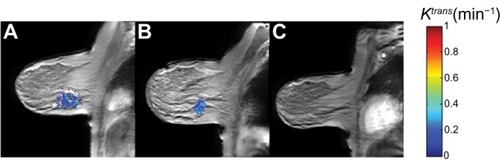
Both the TK and ETK models assume that all water compartments within tissue are well mixed (ie, are at the fast exchange limit of the nuclear magnetic resonance time scale) so that MRI signal change is completely described by a single relaxation rate constant.Citation38 After measurement (or estimation) of Ct(t) and Cp(t) on a voxel or ROI level, EquationEquations 2 and/or Equation3 are used to return estimates of Ktrans, ve, and vp, along with the derived efflux rate constant kep (kep≡ Ktrans/ve). The working hypothesis for fully quantitative DCE-MRI in the setting of NAT is that observed changes in these pharmacokinetic parameters can predict treatment response, as illustrated in . For a more extensive discussion of DCE-MRI methods in oncology, the interested reader is referred to the review by Yankeelov and Gore.Citation31
Figure 2 Fully quantitative DCE-MRI analysis in a breast cancer patient undergoing NAT. (A) Pretreatment DCE-MRI analysis yields a baseline calculated mean tumor Ktrans value of 0.3 min−1. (B) DCE-MRI analysis after one cycle of NAT yields a calculated mean tumor Ktrans value of 0.2 min−1. (C) Imaging after completion of NAT shows that the lesion is no longer visible; at surgery, the patient had a pathologic complete response.
Abbreviations: DCE-MRI, dynamic contrast-enhanced magnetic resonance imaging; NAT, neoadjuvant therapy; Ktrans, volume transfer constant.
Applications
Both semiquantitative and fully quantitative DCE-MRI techniques have been evaluated for assessing treatment response in breast cancer patients undergoing NAT. The best known example of semiquantitative DCE-MRI in this setting is the I-SPY 1 trial,Citation29 in which patients underwent contrast-enhanced MRI at multiple time points before, during, and after NAT; the authors found that midtreatment change in SER predicted pathologic response with an area under the curve (AUC) of 0.71, higher than clinical assessment (0.63) but slightly lower than change in tumor volume measurement (0.72).Citation29 Other investigations of semiquantitative DCE-MRI include employment of iAUC for response assessment. For example, Tateishi et alCitation36 used the percentage area under the time-intensity curve (%AUC) to predict treatment response and reported that although the sensitivity of %AUC (50%) was not acceptable, the specificity of %AUC of 95.2% was sufficiently high to predict pathologic complete response.Citation36 Our group has shown that semiquantitative analysis of high temporal resolution DCE-MRI data can predict pathologic response after a single cycle of NAT (unpublished data).
Quantitative analysis of DCE-MRI data has been shown to assessCitation39 and predict treatment responseCitation27,Citation40 and has also been shown to correlate with 5-year survival.Citation41–Citation44 Padhani et alCitation27 found that after two cycles of NAT, both change in tumor size and change in Ktrans range on histogram analysis were equally able to predict pathologic response. Ah-See et alCitation40 analyzed multiple quantitative DCE-MRI parameters and reported that change in Ktrans was the best predictor of pathologic nonresponse.Citation40 Our group found that not only the mean but also the standard deviation of Ktrans as estimated by the TK and ETK models, as well as vp, can separate complete pathologic responders from nonresponders after a single cycle of NATCitation45
Diffusion-weighted MRI (DW-MRI)
Theory
Like conventional MRI, DW-MRI records signals from mobile water molecules within tissues, but in DW-MRI the contrast reflects the distance water molecules can migrate or “diffuse” from their original spatial position over a short time interval due to random, thermally-induced motion (ie, Brownian motion). DW-MRI exploits applied gradients of the main magnetic field that allow for localization and calculation of the microscopic diffusion of water molecules. By acquiring two or more images with different degrees of “diffusion weighting” (obtained by applying the diffusion-sensitizing gradients with different amplitudes on successive image acquisitions), an estimate of the amount of molecular water diffusion, termed the apparent diffusion coefficient (ADC), can be calculated at each voxel from
where S is the signal intensity recorded with application of a diffusion-sensitizing gradient, S0 is the signal intensity with no diffusion-sensitizing gradient, and b is a composite variable reflecting various acquisition parameters (including the strength of the gradient pulse, duration of the pulse, and interval between pulses).Citation46 ADC values from successive voxels can then be aggregated to produce a map of ADC values over the volume of interest ().
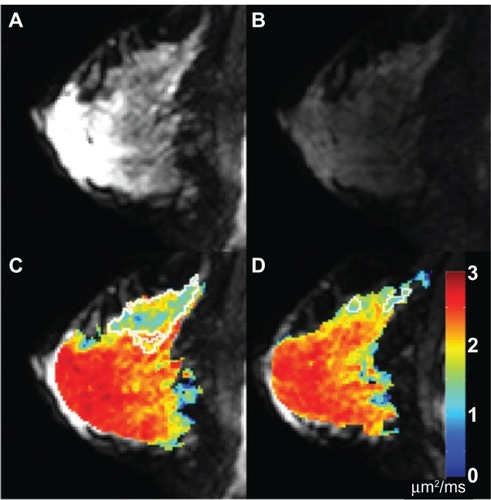
Figure 3 DW-MRI in a breast cancer patient undergoing NAT. (A) On a pretreatment image with no diffusion gradient (ie, b = 0 s/mm2), the tumor is difficult to distinguish from background normal parenchyma. (B) Pretreatment diffusion-weighted image (b = 660 s/mm2) demonstrates subtle patchy increased signal in the deep upper breast, corresponding to an infiltrative tumor. (C) Pretreatment quantitative ADC map, with color-coded voxels corresponding to tissue ADC. The tumor region is outlined in white. (D) ADC map derived from DW-MRI after one cycle of NAT; the tumor volume (again outlined in white) has markedly decreased.
Abbreviations: DW-MRI, diffusion-weighted magnetic resonance imaging; NAT, neoadjuvant therapy; ADC, apparent diffusion coefficient.
In general, experimentally-measured ADC values are lower in organized tissues than in free solution because various structures including cell membranes and intracellular organelles tend to restrict or hinder the free movement of water.Citation47,Citation48 Moreover, cancerous tissues often show significantly reduced ADC values when compared with healthy tissues, a finding typically attributed to the increased cell density of many malignancies.Citation49 With treatment, intratumoral ADC values often rise, presumably because of decreases in cell density consequent to apoptosis and cell death, with concomitant disruption of cell membranes allowing water molecules to diffuse more freely. This basic paradigm – low tumor ADC values before treatment, followed by rising tumor ADC values with treatment – provides the basic model for DW-MRI as a response assessment technique. Importantly, it has been shown that rising ADC values can occur quite early during treatment,Citation50–Citation52 thus providing the motivation for studying DW-MRI as an early response biomarker. For a more extensive discussion, the reader is referred to the review by Arlinghaus and Yankeelov.Citation53
Applications
Several studies have correlated changes in ADC on DW-MRI with treatment response in breast cancer patients undergoing NAT. Early investigations demonstrated increases in mean tumor ADC following chemotherapyCitation39 and correlated mean tumor ADC increases with radiological response,Citation54,Citation55 while subsequent studies examined the relationship between mean tumor ADC changes and pathological response. In general, mean tumor ADC has been found to increase after NAT in both pathologic responders and nonresponders but to increase more for pathologic responders.Citation56–Citation59 Sharma et alCitation52 showed that at the end of therapy, DW-MRI had a lower sensitivity but a higher specificity than lesion size measurement for differentiating pathologic responders from nonresponders.
More recent studies have looked into changes in ADC early in the treatment course and have begun to investigate whether DW-MRI performed early in treatment can be used to predict response. Pickles et alCitation51 demonstrated a significant increase in mean tumor ADC after a single cycle of NAT and showed that mean tumor ADC began to change earlier than tumor longest diameter. In a study of 15 patients, mean tumor ADC increased significantly (P = 0.008) by 11% after a single cycle of NAT.Citation60 Li et alCitation50 reported that after one cycle of NAT, mean tumor ADC significantly increased by 24% in patients who went on to have a complete or partial response and did not change in patients who ultimately exhibited stable or progressive disease.
Proton magnetic resonance spectroscopy (MRS)
Theory
In contrast to conventional MRI, which generates anatomical images using signal primarily arising from water, MRS provides information on the concentrations of different metabolites in tissue. This technique can be exploited to detect the altered metabolic signatures of cancer cells. For example, many malignancies demonstrate elevated levels of choline and lactate, the former due to high rates of membrane turnover and the latter due to utilization of anaerobic glycolysis. Choline is present in less than one millimolar concentrations in normal breast tissue but is significantly elevated in malignant breast tumorsCitation61,Citation62 due to choline kinase overexpression driven by HIF-1αCitation63,Citation64
MRS is more challenging in the breast than in other organs due to the large amount of signal from lipid and to increased magnetic susceptibility at air–tissue interfaces, although the latter is less relevant in single-voxel MRS of the breast. Despite the lower spectroscopic resolution and signal-to-noise ratio of breast MRS compared with MRS in other organs, measurements of choline levels and water-fat (W-F) ratios are feasible in the breast and have been used for breast cancer diagnosis as well as for monitoring response to treatment during NAT.Citation65–Citation72
Applications
A recent clinical trial reported by Kumar et alCitation67 demonstrated that malignant breast tissues have elevated W-F levels compared with controls, and that breast cancers decreasing in size with NAT also exhibited decreasing W-F ratios.Citation67 In a separate clinical trial reported by Tozaki et alCitation71 using choline MRS in patients undergoing NAT, the reduction rates of choline were statistically significantly different between pathological responders and nonresponders after two treatment cycles, with positive and negative predictive values of choline MRS of 89% and 100%, respectively. Moreover, it was found that the predictive power of choline MRS was greater than that of volumetric tumor measurements. Danishad et alCitation73 found that choline signal-to-noise ratio may be useful in predicting tumor response to NAT.
Future directions
Although relatively high predictive power has been demonstrated in preliminary trials, the widespread clinical implementation of W-F and choline MRS for breast cancer treatment response assessment will confront several challenges. First, customized data postprocessing and internal/external signal referencing is required to convert raw spectroscopic data into quantitative information, especially for clinical analysis of multi-voxel MRS data. Second, because the majority of tissue metabolites in vivo besides lipids are present at millimolar concentrations, the MRS sampling voxel must typically be very large (1–8 cm3) in order to achieve sufficient signal-to-noise ratio for very dilute metabolites, and this low spatial resolution translates into limited ability to interrogate small tumors and to report on intralesional heterogeneity. Improvements on the low spatial resolution of conventional MRS may result from emerging methods including multivoxel chemical shift imagingCitation61,Citation70,Citation74 and hyperpolarized MR, discussed below.
Emerging quantitative MRI techniques for response assessment
Several additional MRI techniques are on the horizon for possible future use in assessing breast cancer response to NAT. Some of these techniques have already been deployed in other disease sites. This section discusses possible applications of MT, CEST, and MR elastography as treatment response biomarkers. For each technique, we briefly discuss the underlying theory as well as opportunities and preliminary applications in breast cancer.
Magnetization transfer (MT) MRI
Theory
MT is a method for detecting and quantifying the protons associated with tissue macromolecules. These macromolecular protons cannot be routinely detected with conventional MRI; MT takes advantage of the communication between macromolecular protons and water to elicit an indirect measurement of their properties. MT is typically performed by applying a preparatory off-resonance radiofrequency pulse to selectively saturate protons associated with macromolecules and then measuring the attenuation of the water signal that occurs as a result of the exchange of spin information (magnetization transfer) between the saturated macromolecular protons and free water. The magnetization transfer itself takes place via dipolar coupling and/or chemical exchange.Citation75
The typical method for characterizing the MT effect is to compare the signal intensity between a nonsaturated image (or so-called reference acquisition, designated as MToff) and an image acquired after application of the off-resonance radiofrequency (RF) pulse (MTon). The magnitude of the saturation is proportional to the quantity of saturated macromolecular protons and the efficiency of exchange (or exchange rate) with free water protons (). The MT effect is thus characterized by the magnetization transfer ratio (MTR):
Figure 4 MT results from a healthy volunteer. (A) MToff. (B) MTon. (C) MTR map demonstrating an average 40% reduction in signal (ie, MTR = 0.4) in the fibroglandular tissue with good fat suppression.
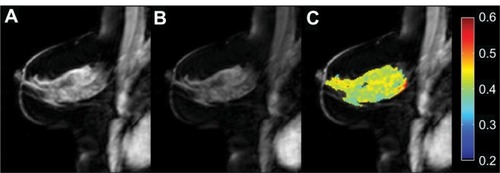
where MTon represents the signal intensity with the saturation pulse and MToff represents the signal intensity from the reference image. The MTR has been shown to be related to the amount of macromolecular protons in tissue.Citation76 It should be noted that since the MTR measurement is affected by the relaxation and exchange rates, the field strength, and the RF irradiation power, it is only a semiquantitative metric. A quantitative MT approach is necessary to separate the contributions from MT and relaxation effects,Citation77,Citation78 and the development of clinically feasible quantitative MT techniques is an active area of research.Citation79 For a more extensive discussion of MT methods, the interested reader is referred to the review by Gochberg and Lepage.Citation80
Opportunities and preliminary applications in breast cancer
While the primary application of MT has been in studies of demyelinating diseases,Citation81–Citation83 the demonstration of MT’s sensitivity to collagen content in meningiomasCitation84 has led to interest in MT for studying changes in the extracellular matrix (ECM) of the breast. The ECM is a major component of the fibroglandular tissue of the breast and is comprised of a network of macromolecules, including collagen, fibronectin, and laminin. The ECM is known to play a role in tumor development and progression,Citation85–Citation87 and the role of the ECM in breast cancer has gained increasing attention. For example, Ioachim et alCitation88 reported that the expression of the ECM macromolecules fibronectin, collagen type IV, and laminin is altered in breast cancer; Levantal et alCitation89 recently demonstrated that cross-linking of collagen type I is involved in the stiffening of the ECM and tumor migration in breast cancer; and Kakkad et alCitation90 reported that the concentration of collagen type I is reduced in the hypoxic tumor environment. An initial application of MT in breast cancer showed a significant reduction of MTR in malignancies compared with benign tumors, thought to represent a reduction of the macromolecular pool due to increased proteolytic activity.Citation91 In the NAT setting, it is hypothesized that changes in macromolecular content in response to successful treatment would result in measurable changes in MTR values. Also, as tumors respond to therapy and shrink, the tumor cells are typically replaced with fibrotic tissue,Citation92–Citation94 which potentially could lead to an (ultimate) increase in MTR in the case of successful therapy.
Chemical exchange saturation transfer (CEST) MRI
Theory
CEST is similar to MT, but rather than focusing on macromolecules, CEST seeks to specifically irradiate tissue metabolites such as amides, amines, and hydroxyl groups that are also in exchange with free water.Citation95–Citation97 The exchangeable protons on these metabolites have chemical shifts that are significantly smaller than the broad macromolecular pool and exchange at significantly slower rates, which allows for spectrally selective irradiation via application of an off-resonance RF pulse.Citation98,Citation99 Under experimental conditions, CEST has been shown to discriminate individual tissue metabolites with high specificity. In addition, because proton chemical exchange rates are pH-dependent, CEST can be used to interrogate for changes in tissue pH.Citation100 Like MT, CEST can be performed without the use of exogenous contrast agents.
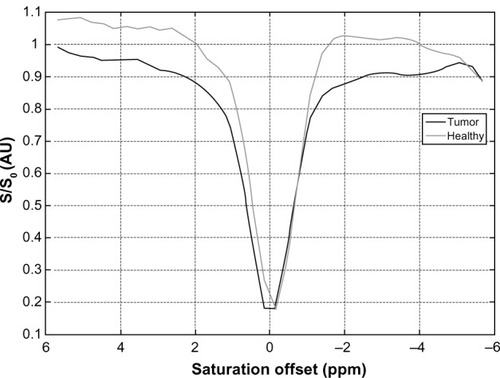
CEST is performed through application of a spectrally-selective saturation pulse prior to an imaging sequence, as shown in . This series is repeated while the resonance offset of the saturation pulse is swept through a range of frequencies, typically < ±10 ppm. The saturation will affect specific protons, and the observed water signal will be attenuated via direct chemical exchange.Citation100 CEST results are often examined via a z-spectrum, a plot of the signal intensity of water as a function of saturation offset, normalized by the signal intensity of water in the absence of saturation.Citation101 Example z-spectra are shown in , which depicts the results of CEST analysis at 3 T on a malignant breast tumor (black line) compared with healthy fibroglandular tissue (gray line). One way the CEST effect can be characterized is by examining the amount of asymmetry observed in the CEST spectra, with the effect at particular offset frequencies related to the exchanging protons of interest.
Figure 5 General pulse sequence diagram for a CEST MRI experiment.
Abbreviations: CEST MRI, chemical exchange saturation transfer magnetic resonance imaging; RF, radiofrequency.
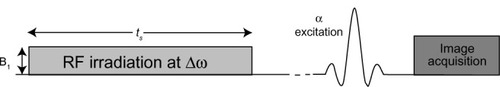
Figure 6 Example z-spectra arising from a CEST MRI experiment at 3 T.
Abbreviations: CEST MRI, chemical exchange saturation transfer magnetic resonance imaging; S, signal intensity with saturation; S0, signal intensity in the absence of saturation.
Perhaps the most widely reported CEST effect is derived from the exchange of amide protons on the backbone of proteins and peptides. In this case, the CEST effect of the amide proton resonance can be characterized by the so-called proton transfer ratio (PTR), a measure of the asymmetry of the z-spectrum about the water frequency (CESTasym) at Δω = 3.5 ppm:
where S(−Δω) and S(Δω) are the signal intensities with the saturation at ±Δω, and S 0 is the signal intensity in the absence of saturation. This calculation negates the confounding effects of direct water saturation, which are symmetric about the center of the z-spectrum.Citation102 The measured PTR can be affected by the concentration of exchanging protons as well as the pH, which influences the proton exchange rate. Extensive research is underway to determine the underlying mechanism driving the measured CEST effect in both healthy and diseased tissue. Ongoing research is also investigating innovative pulse sequencesCitation103,Citation104 and alternative quantification strategiesCitation105–Citation107 that may minimize asymmetric magnetization transfer effects from macromolecules, which can confound the PTR measurement.Citation108 For a more comprehensive introduction to CEST, the reader is referred to the review by Gochberg and Lepage.Citation80
Opportunities and preliminary applications in breast cancer
CEST focused at the amide proton resonance (3.5 ppm) provides information on the amide protons of protein/peptide backbones and has been used to study tissues where either the protein/peptide concentration or the pH may be altered.Citation95,Citation109–Citation111 This technique, sometimes termed amide proton transfer (APT) imaging, is thought to be especially relevant to cancer imaging because tumor cells may accumulate defective proteins at a higher rate than normal and/or experience alterations in pH due to hypoxia.Citation112 APT-CEST has been applied to brain,Citation110 prostate,Citation113 and breast tumorsCitation106 and has been used to differentiate cellular protein content between tumor and healthy cells.Citation114
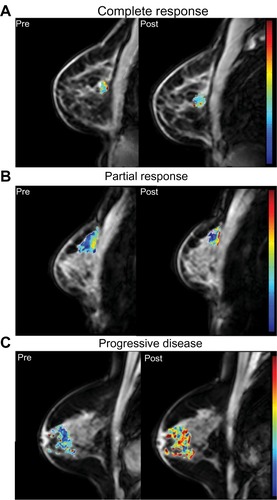
Our group is actively developing APT-CEST imaging as a potential early treatment response biomarker for breast cancer NAT.Citation106,Citation115 depicts the measured APT overlaid on an anatomical image for three breast cancer patients before (left column) and after (right column) one cycle of NAT. The top row shows imaging data from a complete responder (27% decrease in measured APT from baseline), the middle row from a partial responder (49% increase in measured APT), and the bottom row from a patient with progressive disease (78% increase in measured APT). These preliminary results demonstrate the potential sensitivity of APT-CEST to the molecular changes occurring early during treatment.
Figure 7 Amide proton transfer (APT) maps derived from CEST MRI in breast cancer patients undergoing NAT. Baseline (pretreatment) images are presented on the left, and images after one cycle of NAT are presented on the right. (A): patient with complete response after one cycle of therapy (27% decrease in measured APT from baseline). (B): patient with partial response (49% increase in measured APT). (C): patient with progressive disease (78% increase in measured APT).
In addition to APT-CEST, there is potential to examine breast cancer by deploying CEST to evaluate tissue glycosaminoglycan content (ie, gagCEST). Many different cell surface and matrix proteoglycan core proteins are expressed in the mammary glands. The level of expression of these core proteins, the structure of their glycosaminoglycan chains, and their degradation are regulated by many of the same effectors that control development and function.Citation116 Loss or overexpression of proteoglycans in carcinoma cells has been associated with malignant progressionCitation117,Citation118 and has correlated with poor prognosis,Citation119 leading to the hypothesis that gagCEST may be developed as a treatment response biomarker in the future. The application of CEST targeting signatures of active tumors brings potential for noninvasive molecular imaging that could be predictive of prognosis.
Magnetic resonance elastography (MRE)
Theory
MRE is based on use of the elastic properties of tissue as an imaging contrast mechanism. The general concept of elastography, realized first in ultrasoundCitation120 and later developed in MRI,Citation121 involves the use of imaging to measure tissue response to applied physical deformation. Sometimes described as a form of “21 st century palpation,” elastography allows for generation of tissue elasticity maps providing spatial visualization and quantification of the distribution of elastic properties within an object. Generally, elastography methods employ the simplifying assumption of a linear elastic isotropic constitutive model where mechanical equilibrium is governed by:
where G is the shear modulus, u is the displacement vector, ν is Poisson’s ratio, F are body forces, ρ is density, and g is the gravitational constant vector. Given a measured tissue displacement field along with appropriate assumptions, the above equation can be used to reconstruct the spatial distribution of shear modulus (or Young’s modulus, E = 2G[1+ ν]).
MRE methods can be broadly classified as either dynamic or static. With dynamic excitation MRE, shear waves are applied to an area of interest by piezoelectric or pneumatic sources; oscillating motion-sensitized gradient sequences are synchronized to the externally-applied excitation, and induced three-dimensional tissue motion is recorded with phase-contrast imaging.Citation121–Citation124 Static MRE methodsCitation125–Citation128 reconstruct elastic properties of tissue by incorporating a biomechanical finite element model into the nonrigid registration of images acquired under different static loading environments; the application of this technique is not unique to MRI modality, and in fact this methodology is also referred to as modality-independent elastography (MIE)Citation128 due to its foundation in image processing. All MRE methods require specially designed hardware to couple the deformation source (either static or dynamic) to the area of interest. Challenges to successful application of MRE include synchronization of the dynamic deformation source to the motion-sensitized MR gradient and often complex biomechanical model-driven inversions of the deformation field to reconstruct tissue elasticity maps. For a more extensive review of MR-based elastography techniques, the interested reader is referred to Mariappan et alCitation129 and Manduca et al.Citation130
Opportunities and preliminary applications in breast cancer
The rationale for exploring MRE as a possible breast cancer treatment response biomarker derives from observations that cancer progression is accompanied by extracellular matrix remodeling and increasing mechanical stiffness.Citation89 MRE has been deployed in liver tumor assessment and has had promising preliminary success in distinguishing between benign and malignant lesions, with malignant tumors exhibiting a significant (>3–4 fold) stiffness increase over benign tumors.Citation131 While there are very few studies of MR-based elastography in breast cancer, preliminary results show initial promise in quantifying in vivo stiffness of breast tumors (as well as differentiation of fibroglandular and adipose tissue)Citation132 and have demonstrated the ability to improve diagnostic sensitivity and specificity over more traditional breast MRI.Citation133
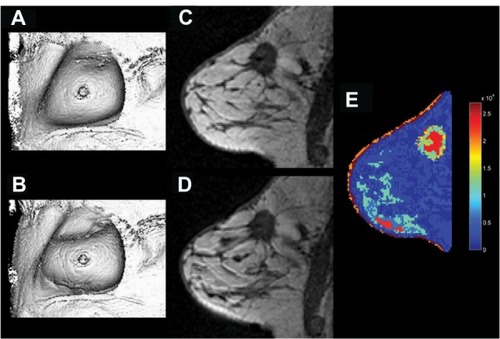
Our group is actively developing MRE as a mechanical property biomarker in breast cancer, and our novel MIE method has been under preliminary investigation in breast cancer.Citation126,Citation127 Recent breakthroughs involving translation and automationCitation127 have generated promising preliminary results towards the ability to spatially reconstruct tissue elastic mechanical properties in breast cancer. depicts the results of MIE analysis on a breast cancer patient.
Monitoring the changes in mechanical properties along the NAT time course may provide a means of assessing response to therapy. Additionally, quantitative mechanical property information can also be used to inform patient-specific reaction-diffusion tumor growth models that are mechanically coupled to constrained tumor cell diffusion.Citation134 The growth and tumor cell diffusion parameters within the tumor growth models can be fit between the initial and intermediate time points and then projected forward to the final time point in order to help predict patient response.Citation135,Citation136
Figure 8 Static MRE (MIE) results from a breast cancer patient. (A) undeformed image volume. (B) deformed image volume. (C) undeformed central slice. (D) deformed central slice. (E) reconstructed tissue elasticity map.
Hyperpolarized MR
Theory
Hyperpolarized MR seeks to overcome the limitations of conventional MRS by exploiting exogenous contrast agents that have been “hyperpolarized,” ie, a large proportion of their nuclear spins have been aligned with the magnetic field or polarized. Whereas conventional MR imaging depends on spins that have been polarized on the order of a few parts per million, hyperpolarization allows for polarizing nuclear spins to nearly unity. The resulting several-orders-of-magnitude increase in signal intensity translates into increased sensitivity for detecting metabolic markers of cancer such as lactate and bicarbonate that may be present at millimolar and potentially submillimolar concentrationsCitation137,Citation138 and that may not be amenable to conventional MRS.Citation137,Citation139 The technique may also be exploited to provide better spatial resolution and significantly faster examination times compared with conventional proton MRS. Long-lived nuclear spin sites are typically selected for the preparation of hyperpolarized contrast agents that are suitable for injection into living organisms. Carbon-13 (13C) sites without directly-attached protons are most commonly used, due to their long T1 of ~ 20–40 seconds and their abundance within many metabolically-relevant molecules. At present, clinical translation of hyperpolarized MR technology is limited by demanding instrumentation and software requirements, including multinuclear MRI scanner capability, highly specialized RF pulse sequences (tailored to the RF coil, magnetic field strength, and metabolic contrast agent), and multinuclear RF coils.
Opportunities and preliminary applications in breast cancer
While in vivo hyperpolarized MR technology is less than 10 years old, it has rapidly progressed from proof-of-principle studies in mice to the first clinical trial in humans, including analyses of choline, pyruvate, fumarate, and bicarbonate as potential biomarkers.Citation137,Citation140–Citation143 There have been as yet no specific clinical applications to breast cancer, but preliminary biomarker studies in mice and in human prostate cancer suggest this technique may be applicable for breast cancer NAT response assessment in the future.Citation143
Challenges and opportunities for clinical translation
Several important challenges must be addressed in working toward the translation and adoption of quantitative MRI techniques. First, investigators will have to choose meaningful and clinically relevant statistical methods for validating novel MRI methods. Prior studies of MRI as a response assessment tool for NAT in breast cancer have chosen a variety of clinical outcome variables – including palpation, imaging-based size measurement change, and pathologic response – against which to evaluate imaging as a response biomarker. Pathologic response is the most clinically relevant of these outcome variables, having been established as an independent prognostic marker for overall survival in breast cancer,Citation3 yet researchers attempting to validate their methods against pathologic response will have to contend with the multiple different definitions of pathologic response now circulating in the breast cancer literature as well as the notion raised in certain recent studies that pathologic response may be a suitable surrogate endpoint for some but not all breast cancer subtypes.Citation144 Widespread incorporation of quantitative MRI response biomarkers in the clinical and research settings will probably require validation not just as predictors of pathologic response, but as predictors of long-term outcomes including recurrence rates and overall survival.
A second challenge involves ensuring standardization and reproducibility of MRI methods. MR imaging is a complex undertaking, with images and quantitative measurements dependent upon multiple precise software settings and hardware configurations. Results of a controlled experiment on a single scanner in a laboratory environment may be quite difficult to reproduce across multiple imaging sites. Researchers will have to work with vendors to increase reproducibility across platforms, and vendors will likely be called upon to provide increased transparency with regard to proprietary hardware and software architectures. A handful of government–industry consortia including the Radiological Society of North America’s Quantitative Imaging Biomarkers Alliance are attempting to facilitate these developments. We may also see continued incorporation of quantitative MRI techniques into commercially available computer-assisted detection software.
A third challenge for clinical translation lies in designing MR imaging protocols to meet the various objectives of a clinical scan. As mentioned earlier, there are two chief goals for breast imaging during NAT – response assessment and demonstration of residual disease – and these goals may call for different MRI approaches that may be mutually exclusive. For example, basic MRI principles dictate a fundamental tradeoff between spatial and temporal resolution–in general, high spatial resolution images require longer acquisition times and therefore a necessary sacrifice of temporal resolution, and high temporal resolution images, by virtue of the rapidity with which they are acquired, do not provide sufficient time to gather high spatial resolution data. A scan tailored for demonstration of residual disease may call for high spatial resolution imaging, while a DCE-MRI scan tailored for early response assessment may call for high temporal resolution imaging in order to provide the most accurate model of vascular flow. These tradeoffs highlight the challenges in clinical MRI protocol design, where different clinical objectives sometimes compete with each other. Potential solutions may emerge from creating hybrid protocols incorporating a variety of imaging techniques; from exploring newer methods, such as compressed sensing, that may make the above tradeoffs less apparent; and/or from employing different scanning protocols for different settings such as, a high temporal resolution MRI protocol early in the course of therapy and a high spatial resolution protocol at the end of therapy as an adjunct to surgical planning.
Finally, investigators across multiple disciplines will have to work toward overcoming the challenge of information saturation that clinicians will inevitably face as the methods discussed in this article are translated into the clinical setting. As more quantitative MRI metrics are validated as useful biomarkers, we may see development of integrated clinical scoring systems that synthesize multiparametric imaging variables with other quantitative clinical parameters.
Conclusion
There is growing demand for objective and standardized early-response biomarkers for breast cancer NAT, with such biomarkers to be used as an adjunct to and possibly eventually a replacement for pathologic assessment of treatment response. The imaging research community is responding to this demand by developing and testing novel approaches in preclinical models, in single site studies, and in large multisite clinical trials. Quantitative MRI techniques, including the current and emerging methods reviewed in this contribution, hold great potential for incorporation into both clinical and research algorithms. As these techniques are validated and correlated with long-term clinical outcomes, we may witness a broad transformation in the use of imaging with breast cancer NAT.
Disclosure
The authors report no conflicts of interest in this work.
Acknowledgments
We thank the National Institutes of Health (NIH) for funding through NCI 1R01CA129961, NCI 1U01CA142565, R25CA092043, NCI 1P50 CA098131, NCI 5R00 CA134749-03, NCI P30 CA68485, and NCRR/NIH UL1 RR024975-01 (Vanderbilt CTSA grant). We thank the US Department of Defense for funding through BC112431. We would like to acknowledge the Pilot Award Program associated with the Vanderbilt Initiative in Surgery and Engineering (ViSE) center for their support in elastography. We also thank the Kleberg Foundation for generous support of the molecular imaging program at our Institution.
References
- LiuSVMelstromLYaoKRussellCASenerSFNeoadjuvant therapy for breast cancerJ Surg Oncol2010101428329120187061
- A phase II neo-adjuvant study of cisplatin, paclitaxel with or without RAD001 in patients with triple-negative locally advanced breast cancer NCT00930930. Available from: from http://www.asco.org/ASCOv2/Meetings/Abstracts?&vmview=abst_detail_view&confID=74&abstractID=47851Accessed July 7, 2012
- WolffACBerryDCareyLAResearch issues affecting pre-operative systemic therapy for operable breast cancerJ Clin Oncol200826580681318258990
- PartridgeSCGibbsJELuYEssermanLJSudilovskyDHyltonNMAccuracy of MR imaging for revealing residual breast cancer in patients who have undergone neoadjuvant chemotherapyAJR Am J Roentgenol200217951193119912388497
- YehESlanetzPKopansDBProspective comparison of mammography, sonography, and MRI in patients undergoing neoadjuvant chemotherapy for palpable breast cancerAJR Am J Roentgenol2005184386887715728611
- AbramsonRGSuPFShyrYQuantitative metrics in clinical radiology reporting: a snapshot perspective from a single mixed academic-community practiceMagn Reson Imaging2012 Epub7 11
- YankeelovTEPickensDRPriceRRQuantitative MRI in CancerCRC Press, an imprint of Taylor & Francis GroupBoca Raton, Florida, USA2011
- EisenhauerEATherassePBogaertsJNew response evaluation criteria in solid tumours: revised RECIST guideline (version 1.1)Eur J Cancer200945222824719097774
- RatainMJEckhardtSGPhase II studies of modern drugs directed against new targets: if you are fazed, too, then resist RECISTJ Clin Oncol200422224442444515483011
- TumaRSSometimes size doesn’t matter: reevaluating RECIST and tumor response rate endpointsJ Natl Cancer Inst200698181272127416985244
- KuhlCKCurrent status of breast MR imaging. Part 2. Clinical applicationsRadiology2007244367269117709824
- HoussamiNHayesDFReview of preoperative magnetic resonance imaging (MRI) in breast cancer: should MRI be performed on all women with newly diagnosed, early stage breast cancer?CA Cancer J Clin200959529030219679690
- PediconiFMiglioETelescaMEffect of preoperative breast magnetic resonance imaging on surgical decision making and cancer recurrence ratesInvest Radiol201247212813521934515
- PettitKSwatskeMEGaoFThe impact of breast MRI on surgical decision-making: are patients at risk for mastectomy?J Surg Oncol2009100755355819757442
- KuhlCThe current status of breast MR imaging. Part I. Choice of technique, image interpretation, diagnostic accuracy, and transfer to clinical practiceRadiology2007244235637817641361
- ChouCPWuMTChangHTMonitoring breast cancer response to neoadjuvant systemic chemotherapy using parametric contrast-enhanced MRI: a pilot studyAcad Rad2007145561573
- DelilleJPSlanetzPJYehEDHalpernEFKopansDBGarridoLInvasive ductal breast carcinoma response to neoadjuvant chemotherapy: noninvasive monitoring with functional MR imaging pilot studyRadiology20032281636912775851
- DrewPJKerinMJMahapatraTEvaluation of response to neoadjuvant chemoradiotherapy for locally advanced breast cancer with dynamic contrast-enhanced MRI of the breastEur J Surg Oncol200127761762011669587
- AbrahamDCJonesRCJonesSEEvaluation of neoadjuvant chemotherapeutic response of locally advanced breast cancer by magnetic resonance imagingCancer1996781911008646731
- RieberABrambsHJGabelmannAHeilmannVKreienbergRKühnTBreast MRI for monitoring response of primary breast cancer to neo-adjuvant chemotherapyEur Radiol20021271711171912111062
- GillesRGuinebretièreJMToussaintCLocally advanced breast cancer: contrast-enhanced subtraction MR imaging of response to preoperative chemotherapyRadiology199419136336388184039
- LonderoVBazzocchiMDel FrateCLocally advanced breast cancer: comparison of mammography, sonography and MR imaging in evaluation of residual disease in women receiving neoadjuvant chemotherapyEur Radiol20041481371137914986052
- Balu-MaestroCChapellierCBleuseAChanaletIChauvelCLargillierRImaging in evaluation of response to neoadjuvant breast cancer treatment benefits of MRIBreast Cancer Res Treat200272214515212038705
- CheungYCChenSCSuMYMonitoring the size and response of locally advanced breast cancers to neoadjuvant chemotherapy (weekly paclitaxel and epirubicin) with serial enhanced MRIBreast Cancer Res Treat2003781515812611457
- MartincichLMontemurroFDe RosaGMonitoring response to primary chemotherapy in breast cancer using dynamic contrast-enhanced magnetic resonance imagingBreast Cancer Res Treat2004831677614997056
- WasserKKleinSKFinkCEvaluation of neoadjuvant chemotherapeutic response of breast cancer using dynamic MRI with high temporal resolutionEur Radiol2003131808712541113
- PadhaniARHayesCAssersohnLPrediction of clinicopathologic response of breast cancer to primary chemotherapy at contrast-enhanced MR imaging: initial clinical resultsRadiology2006239236137416543585
- LooCETeertstraHJRodenhuisSDynamic contrast-enhanced MRI for prediction of breast cancer response to neoadjuvant chemotherapy: initial resultsAJR Am J Roentgenol200819151331133818941065
- HyltonNMBlumeJDBernreuterWKLocally advanced breast cancer: MR imaging for prediction of response to neoadjuvant chemotherapy – results from ACRIN 6657/I-SPY TRIALRadiology2012263366367222623692
- PartridgeSCGibbsJELuYMRI measurements of breast tumor volume predict response to neoadjuvant chemotherapy and recurrence-free survivalAJR Am J Roentgenol200518461774178115908529
- YankeelovTEGoreJCDynamic contrast enhanced magnetic resonance imaging in oncology: theory, data acquisition, analysis, and examplesCurr Med Imaging Rev2009329110719829742
- ArasuVAChenRCNewittDNCan signal enhancement ratio (SER) reduce the number of recommended biopsies without affecting cancer yield in occult MRI-detected lesions?Acad Radiol201118671672121420333
- MillerKDTrigoJMWheelerCA multicenter phase II trial of ZD6474, a vascular endothelial growth factor receptor-2 and epidermal growth factor receptor tyrosine kinase inhibitor, in patients with previously treated metastatic breast cancerClin Cancer Res20051193369337615867237
- EvelhochJLLoRussoPMHeZMagnetic resonance imaging measurements of the response of murine and human tumors to the vascular-targeting agent ZD6126Clin Cancer Res200410113650365715173071
- MorganBThomasALDrevsJDynamic contrast-enhanced magnetic resonance imaging as a biomarker for the pharmacological response of PTK787/ZK 222584, an inhibitor of the vascular endothelial growth factor receptor tyrosine kinases, in patients with advanced colorectal cancer and liver metastases: results from two phase I studiesJ Clin Oncol200321213955396414517187
- TateishiUMiyakeMNagaokaTNeoadjuvant chemotherapy in breast cancer: prediction of pathologic response with PET/CT and dynamic contrast-enhanced MR imaging – prospective assessmentRadiology20122631536322438441
- SourbronSPBuckleyDLTracer kinetic modelling in MRI: estimating perfusion and capillary permeabilityPhys Med Biol2012572R1R3322173205
- KetySSThe theory and applications of the exchange of inert gas at the lungs and tissuesPharmacol Rev19513114114833874
- YankeelovTELepageMChakravarthyAIntegration of quantitative DCE-MRI and ADC mapping to monitor treatment response in human breast cancer: initial resultsMagn Reson Imaging200725111317222711
- Ah-SeeMLMakrisATaylorNJEarly changes in functional dynamic magnetic resonance imaging predict for pathologic response to neoadjuvant chemotherapy in primary breast cancerClin Cancer Res200814206580658918927299
- PicklesMDMantonDJLowryMTurnbullLWPrognostic value of pre-treatment DCE-MRI parameters in predicting disease free and overall survival for breast cancer patients undergoing neoadjuvant chemotherapyEur J Radiol200971349850518572340
- HeldahlMGBathenTFRydlandJPrognostic value of pretreatment dynamic contrast-enhanced MR imaging in breast cancer patients receiving neoadjuvant chemotherapy: overall survival predicted from combined time course and volume analysisActa Radiol201051660461220429756
- JohansenRJensenLRRydlandJPredicting survival and early clinical response to primary chemotherapy for patients with locally advanced breast cancer using DCE-MRIJ Magn Reson Imaging20092961300130719472387
- NewittDCPartridgeSCChangBJoeBNHyltonNOptimization of the percent enhancement threshold for breast MRI tumor volume measurement during neoadjuvant treatment of breast cancer for predicting recurrence free survival timeProc Intl Soc Mag Reson Med (ISMRM)201119508 Available from: http://submissions.miracd.com/ismrm2011/proceedings/files/508.pdfAccessed June 21, 2012
- LiXArlinghausLRChakravarthyABTowards optimization of DCE-MRI analysis for early prediction of the response of breast cancer patients to neoadjuvant chemotherapyProc Intl Soc Mag Reson Med (ISMRM)2012201464 Available from: http://www.google.ca/url?sa=t&rct=j&q=towards%20optimization%20of%20dce-mri%20analysis%20for%20early%20prediction%20of%20the%20response%20of%20breast%20cancer%20patients%20to%20neoadjuvant%20chemotherapy&source=web&cd=2&ved=0CCoQFjAB&url=ftp%3A%2F%2Fftp.cmrr.umn.edu%2Fcorum%2Fismrm2012breast%2F1464.pdf&ei=BBBRUMXvHcjYywGoy4HQAw&usg=AFQjCNGYy7-cER4BpjS_l25btSw5qx75Fw&cad=rjaAccessed September 12, 2012
- Le BihanDBretonELallemandDGrenierPCabanisELaval-JeantetMMR imaging of intravoxel incoherent motions: application to diffusion and perfusion in neurologic disordersRadiology198616124014073763909
- AndersonAWXieJPizzoniaJBronenRASpencerDDGoreJCEffects of cell volume fraction changes on apparent diffusion in human cellsMagn Reson Imaging200018668969510930778
- HagmannPJonassonLMaederPThiranJPWedeenVJMeuliRUnderstanding diffusion MR imaging techniques: from scalar diffusion-weighted imaging to diffusion tensor imaging and beyondRadiographics200626Suppl 1S205S22317050517
- Charles-EdwardsEMdeSouzaNMDiffusion-weighted magnetic resonance imaging and its application to cancerCancer Imaging2006613514317015238
- LiXRChengLQLiuMDW-MRI ADC values can predict treatment response in patients with locally advanced breast cancer undergoing neoadjuvant chemotherapyMed Oncol201229242543121286861
- PicklesMDGibbsPLowryMTurnbullLWDiffusion changes precede size reduction in neoadjuvant treatment of breast cancerMagn Reson Imaging200624784384716916701
- SharmaUDanishadKKSeenuVJagannathanNRLongitudinal study of the assessment by MRI and diffusion-weighted imaging of tumor response in patients with locally advanced breast cancer undergoing neoadjuvant chemotherapyNMR Biomed200922110411318384182
- ArlinghausLRYankeelovTEDiffusion-weighted MRIYankeelovTPickensDRPriceRRQuantitative MRI in CancerBoca RatonCRC Press, an imprint of Taylor & Francis Group, Boca Raton, Florida, USA2012xviii312
- IacconiCGiannelliMMariniCThe role of mean diffusivity (MD) as a predictive index of the response to chemotherapy in locally advanced breast cancer: a preliminary studyEur Radiol201020230330819760422
- ParkSHMoonWKChoNDiffusion-weighted MR imaging: pretreatment prediction of response to neoadjuvant chemotherapy in patients with breast cancerRadiology20102571566320851939
- BelliPCostantiniMIerardiCDiffusion-weighted imaging in evaluating the response to neoadjuvant breast cancer treatmentBreast J201117661061921929557
- FangbergetANilsenLBHoleKHNeoadjuvant chemotherapy in breast cancer-response evaluation and prediction of response to treatment using dynamic contrast-enhanced and diffusion-weighted MR imagingEur Radiol20112161188119921127880
- ParkSHMoonWKChoNComparison of diffusion-weighted MR imaging and FDG PET/CT to predict pathological complete response to neoadjuvant chemotherapy in patients with breast cancerEur Radiol2012221182521845462
- ShinHJBaekHMAhnJHPrediction of pathologic response to neoadjuvant chemotherapy in patients with breast cancer using diffusion-weighted imaging and MRSNMR Biomed2012 Epub5 6
- JensenLRGarzonBHeldahlMGBathenTFLundgrenSGribbestadISDiffusion-weighted and dynamic contrast-enhanced MRI in evaluation of early treatment effects during neoadjuvant chemotherapy in breast cancer patientsJ Magn Reson Imaging20113451099110922002757
- DorriusMDPijnappelRMJansen-van der WeideMCDetermination of choline concentration in breast lesions: quantitative multivoxel proton MR spectroscopy as a promising noninvasive assessment tool to exclude benign lesionsRadiology2011259369570321460033
- BartellaLMorrisEADershawDDProton MR spectroscopy with choline peak as malignancy marker improves positive predictive value for breast cancer diagnosis: preliminary studyRadiology2006239368669216603660
- GlundeKShahTWinnardPTJrHypoxia regulates choline kinase expression through hypoxia-inducible factor-l alpha signaling in a human prostate cancer modelCancer Res200868117218018172309
- HanahanDWeinbergRAHallmarks of cancer: the next generationCell2011144564667421376230
- BathenTFHeldahlMGSitterBIn vivo MRS of locally advanced breast cancer: characteristics related to negative or positive choline detection and early monitoring of treatment responseMAGMA201124634735721909791
- JagannathanNRKumarMSeenuVEvaluation of total choline from in-vivo volume localized proton MR spectroscopy and its response to neoadjuvant chemotherapy in locally advanced breast cancerBr J Cancer20018481016102211308247
- KumarMJagannathanNRSeenuVDwivediSNJulkaPKRathGKMonitoring the therapeutic response of locally advanced breast cancer patients: sequential in vivo proton MR spectroscopy studyJ Magn Reson Imaging200624232533216786567
- MantonDJChaturvediAHubbardANeoadjuvant chemotherapy in breast cancer: early response prediction with quantitative MR imaging and spectroscopyBr J Cancer200694342743516465174
- MurataYHamadaNKubotaKCholine by magnetic spectroscopy and dynamic contrast enhancement curve by magnetic resonance imaging in neoadjuvant chemotherapy for invasive breast cancerMol Med Report2009213943
- SijensPEDorriusMDKappertPBaronPPijnappelRMOudkerkMQuantitative multivoxel proton chemical shift imaging of the breastMagn Reson Imaging201028331431920071119
- TozakiMSakamotoMOyamaYMaruyamaKFukumaEPredicting pathological response to neoadjuvant chemotherapy in breast cancer with quantitative 1H MR spectroscopy using the external standard methodJ Magn Reson Imaging201031489590220373434
- MeisamySBolanPJBakerEHNeoadjuvant chemotherapy of locally advanced breast cancer: predicting response with in vivo (1)H MR spectroscopy – a pilot study at 4 TRadiology2004233242443115516615
- DanishadKKSharmaUSahRGSeenuVParshadRJagannathanNRAssessment of therapeutic response of locally advanced breast cancer (LABC) patients undergoing neoadjuvant chemotherapy (NACT) monitored using sequential magnetic resonance spectroscopic imaging (MRSI)NMR Biomed201023323324120175134
- HuJYuYKouZA high spatial resolution 1H magnetic resonance spectroscopic imaging technique for breast cancer with a short echo timeMagn Reson Imaging200826336036617904326
- WolffSDBalabanRSMagnetization transfer contrast (MTC) and tissue water proton relaxation in vivoMagn Reson Med19891011351442547135
- OdrobinaEELamTYJPunTMidhaRStaniszGJMR properties of excised neural tissue following experimentally induced demyelinationNMR Biomed200518527728415948233
- HenkelmanRMHuangXXiangQSStaniszGJSwansonSDBronskillMJQuantitative interpretation of magnetization-transferMagn Reson Med19932967597668350718
- SledJGPikeGBQuantitative imaging of magnetization transfer exchange and relaxation properties in vivo using MRIMagn Reson Med200146592393111675644
- DortchRDLiKGochbergDFQuantitative magnetization transfer imaging in human brain at 3 T via selective inversion recoveryMagn Reson Med20116651346135221608030
- GochbergDFLepageMMagnetization transfer and chemical exchange saturation transfer imaging in cancer imagingYankeelovTEPickensDRPriceRRQuantitative MRI of CancerNew York, NYCRC Press, an imprint of Taylor & Francis Group, Boca Raton, Florida, USA201299106
- FilippiMAgostaFMagnetization transfer MRI in multiple sclerosisJ Neuroimaging200717Suppl 1S22S26
- FilippiMRoccaMAMagnetization transfer magnetic resonance imaging in the assessment of neurological diseasesJ Neuroimaging200414430331315358949
- RopeleSFazekasFMagnetization transfer MR imaging in multiple sclerosisNeuroimaging Clin N Am2009191273619064197
- LundbomNDetermination of magnetization transfer contrast in tissue: an MR imaging study of brain tumorsAJR Am J Roentgenol19921596127912851442402
- HanahanDWeinbergRAThe hallmarks of cancerCell20001001577010647931
- NelsonCMBissellMJOf extracellular matrix, scaffolds, and signaling: tissue architecture regulates development, homeostasis, and cancerAnnu Rev Cell Dev Biol20062228730916824016
- Stetler-StevensonWGAznavoorianSLiottaLATumor cell interactions with the extracellular-matrix during invasion and metastasisAnnu Rev Cell Biol199395415738280471
- IoachimECharchantiABriasoulisEImmunohistochemical expression of extracellular matrix components tenascin, fibronectin, collagen type IV and laminin in breast cancer: their prognostic value and role in tumour invasion and progressionEur J Cancer200238182362237012460779
- LeventalKRYuHKassLMatrix crosslinking forces tumor progression by enhancing integrin signalingCell2009139589190619931152
- KakkadSMSolaiyappanMO’RourkeBHypoxic tumor microenvironments reduce collagen I fiber densityNeoplasia201012860861720689755
- BoniniRHZeottiDSaraivaLAMagnetization transfer ratio as a predictor of malignancy in breast lesions: preliminary resultsMagn Reson Med20085951030103418429009
- RajanREstevaFJSymmansWFPathologic changes in breast cancer following neoadjuvant chemotherapy: implications for the assessment of responseClin Breast Cancer20045323523815335458
- SahooSLesterSCPathology of breast carcinomas after neoadjuvant chemotherapy: an overview with recommendations on specimen processing and reportingArch Pathol Lab Med2009133463364219391665
- SneigeNKempBPusztaiLAsmarLHortobagyiGNChemotherapy-induced histologic changes in mastectomy specimens and their potential significanceBreast200110649250014965629
- ZhouJPayenJFWilsonDATraystmanRJvan ZijlPCUsing the amide proton signals of intracellular proteins and peptides to detect pH effects in MRINat Med2003981085109012872167
- JinTWangPZongXKimSGMagnetic resonance imaging of the Amine-Proton EXchange (APEX) dependent contrastNeuroimage20125921218122721871570
- van ZijlPCJonesCKRenJMalloyCRSherryADMRI detection of glycogen in vivo by using chemical exchange saturation transfer imaging (glycoCEST)Proc Natl Acad Sci U S A2007104114359436417360529
- van ZijlPCZhouJMoriNPayenJFWilsonDMoriSMechanism of magnetization transfer during on-resonance water saturation. A new approach to detect mobile proteins, peptides, and lipidsMagn Reson Med200349344044912594746
- WolffSDBalabanRSNMR imaging of labile proton-exchangeJ Magn Reson1990861164169
- WardKMAletrasAHBalabanRSA new class of contrast agents for MRI based on proton chemical exchange dependent saturation transfer (CEST)J Magn Reson20001431798710698648
- BryantRGThe dynamics of water-protein interactionsAnnu Rev Biophys Biomol Struct19962529538800463
- SmithSABulteJWvan ZijlPCDirect saturation MRI: theory and application to imaging brain ironMagn Reson Med200962238439319526497
- ScheideggerRVinogradovEAlsopDCAmide proton transfer imaging with improved robustness to magnetic field inhomogeneity and magnetization transfer asymmetry using saturation with frequency alternating RF irradiationMagn Reson Med20116651275128521608029
- ZaissMSchmittBBachertPQuantitative separation of CEST effect from magnetization transfer and spillover effects by Lorentzian-line-fit analysis of z-spectraJ Magn Reson2011211214915521641247
- DesmondKLStaniszGJUnderstanding quantitative pulsed CEST in the presence of MTMagn Reson Med201267497999021858864
- DulaANArlinghausLRDortchRDRepeatability of chemical exchange saturation transfer measurements in healthy fibroglandular breast tissue at 3 TProc Intl Soc Mag Reson Med (ISMRM)2012203376 Available from: http://www.google.ca/url?sa=t&rct=j&q=repeatability%20of%20chemical%20exchange%20saturation%20transfer%20measurements%20in%20healthy%20fibroglandular%20breast%20tissue%20at%203t&source=web&cd=1&ved=0CCMQFjAA&url=ftp%3A%2F%2Fftp.cmrr.umn.edu%2Fcorum%2Fismrm2012breast%2F3376.pdf&ei=CyFRUNz2AsPlyAHegIHICA&usg=AFQjCNHcPUnGall2lf7lxHCeT-Ueghd6sQ&cad=rjaAccessed September 12, 2012
- JonesCKPoldersDHuaJIn vivo three-dimensional whole-brain pulsed steady-state chemical exchange saturation transfer at 7 TMagn Reson Med20126761579158922083645
- HuaJJonesCKBlakeleyJSmithSAvan ZijlPCZhouJQuantitative description of the asymmetry in magnetization transfer effects around the water resonance in the human brainMagn Reson Med200758478679317899597
- JokivarsiKTGröhnHIGröhnOHKauppinenRAProton transfer ratio, lactate, and intracellular pH in acute cerebral ischemiaMagn Reson Med200757464765317390356
- JonesCKSchlosserMJvan ZijlPCPomperMGGolayXZhouJAmide proton transfer imaging of human brain tumors at 3 TMagn Reson Med200656358559216892186
- SunPZMurataYLuJWangXLoEHSorensenAGRelaxation-compensated fast multislice amide proton transfer (APT) imaging of acute ischemic strokeMagn Reson Med20085951175118218429031
- SalhotraALalBLaterraJSunPZvan ZijlPCZhouJAmide proton transfer imaging of 9L gliosarcoma and human glioblastoma xenograftsNMR Biomed200821548949717924591
- JiaGAbazaRWilliamsJDAmide proton transfer MR imaging of prostate cancer: a preliminary studyJ Magn Reson Imaging201133364765421563248
- ZhouJLalBWilsonDALaterraJvan ZijlPCAmide proton transfer (APT) contrast for imaging of brain tumorsMagn Reson Med20035061120112614648559
- DulaANArlinghausLRDortchRDAmide proton transfer imaging of the breast at 3T: establishing reproducibility and possible feasibility assessing chemotherapy responseMagn Reson Med2012 [Epub ahead of print]
- DeleheddeMLyonMSergeantNRahmouneHFernigDGProteoglycans: pericellular and cell surface multireceptors that integrate external stimuli in the mammary glandJ Mammary Gland Biol Neoplasia20016325327311547896
- BabaFSwartzKvan BurenRSyndecan-1 and syndecan-4 are overexpressed in an estrogen receptor-negative, highly proliferative breast carcinoma subtypeBreast Cancer Res Treat2006981919816636895
- MaedaTAlexanderCMFriedlAInduction of syndecan-1 expression in stromal fibroblasts promotes proliferation of human breast cancer cellsCancer Res200464261262114744776
- BarbareschiMMaisonneuvePAldoviniDHigh syndecan-1 expression in breast carcinoma is related to an aggressive phenotype and to poorer prognosisCancer200398347448312879463
- OphirJCéspedesIPonnekantiHYazdiYLiXElastography: a quantitative method for imaging the elasticity of biological tissuesUltrason Imaging19911321111341858217
- MuthupillaiRLomasDJRossmanPJGreenleafJFManducaAEhmanRLMagnetic-resonance elastography by direct visualization of propagating acoustic strain wavesScience19952695232185418577569924
- SackIMcGowanCKSamaniALuginbuhlCOakdenWPlewesDBObservation of nonlinear shear wave propagation using magnetic resonance elastographyMagn Reson Med200452484285015389935
- SinkusRTanterMCathelineSImaging anisotropic and viscous properties of breast tissue by magnetic resonance-elastographyMagn Reson Med200553237238715678538
- Van HoutenEEPaulsenKDMigaMIKennedyFEWeaverJBAn overlapping subzone technique for MR-based elastic property reconstructionMagn Reson Med199942477978610502768
- MigaMIRothneyMPOuJJModality independent elastography (MIE): potential applications in dermoscopyMed Phys20053251308132015984683
- OuJJOngREYankeelovTEMigaMIEvaluation of 3D modality-independent elastography for breast imaging: a simulation studyPhys Med Biol200853114716318182693
- PheifferTSOuJJOngREMigaMIAutomatic generation of boundary conditions using demons nonrigid image registration for use in 3-D modality-independent elastographyIEEE Trans Biomed Eng20115892607261621690002
- MigaMIA new approach to elastography using mutual information and finite elementsPhys Med Biol200348446748012630742
- MariappanYKGlaserKJEhmanRLMagnetic resonance elastography: a reviewClin Anat201023549751120544947
- ManducaAOliphantTEDresnerMAMagnetic resonance elastography: non-invasive mapping of tissue elasticityMed Image Anal20015423725411731304
- VenkateshSKYinMGlocknerJFMR elastography of liver tumors: preliminary resultsAJR Am J Roentgenol200819061534154018492904
- McKnightALKugelJLRossmanPJManducaAHartmannLCEhmanRLMR elastography of breast cancer: preliminary resultsAJR Am J Roentgenol200217861411141712034608
- SiegmannKCXydeasTSinkusRKraemerBVogelUClaussenCDDiagnostic value of MR elastography in addition to contrast-enhanced MR imaging of the breast-initial clinical resultsEur Radiol201020231832519727753
- GargIMigaMIPreliminary investigation of the inhibitory effects of mechanical stress in tumor growthSPIE Medical Imaging 2008: Visualization, Image-Guided Procedures, and Modeling Conference20086918 Available from http://spie.org/x648.html?product_id=773376Accessed September 12, 2012
- AtuegwuNCArlinghausLRLiXIntegration of diffusion-weighted MRI data and a simple mathematical model to predict breast tumor cellularity during neoadjuvant chemotherapyMagn Reson Med20116661689169621956404
- AtuegwuNCColvinDCLovelessMEXuLGoreJCYankeelovTEIncorporation of diffusion-weighted magnetic resonance imaging data into a simple mathematical model of tumor growthPhys Med Biol201257122524022156038
- DaySEKettunenMIGallagherFADetecting tumor response to treatment using hyperpolarized 13C magnetic resonance imaging and spectroscopyNat Med200713111382138717965722
- ParkIBokROzawaTDetection of early response to temozolomide treatment in brain tumors using hyperpolarized 13C MR metabolic imagingJ Magn Reson Imaging20113361284129021590996
- GallagherFAKettunenMIDaySEMagnetic resonance imaging of pH in vivo using hyperpolarized 13C-labelled bicarbonateNature2008453719794094318509335
- CudalbuCCommentAKurdzesauFFeasibility of in vivo 15N MRS detection of hyperpolarized 15N labeled choline in ratsPhys Chem Chem Phys201012225818582320461252
- GabellieriCReynoldsSLavieAPayneGSLeachMOEykynTRTherapeutic target metabolism observed using hyperpolarized 15N cholineJ Am Chem Soc2008130144598459918345678
- GallagherFAKettunenMIHuDEProduction of hyperpolarized [1,4-13C2]malate from [1,4-C-13(2)]fumarate is a marker of cell necrosis and treatment response in tumorsProc Natl Acad Sci U S A200910647198011980619903889
- KurhanewiczJVigneronDBBrindleKAnalysis of cancer metabolism by imaging hyperpolarized nuclei: prospects for translation to clinical researchNeoplasia2011132819721403835
- von MinckwitzGUntchMBlohmerJUDefinition and impact of pathologic complete response on prognosis after neoadjuvant chemotherapy in various intrinsic breast cancer subtypesJ Clin Oncol201230151796180422508812