
Abstract
Background
One in five people will eventually develop cancer, and one in eleven women will lose their lives to the disease. The main aim of this study is to determinants of survival time of women with breast cancer using appropriate Frailty models.
Methods
A study involving 632 Ethiopian women with breast cancer was conducted between 2018 and 2020, utilizing medical records from Felege-Hiwot Referral Hospital, the University of Gondar, and Dessie Referral Hospital. To compare survival, the Kaplan-Meier plot (s) and Log rank test were employed; to assess mean survival, one-way analysis of variance and the t test were utilized. The factors influencing women’s survival times from breast cancer were identified using the parametric shared frailty model and the accelerated failure time model.
Results
The median time to die for breast cancer patients treated at FHRH, UoGCSH, and DRH was 14.91 months, 11.14 months, and 12.32 months, respectively. The parametric model of shared frailty fit those who were statistically significant in univariate analysis. The results showed that survival of women with breast cancer was significantly influenced by age, tumor size, comorbidity, nodal status, stage, histologic grade, and type of primary treatment initiated. When comparing mean survival times between hospitals, the results showed a significant difference; patients who were treated in FHRH live significantly longer than patients treated in UoGCSH and DRH, whereas patients treated in UoGCSH have comparatively lower survival. Women with stage IV and comorbidities have 22.4% and 27.1% shorter expected survival, respectively.
Conclusion
This finding suggests that improving the availability and accessibility of radiation therapy and surgery, eliminating disparities between hospitals, raising awareness of early signs and symptoms of breast cancer and encouraging women to seek clinical help, and highlighting women with comorbidities at diagnosis are important ways to increase survival time.
Background
Breast cancer is the most common cancer in women and the main cause of death. Every minute, a woman dies from breast cancer somewhere in the world. Every day, more than 1400 women are killed.Citation1 After cardiovascular disease, breast cancer is the second-most common cause of death worldwide. An estimated 2,100,000 women are newly diagnosed with breast cancer, accounting for 24% of all cancers in women, and an estimated 630,000 women have died from breast cancer (15% of all cancer deaths).Citation2
In Africa, breast cancer is responsible for 28% of all cancers and 20% of all cancer deaths in women. Incidence rates are still generally low in Africa and are estimated to be below 35 per 100,000 women in most countries (compared to over 90–120 per 100,000 in Europe or North America).Citation3
Although breast cancer is more common in developed countries, more than half of new breast cancer diagnoses and about 60% of breast cancer mortality occur in developing countries, reflecting poorer survival prospects.Citation4
Breast cancer is becoming the most frequent cancer in Ethiopia, with significant rates of morbidity and mortality.Citation5 Breast cancer accounts for 15,244 (22.6%) of all cancer diagnoses and 8159 (17%) of cancer deaths per year.Citation6 Cancers affecting women, accounting for 22.6% of all cases, have significant public health and societal implications due to their prevalence in young or middle age.Citation5 Previous studies in Ethiopia showed limited knowledge about breast cancer, including about prevention, early detection, and treatment, among healthcare professionalsCitation7 and the general populationCitation8 are an additional risk factor. Notably, there are also studies conducted on the quality of life of breast cancer patients in the Amhara regionCitation9 reported, breast cancer care in the Amhara region is limited in terms of pathology, imaging, and the offered treatment modalities, which need to be improved. A comparable investigation evaluates the incidence and epidemiological description of breast cancer in this region, and it found that the incidence was increasing and becoming a major public health problem.Citation10
Despite the fact that the number of people living with breast cancer is increasing year after year, it has emerged as one of the fastest-growing noncommunicable illnesses and a serious public health challenge in developing nations such as EthiopiaCitation11 with a consequence of chronicity, disability, and death. Although the prevalence of breast cancer is increasing in Ethiopia and the study area, there are no explanatory studies that documented the area of risk of survival time due to breast cancer among breast cancer patients after receiving anti-cancer treatment using survival analysis to our knowledge. Patients’ data from three distinct hospitals in Ethiopia were used in this study: Felege-Hiwot Referral Hospital, University of Gondar Comprehensive specialty hospital, and Dessie Referral Hospital. Using data from many hospitals can provide more precise information of determinant factors and their impact on patient survival time.Citation12 Those are public hospitals at a different place and there are differences in treatment facilities and treatment teams, where event times of patients treated in the same hospital of residence are expected to be associated with each other, possibly due to sharing common unobserved characteristics, such as place-specific differences in environment, treatment resource or diagnosis of the patients. Furthermore, survival disparities observed across hospitals are likely to be due to variations in access to and quality of cancer care.Citation13 Finding variations in survival rates amongst hospitals might facilitate the development of improved cancer control systems by revealing weaknesses in systemic policy and program delivery.Citation12
This study examines prognostic factors affecting breast cancer survival in Ethiopia using data from three hospitals: FHRH, UoGRH, and DRH. The heterogeneous data structure resulting from treatment facilities and teams can affect cluster-specific effects and predictions.
The study aims to understand these factors using the shared frailty model, which models clustered correlated data between hospitals. We used the shared frailty model to compensate for hospital effects and estimate breast cancer patient survival times, as well as discover the prognostic factor that affects breast cancer survival and compare survival times between hospitals based on this appropriate model, which includes hidden factors.
In this study, survival times were examined for the patients who received treatment at Felege-Hiwot Referral Hospital, University of Gondar Comprehensive Specialized Hospital, and Dessie Referral Hospital, and the relative contributions of demographics, disease, and treatment factors were assessed using parametric shared frailty model. A frailty term was included to account for the association resulting from the cluster and the unobservable random effect. The estimated variability (unobserved heterogeneity) in the population (women breast cancer patients) of clusters (hospitals) based on the selected model.
Survival time is the most important tool for formulating cancer control strategies, prioritizing cancer control measures, evaluating the effectiveness and cost-effectiveness of these strategies, and studying progress in cancer diagnosis and treatment. However, there is very little evidence to support this in this region. Therefore, the results of this study should also help to fill this information gap. To reduce the rising incidence of breast cancer in the study setting, it is crucial to focus on modifiable risk factors and raise public awareness, for example, by promoting breast self-examination and implementing programs to improve women’s understanding.
Materials and Methods
Study Period
The starting point for follow-up is the time between December 1st, 2018 with first confirmed diagnosis of breast cancer and the endpoint is date of death, date of lost to follow up, date of last contact until January 30th, 2020, whichever comes first. All biological, clinical, pathological and treatment-related data were obtained from medical charts by review from cancer registries. Data was collected from March 20nd to May 30th, 2021.
Study Design
A facility-based retrospective follow-up study with survival analysis was conducted at FHRH, UoGCSH and DRH. All cases of breast cancer registered from December 1st, 2018 to January 30th 2020 in those three specialized hospitals were followed retrospectively until the end of the study (January 30th 2020).
Source Population
Source population all medical records of women diagnosed with breast cancer in FHRH, UoGCSH and DRH specialized hospital attending the oncology department.
Study Population
Study populations who fulfill the inclusion criteria of the study were considered as sampled populations.
Sample Size Determination in Survival Analysis
The sample size was all women breast cancer patients (who fulfill inclusion criteria) medical records diagnosed and treated at FHRH, UoGCSH, and DRH from December 1, 2018 to January 30, 2020.
Sampling Procedure
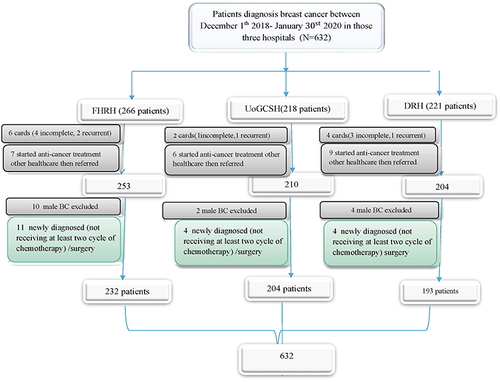
The following approach was followed while using the census sampling technique: profiles of all women with breast cancer who were being followed up in FHRH, UoGCSH, and DRH between December 1, 2018, and January 30, 2020, were first evaluated. A total of 266 patient charts were received from FHRH; of these, 31 charts were deemed unsuitable for inclusion in the study, leaving 232 charts in total. Information on 218 patients was gathered from UoGCSH. A total of 204 of these patients were part of the research. A total of 221 patient charts were acquired by DRH; of these, 22 were deemed unsuitable for inclusion in the study, leaving 193 charts intact. The medical record numbers of 705 patients were located during the study period. Data collectors collected 632 medical records that met the inclusion criteria from a list of breast cancer charts on cancer care follow-ups at the oncology department of DRH, UoGCSH, and FHRH. The data were taken from the medical records of 632 individuals, as demonstrates. The phone number is absent from each hospital’s 10, 7, and 4 patient cards, out of 632 patients with BC. A telephone interview was conducted with 561 patients or their close relatives who are older than 18 years old, out of the 611 cards that had a phone number. The rest of the phone call trials were not successful with three and more trials. Twenty of them did not respond for three call trials, 17 were mistaken phone numbers, and others were not functional.
Figure 1 Flowchart of the sampling procedure used to select the population, Ethiopia’s Amhara region, 2016 (n= 632).
Inclusion Criteria
This study includes all women of any age with BC who were diagnosed and treated at FHRH, UoGCSH and DRH cancer treatment center, with full information including study variables of interest in the medical records or chart during the study period were considered being eligible for the study. And we included women breast cancer patients who had received at least two or more cycles of chemotherapy, or who received surgical therapy irrespective of receiving chemotherapy.
Exclusion Criteria
This study excludes several patient groups: First, individuals with incomplete medical charts, encompassing cases lacking confirmation of breast cancer diagnosis or those with unspecified cancer stages. Additionally, patients whose medical records were unattainable are excluded. Furthermore, individuals newly diagnosed with breast cancer, defined as those who had not undergone at least two cycles of chemotherapy, are not part of this study. Also excluded are patients with a prior breast cancer diagnosis. Finally, individuals diagnosed with breast cancer at other healthcare facilities who commenced treatment there and were subsequently referred to FHRH, UoGCSH, and DRH for further care are not included in the analysis.
Survival Data Analysis
Statistical techniques for examining survival data are referred to as survival analysis. The response which is the amount of time before an event occurs is frequently referred to as a failure time, survival time, or event time. The survival time is the amount of time that passes between an initial event and a subsequent one. Time-to-event data, which is always nonnegative and has a positively skewed distribution, is the outcome variable of interest in survival analysis, which is often a set of statistical processes for data analysis. Survival analysis is significant when there are censoring data.Citation12 In reality, the variable time captures two distinct events. The survival time for participants who actually experienced the event in our case, death and the censored duration for participants who did not.
Accelerated Failure Time (AFT) Model
There are relatively few probability distributions for the survival time that may be employed with parametric models, despite the fact that these models are highly useful for the analysis of survival data. For the examination of survival time data in these circumstances, the accelerated failure time model (AFT) is an alternative to the PH model. Rather than measuring a hazard, we examined the direct impact of the explanatory variables on the survival time under AFT models. The fact that the parameters quantify the impact of the corresponding covariate on the mean survival time makes the results easier to interpret.
Accelerated Failure Time Frailty Model
To account for unobserved heterogeneity, the frailty term was first introduced byCitation13 in which it is an extension of proportional hazards. In a shared frailty model, the lifetimes of a group of observations in the same cluster share the same level of frailtyCitation12 that the common frailty variance measures of dependence among lifetimes within a cluster. Various studies were done on the choice of a continuous distribution of frailty random variables such as Gamma,Citation14 inverse Gaussian,Citation12 log-normal,Citation15 and positive stableCitation16 and few studies done on the discrete distributions.Citation17 However, for tractability reasons, the choice of distribution is limited to those that provide a close form expression for the frailty survivor function. For the continuous failure time model, the Gamma and the inverse-Gaussian distributions contain frailties.
Results and Discussions
Results
Explanatory Data Analysis
At the time of diagnosis, the mean age of the patients was 48.24 (SD=14.63) in DRH, 46.23 (13.245) in UoGRH, and 46.21 (SD=12.657) in FHRH. At the time of diagnosis, the mean age of the respondents was 46.3 years (SD=12.657). Out of 193 BC, women recruited to this study in DRH, the majority of them, 92 (47.7%) of the age group was greater than 50 years old were, the median age being 46 (IQR=57-37) years, whereas in FHRH and UoGRH most of the patients were between the age of 35–50 and greater than 50 years old with the median age being 46 (IQR=56-40) and 46.5 (IQR=59-39) years, respectively. The distribution of place of residence was almost the same in all hospitals, more of the participants were urban, and 26.0%, 27.5%, 31.6% of them were pre-menopause in respective hospitals. Concerning marital status, out of 232 patients, majorities 94 (40%) were married in FHRH, whereas most of the patients in UoGRH 85 (41.7%) and DRH 79 (40.9) were divorced. The study participants’ sociodemographic details are displayed in below.
Table 1 Felege Hiwot Referral Hospital Survival Classification for Socio-Demographic Covariates
Table 2 University of Gondar Comprehensive Specialized Hospital Survival Classification for Socio-Demographic Covariates
Table 3 Dessie Referral Hospital Survival Classification for Socio-Demographic Covariates
The Study Participants’ Clinical, Histological, and Therapeutic Features
At the time of diagnosis, 92 women (33.2%) had advanced stages (stages III and IV) and 143 women (60.8%) had early stages (stages I and II) of FHRH. Of them in UoGCSH, 91 (42.7%) were in the advanced phases and 113 (51.9%) were in the early stages. Similarly, 86 (46%) of the patients with DRH were diagnosed in the advanced stages, while 107 (54%) of the patients were in the early stages. Twenty-one patients have comorbidity in FHRH out of which, 5 (2.1%) have hypertension, 8 (3.4%) have renal (kidney) disease, 4 (1.7%) HIV, and the rest 4 (1.7%) have other diseases. In UoGCSH 27 patients have comorbidity out of which, 7 (3.4%) have hypertension, 8 (3.9%) renal (kidney) disease, 6 (2.9) have HIV and 6 (2.9) other, in DRH 47 patients have comorbidity out of which, the majority have renal (kidney) disease and hypertension. In UoGCSH 11 (5.4%) patients had been referred to another hospital, after taking more than two cycles of chemotherapy. Similarly, 8 (3.4%) in FHR and 13 (6.4%) in DRH are referred after they had more than two cycles of chemotherapy. A total of 66 (16.2%), 48 (20.1%), and 35 (19.7%) BC patients received breast surgery treatment in each hospital; 61 (37.9%), 63 (29.4%), and 68 (35.8%) BC patients received chemotherapy; and roughly 58 (28.9%), 64 (40.2), and 48 (29.0%) study participants were reported to have received hormone therapy in each hospital. Twenty-nine of patients with BC had taken radiation therapy at Tikur Anbesa Specialized Hospital from which 9 (3.8%) in FHRH, 6 (2.9%) in UoGCSH, and 14 (7.3%) in DRH. More than half, 150 (63.8%) of tumor size was less than 2.5cm on presentation, the tumor size ranged from 0.5 cm to 8 cm in diameter with a mean of 2.6cm with (SD = 1.48 cm).
In UoGRH eleven (5.4%) patients had referral paper from another hospital, after taking more than two cycles of chemotherapy. Similarly, eight (3.4%) in FHR and thirteen (6.4%) in DRH are referred after they had more than two cycles of chemotherapy. 38 (16.2%), 41 (20.1%), and 38 (19.7%) BC patients received breast surgery treatment in each hospital; 89 (37.1%), 60 (29.5%), and 69 (35.6%) BC patients received chemotherapy; and approximately 68 (28.1%), 82 (40.2%), and 56 (29.00%) study participants received hormone therapy in each hospital. At Tikur Anbesa Specialized Hospital, radiation therapy was administered to 28 patients with BC, of whom 9 (3.8%) were in FHRH, 6 (2.9%) in UoGRH, and 14 (6.9%) in DRH. At the time of presentation, less than half of the 150 tumors (63.8%) measured less than 2.5 cm in diameter. The tumors ranged in size from 0.5 cm to 8 cm, with a mean of 2.6 cm (SD = 1.48 cm). The study participants’ clinical, histological, and therapy characteristics are displayed in the tables below ().
Table 4 Felege Hiwot Referral Hospital Survival Classification for Clinical, Histologic, and Treatment Covariates
Table 5 University of Gondar Comprehensive Specialized Hospital Survival Classification for Clinical, Histologic, and Treatment Covariates
Table 6 Dessie Referral Hospital Survival Classification for Clinical, Histologic, and Treatment Covariates
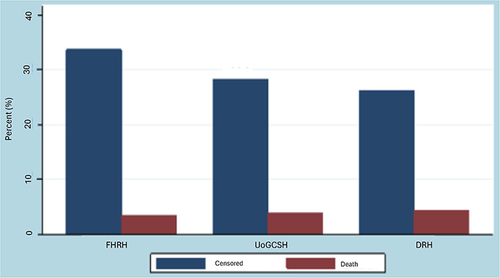
demonstrates that in all of the cases of breast cancer patients studied which included 235 (37.2%) from FHRH, 204 (32.3%) from UoGCSH, and 193 (30.5%) from DRH. From this 213 (33.7%) censored and 22 (3.5%) deaths in FHRH, 179 (28.3%) censored and 25 (4.0%) deaths in UoGCSH, and 166 (26.3) censored and 27 (4.3%) 178 deaths in DRH.
Figure 2 Classification of breast cancer survival proportions by hospital.
According to , the survival probability of an observation lasting more than 20 months is approximately 0.85 for FHRH patients, 0.72 for 180 UoGCSH patients, and 0.75 for DRH patients. Additionally, the likelihood that a woman with breast cancer will live for longer than 24 months is roughly 0.51 for DRH women, 0.27 for UoGCSH women, and 0.76 for FHRH women. The patients treated FHRH live significantly longer than patients treated at UoGCSH and DRH, while patients treated in UoGCSH comparatively have less survival.
Figure 3 Kaplan–Meier estimator survival probability of the three hospitals.
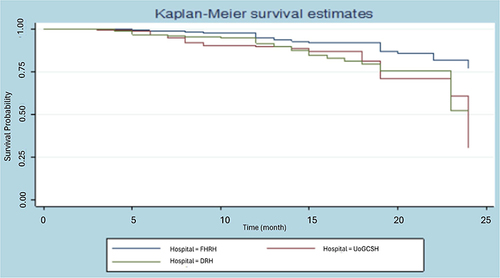
shows that the Wilcoxon test, which emphasizes early survival times, is less significant than the Log rank test, which gives greater weight to large survival durations. clearly shaw’s rank test for homogeneity unequivocally demonstrates that the survival times of the three hospitals varied significantly (p = 0.0150 for the Wilcoxon test and p = 0.0036 for the Log rank test).
Table 7 Test of Equality of Survivor Function Between Three Hospitals
Effect of Treatments on Survival Time of Breast Cancer Patients
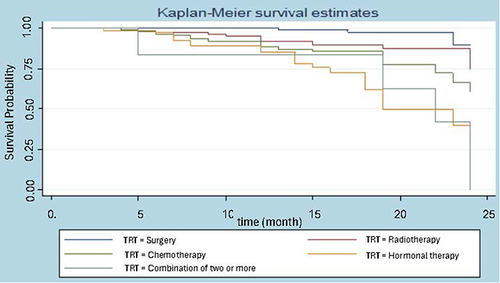
Considering the breast cancer survival data, we are interested in knowing how long women with breast cancer will survive after undergoing certain treatments. Treatments include surgery, radiotherapy, chemotherapy hormonal therapy, and a combination of more than two treatments. There is no median value reported for the survival of women who receive surgery and radiotherapy treatment, while women who are treated with hormonotherapy and combination have a median survival of 19 and 22 months, respectively. Surgery and radiotherapy treatments in follow almost the same path. For women diagnosed with breast cancer, the chances of surviving for more than 20 months are roughly 90% if they receive surgery and 80% if they receive radiation treatments; 76% if they receive more than two treatments combined; 62.5% if they receive chemotherapy; and 50% if they receive hormone therapy. A combination of more than two therapies had a slower effect on survival than surgery and radiotherapy alone, according to a non-parametric survival measure based on treatment.
Figure 4 Hospital wise survival classification.
The Kaplan–Meier (KM) Survival Curve for Different Groups
For every collection of variables, unique Kaplan–Meier survivor functions are constructed in order to examine any possible differences in surviving experience between the indicated categories. It is frequently the case that the group represented by the higher curve outlived the group represented by the lower curve when one survivorship function pattern lies above another. The following figure displays the generated K-M survival curve based on the breast cancer dataset. Take note that the survival time on this curve is expressed in terms of a month. ) below illustrates that there is a variation in age groups throughout the survival curve. According to these curves, BC patients under the age of 35 had the longest survival times compared to those between the ages of 35 and 50 and older than 50.
Figure 5 (A) and (B) The Kaplan-Meier survival curves for age and Tumor Size categories.
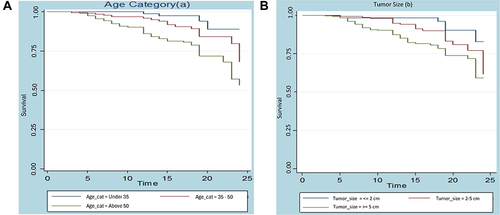
Furthermore, ) demonstrates that the survival curve varies depending on the size of the tumor. Compared to patients with tumor sizes less than 2 cm and 2–5 cm, patients with tumor sizes greater than 5 cm had the worst survival times, according to the curve. Conversely, patients with tumor sizes less than 2 cm had the best survival times, compared to those with tumor sizes between 2–5 cm and >5 cm.
There is a variation in the survival curve between histologic grades, as shown in ). The graph shows that BC patients with histologic grade III have the worst survival time when compared to patients with histologic grade I and II, and that patients with histologic grade II have a significantly different survival time when compared to patients with histologic grade I.
Figure 6 (A) and (B) The Kaplan-Meier survival curves for histologic grade and lymph node status.
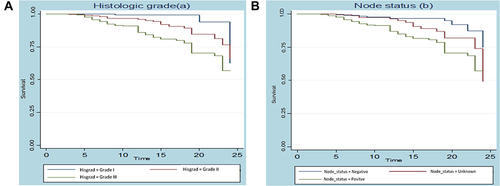
) indicates the survival probability by women’s lymph node status Vs time (in a month). This curve starts at one and continues horizontally until some month, at this time, it then drops down for both women who have positive, negative, and unknown lymph node status. But when time pass women who had positive lymph node status have the shortest survival time as compared to negative and unknown lymph node status.
) below shows that the existence of a difference between survival curves. The curve indicated that patients who were stage I had longer survival time than stage II, III, and IV, while patients who were stage IV had worse than stage II and III.
Figure 7 (A) and (B) The Kaplan-Meier survival curves for stages and comorbidity.
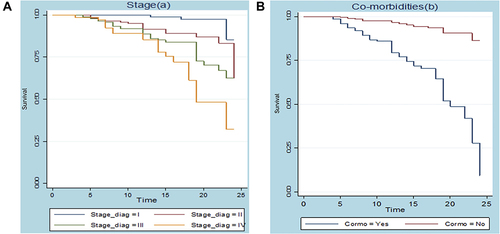
) also shows that the existence of a difference between survival curves. The plot indicated that patients who had no preexisting medical disorder had a longer survival time than those who had medical disorder (comorbidity).
Accelerated Failure Time Model Results
Model comparisons are presented in . Accordingly, it suggested that Lognormal-Inverse Gaussian shared frailty model was selected according to AIC and BIC. This indicates Lognormal-Inverse Gaussian shared frailty mode is a more efficient model to describe BC dataset.
Table 8 The Value of AIC and BIC for Multivariable Parametric Shared Frailty Models
Multivariable AFT Analysis
Multivariable AFT models of the Weibull, log-logistic, log-normal, and exponential distributions were fitted to the survival time data by incorporating all the covariates that show significance at a 10% level of the univariate analysis. The AIC was used to evaluate the differences in model efficiency. It is the most widely used criterion for choosing a model. A model with the lowest AIC value was favored based on AIC. Thus, when we incorporate all the covariates that are significant in the univariate analysis, the Log-normal AFT model (AIC = 527.674) was shown to be the best for the survival time of the breast cancer data set among the specified alternatives. Using the backward elimination strategy, covariates that lost significance in the multivariate analysis were eliminated from the model. So, factors including family history, place of residence, and menopause were ignored. Finally, a 5% significance level evaluation of the interaction factors’ impact in the multivariable log-normal AFT model showed that the effect was statistically insignificant. below lists all AFT models along with the associated AIC values.
Table 9 Comparison of AFT Models Using AIC Criteria
The output of the final log-normal AFT model is presented in , we found that the survival time of women with breast cancer was significantly affected by age of women (35-as reference category), tumor size (2 cm-as references), co-morbidity (no-co-morbidity-as reference category), node status (negative node status-as reference category), histologic grade (grade I-as reference category), stage (stage I-as reference category), and type of primary treatment initiated (chemotherapy-as reference). Under the log-normal AFT model, when the effect of other factors keep fixed, the estimated acceleration factor for women aged 35 to 50 and above 50 years is estimated to be 0.886 and 0.872 with (95% CI: 0.772,0.991) and (95% CI: 0.0.821,0.962), respectively. Therefore, compared to women with breast cancer patients who are younger than 35, the anticipated survival time for these patients drops by 11.4% and 13.8%, respectively, for those who are 35 to 50 and older than 50. The p-values are low (p-value=0.041 and p-value=0.001) and the 95% confidence interval for the acceleration factors of both age groups did not contain one, suggesting that both age groups have a substantial impact on the survival time of breast cancer patients who are women. Another important predictor of the patients’ survival duration is the kind of primary care they receive. In female patients receiving radiotherapy, surgery, and a combination of two or more, the estimated acceleration factor when the effect of other factors is fixed is estimated to be 1.162 (95% CI: 1.139, 1.597), 1.185 (95% CI: 1.127, 1.467), and 1.154 (95% CI: 1.301, 1.990), respectively. This suggests that the expected survival time increases by 16.2%, 18.5%, and 15.4% in comparison to women receiving chemotherapy. The fact that all p-values are small (p = 0.0001) and that the 95% confidence interval for the acceleration factor of each treatment group did not contain one suggests that the kind of primary therapy has a significant impact on the survival time of women. When all other variables are held constant, the estimated acceleration factor for women with breast cancer whose tumor diameters are between 2 and 5 cm and greater is estimated to be 0.864 (95% CI: 0.810–0.901) and 0.836 (95% CI: 0.825–0.899), respectively. As a result, women with breast cancer are likely to live shorter lives than those whose tumors are smaller than 2 cm. The acceleration factor of both tumor sizes in women with breast cancer did not have a 95% confidence interval, and the tiny p-values (p-value = 0.017 and p-value = 0.002) suggest that the survival time is significantly influenced by both age groups. When controlling for other variables, women with co-morbidity conditions had an estimated acceleration factor of 0.782 (95% CI: 0.634–0.867), meaning that their projected survival time is predicted to be 21.8% shorter than that of women without co-morbidity conditions. Co-morbidity appears to have a significant impact on the survival time of female breast cancer patients, as evidenced by the small p-value (p-value = 0.0001) and the absence of an acceleration factor in the 95% confidence range. The estimated acceleration factor for women in positive node status is estimated to be 0.883 (95% CI: 0.645–0.996) based on observation of the node status of breast cancer patients, holding other factors constant. In this scenario, the expected survival time decreases by 11.7% relative to women in negative node status. The p-value is low (p-value = 0.001), suggesting that women with positive node status had a significant impact on the survival time of women with breast cancer. The 95% confidence interval for the acceleration factor of these women did not contain one. Furthermore, the estimated acceleration factor for patients with histologic grade III is 0.866 (95% CI: 0.612, 0.926) when controlling for other variables. This suggests that the predicted survival time for these patients is 13.4% shorter than that of women with histologic grade 1. Lastly, the estimated acceleration factor for stages III and IV of breast cancer is estimated to be 0.725 (95% CI: 0.672, 306 0.897) and 0.637 (95% CI: 0.578, 0.745), respectively, based on the stages of women with breast cancer and maintaining the influence of other factors constant. As a result, compared to stage I, the anticipated survival time for women with breast cancer drops by 27.5% and 36.3% for those in stages III and IV, respectively. The p-values are low (p-value≤0.001 for both), suggesting that the tumor sizes of breast cancer patients have a major impact on their survival time. The 95% confidence interval for the acceleration factor of those three stages of the disease did not include one.
Table 10 Summary Results of the Final Log-Normal AFT Model
Parametric Shared Frailty Model Results
The primary goal of this study is to use the parametric shared frailty model to look at risk factors related to breast cancer patients’ survival times. Hospitals, the location where women receive their medications, were used as frailty terms to fit the four parametric baseline distributions with Gamma and inverse-Gaussian frailty distributions for the data set of breast cancer patients. We discovered that the frailty component significantly contributed to the mode and that the variance of the random effect was significant for all multivariable parametric shared frailty models based on the likelihood ratio test’s examination of unobserved heterogeneity. AIC and BIC were also used to choose the Lognormal-Inverse Gaussian shared frailty model. This shows that the model that best describes the breast cancer dataset is the lognormal-inverse Gaussian shared frailty model.
shows the final results for the lognormal-inverse-Gaussian shared frailty model. Age, histologic grade, type of treatment, stage, tumor size, co-morbidities, and node status are found to be significant at the 5% significance level, while marital status, place of residence, menopause, breastfeeding, and family history are not significantKeeping other factors constant, the estimated acceleration factor of women aged 35 to 50 and above 50 years with breast cancer is 0.893 (95% CI: 0.821–0.982) and 0.880 (95% CI: 0.831–0.951), respectively, according to the Lognormal inverse-Gaussian frailty model. Thus, the expected survival time for women with breast cancer patients aged 35 to 50 years and above 50 years decreases by 10.7% and 12%, respectively, when compared to women patients aged less than 35 years. The estimated acceleration factor for women who received surgery and radiation is estimated to be 1.084 (95% CI: 1.032,1.196) and 1.074 (95% CI: 1.025,1.186) for each, respectively, based on our observation of the primary treatment initiated by women with breast cancer patients, holding the effect of other factors constant. This suggests the expected survival time is 8.4% and 7.4% higher than the reference group (chemotherapy). The women who had undergone both radiotherapy and surgery did not have an acceleration factor within the 95% confidence interval. The p-value for both scenarios is small (p-value = 0.002 and p-value = <0.001), suggesting that these women had a significant impact on the survival time of breast cancer patients. The other treatment group did not significantly vary from the baseline, though, at the 5% level of significance. The positive sign of the coefficients suggests that women who underwent surgery and radiotherapy did better than those who got chemotherapy, and that the anticipated time required to treat breast cancer increases in tandem with the lognormal survival time. On the other hand, the estimated acceleration factor for women with breast cancer patients with tumor sizes ranging from 2 to 5 and above 5 cm is estimated to be 0.882 (95% CI: 0.860–0.904) and 0.853 (95% CI: 0.847–0.932), respectively, taking into account the tumor size and holding other parameters constant. Thus, for women with breast cancer, the anticipated survival time is decreased by 11.8% for those with a tumor size of 2 to 5 cm and by 14.7% for those with a tumor size larger than 5 cm, in comparison to a tumor size of 2 cm. Given the tiny p-values (p-value = 0.035 and p-value = 0.012), it may be concluded that patients’ survival times are significantly influenced by both tumor sizes. The estimated acceleration factor for women with positive node status is estimated to be 0.882 (95% CI: 0.724, 0.913) when we look at the node status of breast cancer patients, holding the effect of other factors constant. This means that the expected survival time is 11.8% lower for these women than for those with negative node status. The p-value is low (p-value = 0.027), suggesting that women with positive node status had a substantial impact on the survival time of women with breast cancer. The 95% confidence interval for the acceleration factor of women’s positive node status did not contain one. When co-morbidities are taken into account and other covariates are controlled for the estimated acceleration factor for these women is 0.729 (95% CI: 0.684, 0.813), meaning that their anticipated survival time is 27.1% shorter than that of women without co-morbidities. The length of patient survival is significantly impacted by these females with the co-morbid illness. In contrast, the estimated acceleration factor for patients with histologic grade III is estimated to be 0.884 [95% CI: 0.672, 0.913] for those patients, assuming that all other factors remain constant. This suggests that the expected survival time for these patients is 11.6% shorter than that of women with histologic grade I, while histologic grade II is negligible in comparison to grade I. Lastly, the estimated acceleration factor for stages III and IV of breast cancer in women is estimated to be 0.818 (95% CI: 0.701–0.820) and 0.776 (95% CI: 0.711–0.809), respectively, holding the influence of other factors constant. As a result, for women in stages III and IV of the disease, respectively, the anticipated survival time drops by 18.2% and 22.4% when compared to stage I. Stage III and stage IV of breast cancer have a significant impact on the survival time of women with breast cancer compared with patients who were in stage I, as evidenced by the small p-values (p-value = 0.001 and p-value =<0.001) and the absence of an acceleration factor in the 95% confidence interval for those three stages of the disease. However, stage II did not significantly vary from the reference group (stage I) at the 5% level of significance.
Table 11 Summary Result for the Final Log-Normal Inverse-Gaussian Frailty Models
Discussion
In this work, we used data from three referral hospitals in the Amhara area of Ethiopia to develop parametric shared frailty models, compare breast cancer survival times, and look at determining factors affecting breast cancer survival times. A model with a low AIC was deemed to be the best in this study, which used the AIC criteria for comparison.Citation18
We first used the non-parametric Kaplan–Meier method to analyze the breast cancer data, and then we did parametric univariate and multivariate approaches. We modeled the data using exponential, Weibull, log-logistic, and log-normal models in parametric survival modeling. Age, histologic grade, type of treatment received, stage, tumor size, co-morbidities, node status, place of residence, menopause, and family history were all significant predictive factors for survival time in all univariate analyses of the AFT model patients. However, marital status and 396 family history were not significant at the 10% level of significance. Following a log-normal AFT analysis of the given data set, parametric shared frailty models were fitted by assuming an inverse-Gaussian distribution for frailty terms. In general, known variables cannot account for every variation in survival time. Frailty is the effect of unobserved variables on a patient’s riskCitation19 since patients in the same hospital relatively have some shared factors such as treatment methods, treatment teams, environment, and therapeutic equipment cause a correlation between patients at each hospital. The effect of clustering (unobserved heterogeneity) between the clusters was assessed using the likelihood ratio test, and the results revealed that the variance of the random term is statistically significant at the 5% level of significance in all shared models with all baselines. This showed that we have to include the effect of random terms in the models since the unobserved heterogeneity within regions cannot be ignored. A log-normal inverse-Gaussian distribution shared frailty model was selected based on AIC values. The frailty model aims to assess reliance or correlation within the same hospitals in addition to accounting for variation across various hospitals. Hospital dependence, as determined by Kendall’s tau (τ) (0.564), peaked at the highest values of (0.831). Lastly, a comparison was made between the two models: log-normal inverse-Gaussian shared frailty and log-normal AFT. The introduction of frailty components led to modest improvement in the parameter estimates, but overall the results from the AFT and frailty models were rather similar. Compared to the log-normal AFT model, the log-normal inverse-Gaussian frailty model provided a superior fit for the breast cancer dataset. The results of this study showed that patients’ age significantly influences their breast cancer survival time, which gets shorter as they age. As controlling for other variables, the estimated survival time for women with breast cancer patients falls by 10.7% and 12%, respectively, for those who are 35 to 50 years old and above 50 years old, as compared to those who are 422 years old or younger. This result is comparable to a study by,Citation20 which demonstrates that the anticipated survival duration of patients with breast cancer fell by 14.20% and 17.70% for women between the ages of 31 and 49 and 50 and above 50 compared with women with patients under 30 years of age. Age bracket above 35: Survival duration shortens. This is due to the fact that there are more opportunities for genetic harm (mutations) in the body the longer we live. Furthermore, our bodies’ capacity to repair genetic damage decreases with age (428).Citation21
Our research also demonstrates that a woman’s survival time after being diagnosed with breast cancer is significantly influenced by her cancer’s stage. The anticipated life times for patients with stages III and IV are, respectively, 18.2% and 22.4% shorter than those of the reference group (stage I) when all other parameters are held constant. This suggests that patients in stages I, II, and IV have shorter survival times. In this study, overall survival declines with increasing clinical stage, which is also consistent with.Citation22 In a similar vein, studies conducted in Ghana discovered that patients with disease in its early stages (stages I and II) at diagnosis have a better prognosis than those with later stages (III & IV).Citation23 This result is also similar to a study done in India;Citation24 that shows the survival time of stage I and stage II breast cancer patients are similar, but the survival time of stage III and stage IV patients is lower. This study is similar to another one,Citation20 which is slightly higher but still consistent in demonstrating that, when comparing stages II, III, and IV to stage I, the expected survival time for women with breast cancer decreases by 42.90%, 53.20%, and 60.30%. Women with breast cancer who had tumors 2.5 cm or larger lived shorter lives than those whose tumors were smaller than 2 cm, despite the fact that there was a negative link between tumor size and survival time. Most of the studies have reported a statistically significant association between tumor size and survival time.Citation20,Citation23 According to the study’s findings, the estimated acceleration factor for female breast cancer patients with tumor sizes between 2 and 5 cm and larger is estimated to be 0.882 and 0.853, holding the influence of other parameters constant. Therefore, compared to patients whose tumors are smaller than 2 cm, the expected survival time for women with breast cancer decreases by 11.8% for tumors ranging from 2 to 5 cm and 14.7% for tumors larger than 5 cm. This suggests that both tumor sizes have a significant impact on the survival time of women with breast cancer. This result is also in agreement with the finding in IranCitation20 which notes that the size of the tumor and the number of nodes involved are significantly associated with survival time. This is also consistent with previous research showing that the expected survival time for breast cancer patients decreases by 8.50% for tumor sizes between 2 and 5 cm and by 9.40% for tumor sizes larger than 5 cm when compared to women with breast cancer patients whose tumors are smaller than 2 cm.Citation20,Citation24 The anticipated survival time is 11.8% shorter for women with positive node status than for those with negative node status, despite the fact that positive node status also has a substantial impact on breast cancer. Additionally, this outcome is in line with.Citation25 The finding that women with positive lymph node status had a shorter survival time than those with negative node status is also in line with this; having cancer cells in the lymph nodes under your arm suggests a higher risk of the disease spreading and a shortened survival period for breast cancer. The study’s findings also imply that, for patients with histologic grade III, the estimated acceleration factor is estimated to be 0.884; this means that, compared to women with histologic grade I, the expected survival time increased by 11.6%, indicating that the survival period of these patients was prolonged. The majority of research has shown a statistically significant correlation between patients’ histologic grades and survival times.Citation26 As a result, co-morbidities conditions also significantly impacted patients’ survival times; women with co-morbidities conditions may anticipate to live 27.1% shorter lives than women without co-morbidities conditions. This is also consistent with the findings of a prior studyCitation27 in Canada which found that those with co-morbidities had a shorter survival duration. Nevertheless, we found that radiation and surgery were highly important predictors of a patient’s length of survival with breast cancer. The anticipated survival duration increased by 7.4% and 8.4% in comparison to the chemotherapy reference group. This finding was similar to other studies.Citation27,Citation28
A studyCitation29 conducted at UMMC showed that women who received surgery had a longer survival period. Meanwhile, a meta-analysis conducted in IndiaCitation30 also showed that surgical and radiotherapy treatment was associated with a longer survival time. On the other hand, this study showed no evidence of a significant correlation between the patients’ survival time with breastfeeding or family history. Most studies reported a statistical association between family history and breast cancer survival time.Citation23,Citation31,Citation32 This finding, however, is in line with the results of an earlier, comparable study carried out in Vietnam, which discovered no meaningful correlation between family history and breast cancer survival time.Citation33 Breastfeeding was also insignificant in this study, this result was consistent with the results of studies conducted in Brazil,Citation34 but this contradicts with the findings of the research in India.Citation35 Further research using high-level methodologies may be required to investigate the link between family history, breastfeeding, and breast cancer survival time. The lognormal-inverse Gaussian shared frailty model also showed that menopause and place of residence were additional covariates not significantly associated with survival time which was inconsistent with the result of.Citation36
Conclusions
A study found that 38.48% of 632 women who started breast cancer treatment died at the end of the study. Women with FHRH had a higher chance of survival than those treated in UoGCSH and DRH. The study looked at different therapies, including surgery, radiation, chemotherapy, hormone therapy and combinations of treatments. Patients who were treated with surgery and radiation had a higher chance of survival than those who were treated with more than two treatments together. The study found that age at diagnosis, lymph node status, histological grade, type of main therapy, tumor size, comorbidities and stage were significant predictors of patient survival. The cluster effect, or unobserved heterogeneity between hospitals, was a key factor in predicting survival time. This study’s limitations could be addressed by enhancing the comprehensiveness of findings through a prospective design and conducting a follow-up study to identify additional predictors of survival time, including financial concerns, treatment adherence, and social and healthcare-related factors.
Ethics Approval and Informed Consent
The data for the analysis were obtained from three referral hospitals, namely FHRH, UoGCSH, and DRH, and a paper of approval was obtained from Gondar University, College of Natural Science, Research Ethics Review Board (Reference Number 05/08/1234/2022) and was performed according to the declaration of Helsinki. The College of Natural Science wrote an official letter of cooperation to Felege-Hiwot Referral Hospital (FHRH), the University of Gondar Comprehensive Specialized Hospital (UoGCSH), and Dessie Referral Hospital (DRH). Written informed consent was obtained from all participants. As the study was conducted through a review of medical records, the individual patients were not subjected to any harm as long as confidentiality was maintained. After entering the computer, the data was locked by password; names and card numbers were not included in the data collection format, and the data was not disclosed to any person other than the principal investigator.
Disclosure
The authors declare that they have no competing interests.
Acknowledgment
The authors would like to express their sincere gratitude to the anonymous reviewers for their careful reading of the text and their insightful comments, which helped to improve the presentation of this paper.
Data Sharing Statement
The datasets used and/or analysed during the current study are available from the corresponding author on reasonable request.
References
- Komen SG. Breast Cancer Fact Sheet; 2018. Available from: https://www.komen.org/uploadedFiles/Komen/Content/AboutUs/MediaCenter/Newsroom/breast-cancer-fact-sheet-august-2018.pdf. Accessed May 21, 2024.
- Bray F, Ferlay J, Soerjomataram I, Siegel RL, Torre LA, Jemal A. Global cancer statistics 2018: GLOBOCAN estimates of incidence and mortality worldwide for 36 cancers in 185 countries. CA. 2018;68(6):394–424. doi:10.3322/caac.21492
- Clegg-Lamptey JN. Epidemiology of Breast Cancer in Africa. Accra-Ghana: School of Medicine and Dentistry. University of Ghana; 2017.
- Jemal A, Bray F, Center MM, Ferlay J, Ward E, Forman D. Global cancer statistics. CA. 2011;61(2):69–90. doi:10.3322/caac.20107
- Timotewos G, Solomon A, Mathewos A, et al. First data from a population based cancer registry in Ethiopia. Cancer Epidemiol. 2018;53:93–98. doi:10.1016/j.canep.2018.01.008
- Memirie ST, Habtemariam MK, Asefa M, et al. Estimates of cancer incidence in Ethiopia in 2015 using population-based registry data. J Glob Oncol. 2018;4(4):1–11. doi:10.1200/JGO.17.00175
- Lemlem SB, Sinishaw W, Hailu M, Abebe M, Aregay A. Assessment of knowledge of breast cancer and screening methods among nurses in university hospitals in Addis Ababa, Ethiopia, 2011. In: International Scholarly Research Notices. Hindawi; 2013.
- Legesse B, Gedif T. Knowledge on breast cancer and its prevention among women household heads in Northern Ethiopia. Open J Prev Med. 2014;04(01):32–40. doi:10.4236/ojpm.2014.41006
- Mohd-Zahid MH, Mohamud R, Abdullah CAC, et al. Colorectal cancer stem cells: a review of targeted drug delivery by gold nanoparticles. RSC Adv. 2020;10(2):973–985. doi:10.1039/C9RA08192E
- Tesfaw A, Demis S, Munye T, Ashuro Z. Patient delay and contributing factors among breast cancer patients at two cancer referral centres in Ethiopia: a Cross-Sectional Study. J Multidiscip Healthc. 2020;13:1391. doi:10.2147/JMDH.S275157
- Kantelhardt EJ, Zerche P, Mathewos A, et al. Breast cancer survival in Ethiopia: a cohort study of 1070 women. Int J Cancer. 2014;135(3):702–709. doi:10.1002/ijc.28691
- Aalen O, Borgan O, Gjessing H. Survival and Event History Analysis: 582 a Process Point of View. Springer Science & Business Media; 2008.
- Hougaard P. Modelling heterogeneity in survival data. J Appl Probab. 1991;28(3):695–701. doi:10.2307/3214503
- Van den Berg GJ. Duration models: specification, identification and multiple durations. In: Handbook of Econometrics. Vol. 5. Elsevier; 2001:3381–3460.
- Bennett S. Analysis of survival data by the proportional odds model. Stat Med. 1983;2(2):273–277. doi:10.1002/sim.4780020223
- Hougaard P. Survival models for heterogeneous populations derived from stable distributions. Biometrika. 1986;73(2):387–396. doi:10.1093/biomet/73.2.387
- Caroni C, Crowder M, Kimber A. Proportional hazards models with discrete frailty. Lifetime Data Anal. 2010;16(16):374–384. doi:10.1007/s10985-010-9151-3
- Munda M, Rotolo F, Legrand C. parfm: parametric frailty models in R. Journal of Statistical Software. 2012;51(11):1–20. doi:10.18637/jss.v051.i11
- Rueten Budde AJ, Putter H, Fiocco M. Investigating hospital heterogeneity with a competing risks frailty model. Stat Med. 2019;38(2):269–288. doi:10.1002/sim.8002
- Sharma R. Breast cancer incidence, mortality and mortality-to-incidence ratio (MIR) are associated with human development, 1990–2016: evidence from Global Burden of Disease Study 2016. Breast Cancer. 2019;26(4):428–445. doi:10.1007/s12282-018-00941-4
- Weiss MC, Ruderman J A Step-By-Step Guide to Reducing Your Risk of Breast Cancer; 2011.
- Allemani C, Weir HK, Carreira H, et al. G lobal surveillance of cancer survival 1995–2009: analysis of individual 611 data for 25 887 patients from 279 population-based registries in 67 countries (Concord-2). Lancet. 2015;385(9972):977–1010. doi:10.1016/S0140-6736(14)62038-9
- Abedi G, Janbabai G, Moosazadeh M, Farshidi F, Amiri M, Khosravi A. Survival rate of breast cancer in Iran: a meta-analysis. Asian Pac J Cancer Prev. 2016;17(10):4615–4621. doi:10.22034/apjcp.2016.17.10.4615
- Fisch T, Pury P, Probst N, et al. Variation in survival after diagnosis of breast cancer in Switzerland. Ann Oncol. 2005;16(12):1882–1888. doi:10.1093/annonc/mdi404
- Michaelson JS, Silverstein M, Sgroi D, et al. The effect of tumor size and lymph node status on breast carcinoma lethality. Cancer. 2003;98(10):2133–2143. doi:10.1002/cncr.11765
- Alotaibi RM, Guure C. Bayesian and Frequentist Analytical Approaches Using Log-Normal and Gamma Frailty Parametric Models for Breast Cancer Mortality. Comput Math Methods Med. 2020;2020:1–11. doi:10.1155/2020/9076567
- Patnaik JL, Byers T, DiGuiseppi C, Denberg TD, Dabelea D. The influence of comorbidities on overall survival among older women diagnosed with breast cancer. J National Cancer Inst. 2011;103(14):1101–1111. doi:10.1093/jnci/djr188
- Yazdani A, Yaseri M, Haghighat S, Kaviani A, Zeraati H. Investigation of Prognostic Factors of Survival in Breast Cancer Using a Frailty Model: a Multicenter Study. Breast Cancer. 2019;13:1178223419879112. doi:10.1177/1178223419879112
- Pathy NB, Yip CH, Taib NA, et al. Breast cancer in a multi-ethnic Asian setting: results from the Singapore–Malaysia hospital-based breast cancer registry. Breast. 2011;20:S75–S80. doi:10.1016/j.breast.2011.01.015
- Ruiterkamp J, Voogd AC, Bosscha K, Tjan-Heijnen VC, Ernst MF. Impact of breast surgery on survival in patients with distant metastases at initial presentation: a systematic review of the literature. Breast Cancer Res Treat. 2010;120(1):9–16. doi:10.1007/s10549-009-0670-0
- Baghestani AR, Moghaddam SS, Majd HA, Akbari ME, Nafissi N, Gohari K. Survival analysis of patients with breast cancer using Weibull parametric model. Asian Pac J Cancer Prev. 2016;16(18):8567–8571. doi:10.7314/APJCP.2015.16.18.8567
- Ruder AM, Moodie PF, Nelson NA, Choi NW. Does family history of breast cancer improve survival among patients with breast cancer? Am J Clin Exp Obstet Gynecol. 1988;158(4):963–968. doi:10.1016/0002-9378(88)90103-2
- Trieu PDY, Mello-Thoms C, Peat JK, Do TD, Brennan PC. Risk factors of female breast cancer in Vietnam: a case-control study. Cancer Res Treat. 2017;49(4):990. doi:10.4143/crt.2016.488
- Tessaro S, B´eria JU, Tomasi E, Victora CG. Breastfeeding and breast cancer: a case-control study in Southern Brazil. Cadernos de Sa´ude P´ublica. 2003;19(6):1593–1601. doi:10.1590/S0102-311X2003000600004
- Pakseresht S, Ingle GK, Bahadur AK, et al. Risk factors with breast cancer among women in Delhi. Indian J Cancer. 2009;46(2):132. doi:10.4103/0019-509X.49151
- Kwes AAS, Isaac NM, CharlesKojo A, Richard A. Determination of Predictor Variables Contributing to the Survival of Prostate Cancer Patients in Komfo Anokye Teaching Hospital, Ghana. Int J Appl. 2014;4(6).