
Abstract
Purpose
This study interrogates the molecular status of individual cells in patients with triple-negative breast cancers and explores the molecular identification and characterization of these tumors to consider the exploitation of a potential-targeted therapeutic approach.
Patients and methods
Hyperspectral immunologic cell by cell analysis was applied to touch imprint smears obtained from fresh tumors of breast cancer patients.
Results
Cell by cell analysis confirms significant intratumoral molecular heterogeneity in cancer markers with differences from polymerase chain reaction marker reporting. The individual cell heterogeneity was recognized in adjacent cells examined with panels of ten molecular markers in each single cell and included some markers that are considered to express “stem-cell” character. In addition, heterogeneity did not relate either to the size or stage of the primary tumor or to the site from within the cancer.
Conclusion
There is a very significant molecular heterogeneity when “adjacent cells” are examined in triple-negative breast cancer, thereby making a successful targeted approach unlikely. In addition, it is not reasonable to consider that these changes will provide an answer to tumor dormancy.
Introduction
Tumor heterogeneity has been recognized for years as best delineated by examination of the primary tumor and comparison to the findings at metastatic sites.Citation1 Greater focus implicated significance within a given tumor and then the progressive development of contemporary tools to characterize cancers has identified intratumoral heterogeneity and branched evaluation by multiregion sequencing.Citation2,Citation3 It is clear that a single-tumor biopsy underestimates the nature of the diversity in any given tumor, and thereby amplifies the concerns over the diagnostic template upon which our therapeutic decisions and approaches are determined. Thus, we may fail to fully identify the true nature of the cancer.Citation4,Citation5 Even genome and exome sequencing have failed to define a clinically applicable, focused approach for the treatment of a given tumor, at least to date.Citation6,Citation7
The availability of a single applicable system for individual cell evaluation in a given tumor suggested the potential to better identify and characterize such heterogeneity using identifiable molecular markers that could be available or sought for possible therapeutic use. Hyperspectral microscopic imaging (HMI) provided just such an opportunity for a highly focused analysis of a given tumor with that concept in mind.Citation8 We have developed panels of molecular markers, generally ten to a panel, relevant for breast, colon, and prostate cancers, and for the evaluation of breast cancer, we have two such panels. The unique feature of the HMI is that it can record the entire emission spectra from a single given cell in a single pass. Furthermore, the ability to evaluate many molecular markers in a given single cell provides an opportunity to further explore the complexity of heterogeneity by viewing “cells next to each other.”
For this exploration, we selected “triple-negative” (TN) breast cancerCitation9–Citation13 (TNBC), a particularly difficult tumor to treat, characterized by molecular heterogeneity and one for which only very slow advances in therapeutic strategy have been experienced. “Subtyping” of TNBC by gene expression profilingCitation13–Citation18 has led to a very limited clinical-delineated classification.
We embarked on the exploitation of the HMI with an interest in defining potential molecular markers that may provide therapeutic targets. Additionally, we wanted to determine the presence of breast cancer “stem cells” in the (primary) tumor using this technique in order to better characterize these tumors.
Materials and methods
Patient selection and sample preparation
Specimens were obtained from the tissue of patients with documented histological diagnosis of invasive breast carcinoma and from normal controls. Pertinent demographic and clinical data were recorded for every patient. The study conformed to the ethical guidelines for human and animal research of the University of Texas System and the (US) National Institutes of Health. All specimens were obtained with an informed consent and collected using the protocols approved by the Institutional Review Board at the University of Texas Southwestern Medical Center, Dallas, TX. Multiple-touch preparations were obtained from each examined tumor mass.
Hyperspectral immunohistologic analysis
Panels of molecular targets were selected that allowed each “member” of the panel (usually containing nine to eleven moieties) to examine each individual cell.Citation8 A list of one such panel of molecular targets is shown in . The amount of each antibody–fluor conjugate to be applied to each imprint TP slide was predetermined by using control cell lines and a normal tissue sample to identify the quantitative emission level for the overexpression of each protein.Citation8 The primary targets selected were considered for possible therapeutic agents directed against TN cancers. These included urokinase plasminogen activator surface receptor (uPAR), cluster of differentiation 133 (CD133), notch homolog 1 (Notch1), acetaldehyde dehydrogenases 1 (ALDH1), CD24, CD44, Ki67, and Twist. Some of these (ie, ALDH1, CD24, CD44, CD133) were included because they reflected probable “stem cell” features.
Table 1 Hyperspectral immunologic panels
A target antibody may be conjugated to different fluors in different panels, which allows for a constrained series or for selected evaluation of a given target. The purpose of a negative control cell line was to determine the onset of the nonspecific binding concentration and the background of residual fluors on a slide. The purpose of a positive control cell line was to determine the amount of conjugate that provides an intensity level of the same order of magnitude as other positive conjugates. For most of the conjugates, a plot of the two control cell measurements showed a definitive gap between the negative and positive control cell measurement data. All counts above these thresholds indicate significant overexpressed proteins relative to the positive control cell line. In a sense, since these threshold numbers related to intensity and brightness, a measurement at twice the value means a cell would appear twice as bright to the eye. The HMI measurements, however, provide a quantitative means to determine that the moiety in a cell is overexpressed or is highly overexpressed. These measurements can also relate to the pathologist’s somewhat crude 2+ and 3+ qualitative scores, but the HMI provides data that is both quantitative and reproducible.Citation8
Scanning starts with the location of a cytokeratin positive, that is, epithelial cell and manually setting the focus of the microscope. The first scan pass of the cell collects the continuous spectrum from 420 nm to 780 nm.Citation8 The continuous spectrum is necessary for the linear algebra algorithm to separate the spectrum into its component spectra for each conjugate fluor used in the assay panel, a procedure termed spectral deconvolution.Citation8
The second pass uses an AF488-specific excitation/emission filter cube to record only the cytokeratin staining of the cell. Since this purpose is to provide an image in the analysis program to outline the limits of the cell and not for a quantitative measurement, any bleaching of the fluors from the first scan is irrelevant.
The analysis program output of the first pass is provided as counts/sec/pixel for each marker in each pixel of the cell image. The analysis operator can then outline another cell in the same data cubes or go on to another data file. The data can be presented in different forms such as images of the cells with false colors and intensity for each marker, bar graphs of markers, tables by marker, or scatter plots.Citation8
The emission levels of each marker have been normalized to 20 counts/second/pixel threshold between under and overexpressed.
Statistical analysis
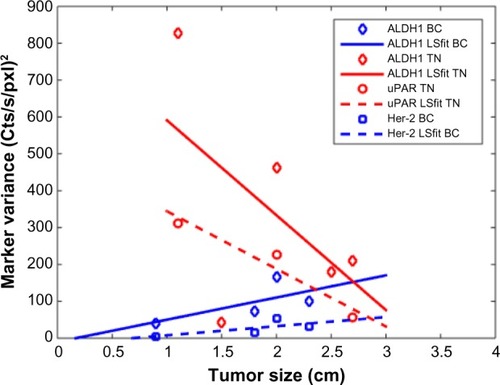
Each of the marker expression distributions was tested for a normal distribution using the Anderson–Darling formulation.Citation20 Most of the markers do not fit a normal distribution at the 5% confidence level, thereby informing us of true heterogeneity. The variance was used to compare the degree of heterogeneity of the expression levels from patient-to-patient. In particular, shows the variance of the expression for markers that indicate a relationship to tumor size. There are low, but significant, correlations with marker heterogeneity. There is an inverse linear relation to tumor size for TN patient ALDH1 and uPAR, while there is a linear increase with tumor size for BC patient ALDH1 and Her-2.
Figure 1 Comparison of expression heterogeneity using the distribution variance with patient tumor size for the markers: ALDH1, uPAR, and Her-2.
Abbreviations: ALDH1, acetaldehyde dehydrogenases 1; uPAR, urokinase plasminogen activator surface receptor; Her-2, human epidermal growth factor receptor 2; BC, breast cancer; TN, triple-negative; LSfit, least squares fit; Cts/s/pxl, counts/second/pixel.
Results
The percentages of cells for each marker that was overex-pressed (the pathologist’s 2+) and highly overexpressed (pathologists 3+) are shown in . The percentages are relative to all the measured cells per patient. The table also provides the overall averages for the marker for all the patients in this series.
Table 2 Fraction of overexpressed cells for each marker
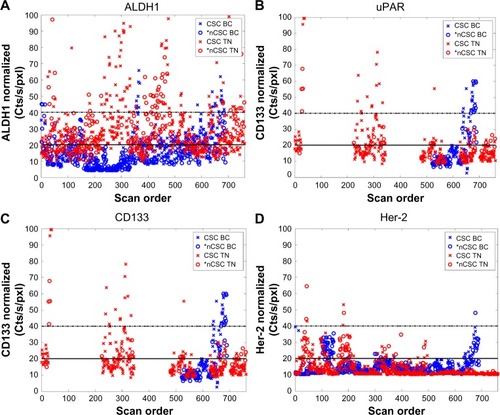
The patient cell data plotted for the ALDH1, uPAR, CD133, and Her-2 markers are shown in . The makers are plotted versus their scan number. There was no significant change over time. The expression for ALDH1 and uPAR is significantly more heterogeneous for TN than for BC patients. For CD133, the heterogeneity is about equal for both. Two of six TNBC patients examined with the HMI identified Her-2-positive cells with heterogeneity as seen in four breast cancer patients who were not TN, but defined as Her-2 negative by our breast pathology team. This evidence of cells with overamplified Her-2 led to a reexamination of the tissues by them, and they, as expected in our designated Comprehensive Cancer Center by the National Cancer Center of the (US) National Institutes of Health; utilize the updated practice guidelines for Her-2 receptor testing.Citation10 The specimens were negative by these criteria, in spite of these random cells with overexpression.
Figure 2 Cell marker expression of ALDH1, uPAR, CD133, and Her-2.
Abbreviations: ALDH1, acetaldehyde dehydrogenases 1; uPAR, urokinase plasminogen activator surface receptor; CD133, cluster of differentiation 133; Her-2, human epidermal growth factor receptor 2; CSC, cancer stem cells; Cts/s/pxl, counts/second/pixel; BC, breast cancer; TN, triple-negative.
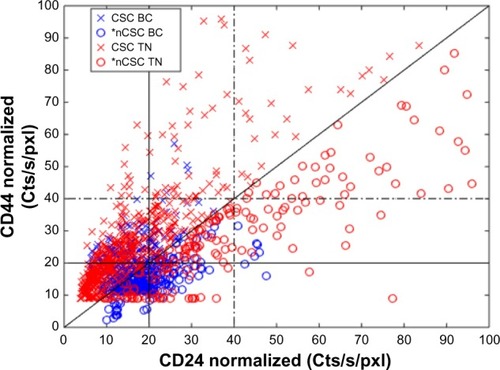
Molecular characterization and features that imply “cancer stem cellness” (CSC) were examined for CD44 and CD24. Those above the diagonal line indicate CD44 high and CD24 low features of presumed CSC’s as shown in . It is clear that the heterogeneity of CD44/CD24 expression in the touch preparations from the TNBC patients is more than from the BC patients.
Figure 3 CD44 versus CD24 expression for all cells for both hormonal receptor positive and TNBC patients.
Abbreviations: BC, breast cancer; TN, triple-negative; CSC, cancer stem cells; CD, cluster of differentiation; Cts/s/pxl, counts/second/pixel.
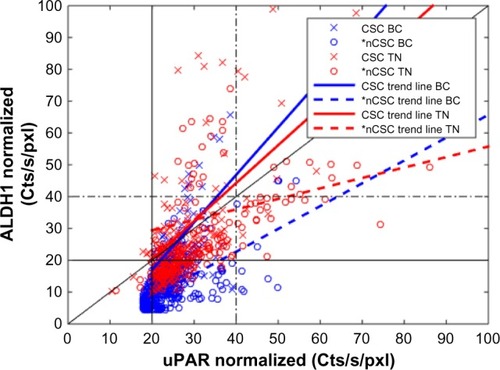
Since one aspect of our study was focused on potential therapeutic targets, we examined two such molecular markers. The two targets, ALDH1 and uPAR, are shown in . Of interest, uPAR overexpression was more prevalent than that of ALDH1. Indeed, if uPAR was the selected target some TN cells are two to four times more intense because of the heterogeneity. Cancer stem cells appear to show more heterogeneity in ALDH1 (trend line slopes have 45° line) than the non-CSC cells (trends line slopes near horizontal). Evaluation of CD133 had similar characteristics, but with a reduced number of overexpressed cells.
Figure 4 Comparison of cell expression of ALDH1 versus uPAR.
Abbreviations: ALDH1, acetaldehyde dehydrogenases 1; uPAR, urokinase plasminogen activator surface receptor; BC, breast cancer; TN, triple-negative; CSC, cancer stem cells; CD, cluster of differentiation; Cts/s/pxl, counts/second/pixel.
We have examined the pattern of heterogeneous molecular markers relative to tumor size and stage, and we could neither find any relationship nor a defined pattern relative to these features. In addition, we considered that the site from which the touch preparation was made could provide an explanation for the heterogeneity. We did not identify differences or a defined pattern from a central or peripheral site, when such sites did not contain necrotic cells.
Discussion
The HMI system provides a unique opportunity to examine ten or more molecular markers in each individual cell in terms of their presence and degree of overexpression, amplification, and interrelationship with one another. In our HMI studies of breast cancer that expressed hormone receptors (estrogen receptor and/or progesterone receptor) or Her-2, we noted significant homogeneity of these markers in breast cancers. Also, in clusters of cells, we observed similar markers and equivalence of these markers. In contrast, our evaluation of TN tumors identified remarkable heterogeneity of molecular markers, and the presence of some that classically have been define it as “stem cell” types. Therefore, we proceeded with an analysis of freshly acquired TNBCs to pursue the identification of a potential therapeutic target.
An initial concern related to a variety of other studies that attempted to exploit the molecular patterns of such tumors using gene expression profiles to delineate the nature of the primary tumor.Citation14 Perou et alCitation14 expressed the diversity of molecular phenotypes among breast tumors poses complexity in the analysis and categorization of these tumors. A variety of studies have focused on “subtypes” of TNBCs in an attempt to identify groups of patients for either therapeutic evaluation or a better definition of the diversity of tumors termed TN.Citation19,Citation21–Citation29 Some have focused on “clusters” of cells with an attempt to determine the pathways that may be important for therapeutic target selection,Citation30 and some studies have sought to define the responsible “driver” of carcinogenesis and proliferation.Citation31
Because the hyperspectral microscopic evaluation allows panels of ten or more molecular markers to focus on each single cell, we felt we might more clearly define the presence of such markers, their interrelationship with one another, and their degree of amplification. In addition, we could characterize the patterns seen in clusters of cells, which are considered the result of cellular replication at that cluster. Therefore, we were surprised to note remarkable heterogeneity, which even included markers of the “stem cell” type. Again, heterogeneity and significant variation in molecular features were seen not only in different sites of the cancer but also when individual adjacent cells were examined. We were unable to relate this heterogeneity or to define a pattern based on the size, clinical or pathological stage or grade of the tumor. In addition, this heterogeneity was not related to the site within the tumor from which the sample was obtained.
One background basis for some of these studies relate to our interest in the pursuit of mechanisms to help explain tumor dormancy, a significant problem in breast cancer. A variety of related studies are ongoing in our laboratory, and we had hoped that cell clusters with defined molecular features of stem cells would help implicate a mechanism that merited further pursuit. Unfortunately, the identifiable heterogeneity provided further complexity in the pursuit of mechanisms underlying tumor dormancy. The recent evidence of disseminated tumor cells recognized in the bone marrow of patients with nonmetastatic primary breast cancer further complicates the characterization of tumor dormancy.Citation32
The heterogeneity identified in this study of TNBCs adds further consternation in identifying a focused or targeted approach for their therapy.
Conclusion
There is a very significant molecular heterogeneity when adjacent cells are examined in TNBC. Thus, the heterogeneity makes a successful targeted approach unlikely. In addition, the heterogeneity denotes a complexity in the cells such that it is not reasonable to consider these changes will provide an answer to tumor dormancy.
Disclosure
The authors report no conflicts of interest in this work.
Acknowledgments
Support for this study was from the Raymond Nasher Cancer Research Fund.
References
- MengSTripathyDSheteSHer-2 gene amplification can be acquired as breast cancer progressesProc Natl Acad Sci U S A2004101259393939815194824
- GerlingerMRowanAJHorswellSIntratumor heterogeneity and branched evaluation revealed by multiregion sequencingN Engl J Med201236688389222397650
- GerlingerMHorswellSLarkinJGenome architecture and evolution of clear cell renal cell carcinoma defined by multiregion sequencingNat Genet20144622523324487277
- AllisonKSledgeGHeterogeneity and cancerOncology201428977277825224475
- KleppeMLevineRAssessing the implicationsNat Med20142034234424710377
- BieseckerLGreenRDiagnostic clinical genome and exome sequencingN Engl J Med20143702418242524941179
- MalhotraALevineSAllingham-HawkinsAWhole exome sequencing for cancer – is there evidence of clinical utility?Adv Genomics Genet201420115128
- UhrJWHuebschmanMLFrenkelEPMolecular profiling of individual tumor cells by hyperspectral microscopic imagingTransl Res201215936637522500509
- HammondMHayesDDowsettMAmerican Society of Clinical Oncology/College of American Pathologists guideline recommendations for immunohistochnemical testing of estrogen and progesterone receptors in breast cancerArch Pathol Lab Med2010134e48e7220586616
- WolffAHammondMHicksDAmerican Society of Clinical Oncology, College of American PathologistsRecommendations for human epidermal growth factor receptor 2 testing in breast cancer: American Society of Clinical Oncology/College of American Pathologists Clinical Practice guideline updateJ Clin Oncol2013313997401324101045
- AllisonKHDintzisSMSchmidtRAFrequency of Her-2 heterogeneity and fluorescence in situ hybridization according to CAP expert panel recommendations: time for a new look at how to report heterogeneityAm J Clin Pathol201113686487122095371
- IsakoffSJTriple negative breast cancer pathologic diagnosis and current chemotherapy treatment optionsEur Oncol Haematol20141013542
- FoulkesWDSmithIEReis-FilhoJSTriple-negative breast cancerN Engl J Med20103631938194821067385
- PerouCMSørlieTEisenMBMolecular portraits of human breast tumorsNature200040674775210963602
- WeigeltBBaehnerFLReis-FilhoJThe contribution of gene expression profiling to breast cancer classification, prognostication and prediction: a retrospective of the last decadeJ Pathol201022026328019927298
- SotiriouCPusztaiLGene-expression signatures in breast cancerN Engl J Med200936079080019228622
- KreikeBvan KouwenhoveMHorlingsHGene expression profiling and histopathological characterization of triple–negative/basal like breast carcinomasBreast Cancer Res20079R6517910759
- TurnerNLambrosMBHorlingsHMIntegrative molecular profiling of triple negative breast cancers identifies amplicon drivers and potential therapeutic targetsOncogene2010292013202320101236
- MayerIAAbramsonVGLehmannBDPietenpolJANew strategies for triple-negative breast cancer – deciphering the heterogeneityClin Cancer Res201420478279024536073
- StephensMAEDF statistics for goodness of fit and some comparisonsJ Am Stat Assoc197469730737
- OhiYUmekitaYYoshiokaTAldehyde dehydrogenase expression predicts poor prognosis in triple-negative breast cancerHistopathology20115977678022014057
- HuAFanCOhDSThe molecular portraits of breast tumors are conserved across microarray platformsBMC Genomics200679616643655
- PratAAdamoBCheangMCAndersCKCareyLAPerouCMMolecular characterization of basal-like and non-basal-like triple negative breast cancerOncologist20131812313323404817
- MontagnaEMaisonneuvePRotmenszNHeterogeneity of triple-negative breast cancer: histologic subtyping to inform the outcomeClin Breast Cancer201313313923098574
- GuedjMMarisaLdeReyniesAA refined molecular taxonomy of breast cancerOncogene2012311196120621785460
- LehmannBDBauerJAChenXIdentification of human triple-negative breast cancer subtypes and preclinical models for selection of targeted therapiesJ Clin Invest20111212750276721633166
- TurnerNCReis-FilhoJSTackling the diversity of triple-negative breast cancerClin Cancer Res201319236380638824298068
- LiHMaFWangHStem cell marker aldehyde dehydrogenase 1 (ADSH1)-expressing cells are enriched in triple-negative breast cancerInt J Biol Markers201328357364
- CraigDWO’ShaughnessyJAKieferJAGenome and tran-scriptome sequencing in prospective metastatic triple-negative breast cancer uncovers therapeutic vulnerabilitiesMol Cancer Ther201312110411623171949
- de MeloGDGonzalez–AnguloAMTargeting multiple pathways in breast cancerBreast Cancer Manage2014387101
- WalerychDNapoliMCollavinLDel SalGThe rebel angel: mutant p53 as the driving oncogene in breast cancerCarcinogenesis2012332007201722822097
- HartkopfADWallwienerMFehmTNDisseminated tumor cells from the bone marrow of patients with non-metastatic primary breast cancer are predictive of locoregional relapseAnn Oncol20152661155116025791636