
Abstract
Background
Multiple myeloma (MM), an incurable plasma cell malignancy. The significance of the relationship between natural killer (NK) cell-related genes and clinical factors in MM remains unclear.
Methods
Initially, we extracted NK cell-related genes from peripheral blood mononuclear cells (PBMC) of healthy donors and MM samples by employing single-cell transcriptome data analysis in TISCH2. Subsequently, we screened NK cell-related genes with prognostic significance through univariate Cox regression analysis and protein-protein interaction (PPI) network analysis. Following the initial analyses, we developed potential subtypes and prognostic models for MM using consensus clustering and lasso regression analysis. Additionally, we conducted a correlation analysis to explore the relationship between clinical features and risk scores. Finally, we constructed a weighted gene co-expression network analysis (WGCNA) and identified differentially expressed genes (DEGs) within the MM cohort.
Results
We discovered that 153 NK cell-related genes were significantly associated with the prognosisof MM patients (P <0.05). Patients in NK cluster A exhibited poorer survival outcomes compared to those in cluster B. Furthermore, our NK cell-related genes risk model revealed that patients with a high risk score had significantly worse prognoses (P <0.05). Patients with a high risk score were more likely to exhibit adverse clinical markers. Additionally, the nomogram based on NK cell-related genes demonstrated strong prognostic performance. The enrichment analysis indicated that immune-related pathways were significantly correlated with both the NK subtypes and the NK cell-related genes risk model. Ultimately, through the combined use of WGCNA and DEGs analysis, and by employing Venn diagrams, we determined that ITM2C is an independent prognostic marker for MM patients.
Conclusion
In this study, we developed a novel model based on NK cell-related genes to stratify the prognosis of MM patients. Notably, higher expression levels of ITM2C were associated with more favorable survival outcomes in these patients.
Introduction
Multiple myeloma (MM), characterized as a malignant proliferative disorder of plasma cells, accounting for approximately 10% of all hematologic malignancies.Citation1 According to Global Cancer Statistics, approximately 176,404 new cases of multiple myeloma are diagnosed worldwide each year, resulting in about 117,077 deaths annually from this condition.Citation2 Multiple myeloma, characterized by the overproduction of monoclonal immunoglobulin or M protein, can lead to various complications in patients, including multiple osteolytic lesions, hypercalcemia, anemia, and kidney damage.Citation3 Multiple myeloma is a progressive disease that encompasses various stages, including the premalignant stages such as monoclonal gammopathy of undetermined significance (MGUS) and smoldering multiple myeloma (SMM), advancing to the active MM stage, and ultimately, in some cases, progressing to plasma cell leukemia (PCL). To date, a diverse array of therapeutic approaches has been employed to enhance outcomes in patients with MM. These treatments include cytotoxic chemotherapies, proteasome inhibitors, immunomodulatory drugs (IMiDs), immunosuppressive drugs, monoclonal antibodies, and histone deacetylase inhibitors.Citation4 In recent years, the emergence of PD1/PDL1 inhibitors has catalyzed a surge in research focused on the immunotherapy of tumor cells. This approach, which combats tumors by activating the body’s immune system, primarily involving T cells and NK cells, has emerged as a pivotal method in treating advanced malignancies.Citation5 Cell infusion therapy, particularly CAR-T cell therapy targeting BCMA, has emerged as a highly promising and precise form of immunotherapy. It has shown remarkable progress in the treatment of relapsed/refractory multiple myeloma, with some studies reporting an overall response rate of up to 100%. However, a significant proportion of patients, approximately 70.6%, experienced cytokine release syndromes of grade 1 or 2.Citation6
Given the toxic side effects associated with T cell-based therapies and the innate immune properties of NK cells, research focusing on the role of NK cells in multiple myeloma is progressively being undertaken. Research has confirmed that IMiDs can exert immunostimulatory effects, particularly on NK cells. These drugs enhance the ability of NK cells to secrete cytokines and amplify their antibody-dependent cellular cytotoxicity (ADCC) effects.Citation7 After receiving continuous autologous NK cell infusion therapy, patients with multiple myeloma exhibit increased plasma granzyme B levels, without leading to serious adverse events.Citation8
Currently, there is a lack of comprehensive research exploring the significance of NK cell-related gene signatures in MM. In this project, we identified a model based on NK cell-related genes and evaluated its clinical significance. This could also be instrumental in developing more effective treatment strategies for this patient group.
Methods
Data Collection and Preprocessing
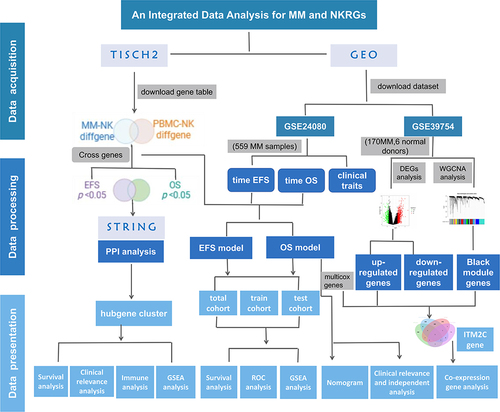
To explore the clinical significance of NK cell-related gene expression levels in MM patients, we utilized the Tumor Immune Single-cell Hub 2 (TISCH2) database (http://tisch.comp-genomics.org/) to acquire data on NK cell-related genes in NK cells from both normal donors and MM patients. For each dataset, TISCH2 offers comprehensive meta information, cell-type annotations, expression visualizations, differential gene expression analysis, Gene Set Enrichment Analysis (GSEA) results, transcription regulator analysis outcomes, and cell-cell interaction results.Citation9 We downloaded one multiple myeloma dataset (MM_GSE161801_10X) and one normal peripheral blood mononuclear cell (PBMC) dataset (PBMC_60K_10X) from TISCH2 database. In this study, the gene expression profiling and clinical information of MM patients were acquired from Gene Expression Omnibus (GEO) datasets (http://www.ncbi.nlm.nih.gov/geo). The transcriptomic data of 559 newly diagnosed MM patients and their corresponding clinical information, sourced from the GSE24080 dataset, were primarily used for clinical indicator and survival analyses. Additionally, the mRNA expression profile from the GSE39754 dataset, which includes 170 MM patients and 6 normal donors, was analyzed using the Affymetrix Human Genome U133 Plus 2.0 Array on the GPL5175 platform. The workflow of our study was illustrated in .
Figure 1 The detailed workflow chart analysis in our research.
Acquisition and Identification of Prognostic NK Cell-Related Genes
A univariate Cox regression analysis was performed on the GEO cohort to identify prognostic NK cell-related genes, using a P-value threshold of < 0.05 for significance. The protein-protein interaction (PPI) network of these identified genes was analyzed and visualized using the STRING database (https://string-db.org/) and Cytoscape software (version 3.9.1). Furthermore, the correlation analysis of these genes was performed using Spearman correlation method in the “corrplot” package of R software.
Establishment of Consensus Clustering
Consensus clustering, utilizing the k-means method, was applied to identify potential subtypes of MM based on the expression profiles of prognostically significant NK cell-related hub genes. We utilized the “ConsensusClusterPlus” R package to determine the number of clusters and their stability. Besides, the optimal cluster number was ascertained based on the consensus index and the cumulative distribution function (CDF).
Gene Set Enrichment Analysis and Functional Enrichment Analysis
GSEA was employed to assess enriched pathways in the two NK subtype groups and high-/low- risk groups among MM patients. Additionally, Kyoto Encyclopedia of Genes and Genomes (KEGG) pathway analysis and Gene Ontology (GO) analysis, encompassing biological process (BP), cellular component (CC), and molecular function (MF) categories, were performed using the “clusterProfiler” package in R software.
Development and Validation of the Prognostic Model
The GEO cohort (GSE24080) was utilized to establish the prognostic model. We employed the least absolute shrinkage and selection operator (LASSO) regression to identify NK cell-related genes with substantial prognostic value. The optimal λ value was selected for fitting the LASSO regression model. Subsequently, we conducted a multivariate Cox regression analysis to pinpoint independent prognostic marker genes. Following this, through the “caret” package in R, the MM samples were randomly divided into training and test sets in a 7:3 ratio. The risk score was calculated using the formula: risk score = ∑[Exp(mRNA) × coef(mRNA)]. Based on the median value of this risk score, the patients were categorized into high-risk and low-risk groups. The survival of each risk group was assessed using the “survival” package in R software. Finally, the receiver operating characteristic (ROC) curve and the area under the ROC curve (AUC) were calculated to verify the accuracy and reliability of the prognostic models, using the “timeROC” software package in R.
Clinicopathological Factors and Prognostic Value Analysis of NK Cell-Related Genes
Initially, we extracted various clinicopathological features from the GSE24080 dataset, including age, race, gender, levels of C-reactive protein (CRP), β2-microglobulin (β2-MG), creatinine, lactate dehydrogenase (LDH), percentage of bone marrow plasma cells (BMPC %), albumin, haemoglobin, isotype, and cytogenetic data. After that, in combination with the clinical indicators, we performed a correlation analysis between each clinical feature and risk scores. Furthermore, univariate and multivariate Cox regression analyses were carried out to evaluate the predictive accuracy of the risk score model for overall survival (OS). Ultimately, a prognostic nomogram, integrating risk scores and all independent prognostic clinical factors, was developed to predict the 1-year, 3-year, and 5-year OS of MM patients in the GEO dataset.
Weighted Gene Co-Expression Network Analysis (WGCNA) and Differentially Expressed Genes (DEGs)
Utilizing RNA-seq data from GSE39754 (170 MM samples and 6 healthy donors), we identified differentially expressed genes (DEGs) between MM and normal samples using the “limma” package. We established |Log2FC| > 1.5 and P < 0.05 as the selection criteria for DEGs. Furthermore, the WGCNA package was utilized to divide the genes from both MM samples and normal samples into various gene modules. Pearson’s correlation coefficients were calculated to assess the relationships between the samples and within each module. We focused on the module exhibiting a high correlation coefficient for further analysis, as it was deemed to be functionally related to clinical features.
Clinical Relevance and Co-Expression Gene Analysis of ITM2C
To gain a comprehensive understanding of the significance of ITM2C gene expression, we conducted a correlation analysis comparing each clinical feature between groups with high and low ITM2C levels. In conjunction with clinical indicators, ITM2C expression was examined using both univariate and multivariate Cox proportional hazards models. Additionally, we carried out an analysis to identify genes that are co-expressed with ITM2C (P value < 0.001, R > 0.3 | R < −0.3). Furthermore, all samples were classified into “High” (H) or “Low” (L) groups based on the median expression level of ITM2C. We then utilized GSEA to explore related functional and pathway variations among different ITM2C expression groups.
Statistical Analysis
All statistical analyses were conducted using R software, version 4.1.2. We considered a P value of less than 0.05 to be statistically significant.
Results
Identifying NK Cell-Related Gene Expression Profiles Using Single-Cell RNA Sequencing (ScRNA-Seq) in the TISCH2 Database
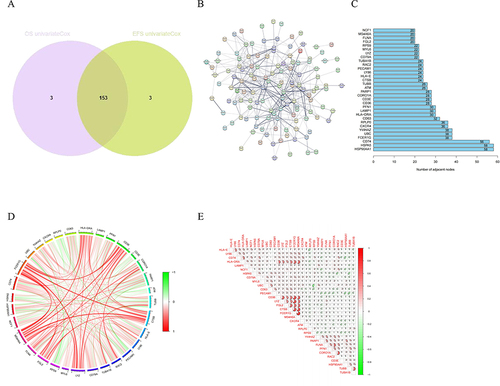
Based on the specific cancer type and immune cell type, we initially selected two datasets from the TISCH2 database. As demonstrated in , thirty one clusters and nine cell types were identified in MM_GSE161801 dataset. Twenty six clusters and seven cell types were identified in PBMC_60K dataset. The cell types and proportions of samples were more clearly illustrated by pie charts. In addition, the dot plot showed the relative expression levels of the marker genes in MM_GSE161801 cell type. From these, we downloaded a total of 1060 NK cell-related expressed marker genes from the MM_GSE161801 dataset and 2276 NK cell-related genes from the PBMC_60K dataset. These genes were detailed in Tables S1 and S2. To identify NK cell-related genes common to both MM and normal groups, we used venn diagrams to extract 691 genes. Next, as detailed in Tables S3 and S4, we identified 156 NK cell-related genes that were significantly associated with the OS and EFS of MM patients in the GSE24080 dataset (P <0.05). At last, the venn diagram was used to identify a total of 153 genes significantly associated with prognosis ().
Figure 2 Identification of NK cells using scRNA–seq analysis in TISCH2 database. (A) Thirty–one clusters were identified in MM_GSE161801 dataset. (B) Nine cell types were defined in MM_GSE161801 dataset. (C) The pie chart of cell-type statistics in MM_GSE161801 dataset. (D) Twenty-six clusters were identified in PBMC_60K dataset. (E) Seven cell types were defined in PBMC_60K dataset. (F) The pie chart of cell-type statistics in PBMC_60K dataset. (G) The dot plot showed the relative expression levels of the marker genes in MM_GSE161801 cell type. (H) Venn diagram showing the 15 intersected cell types by the correlation and differential analysis.
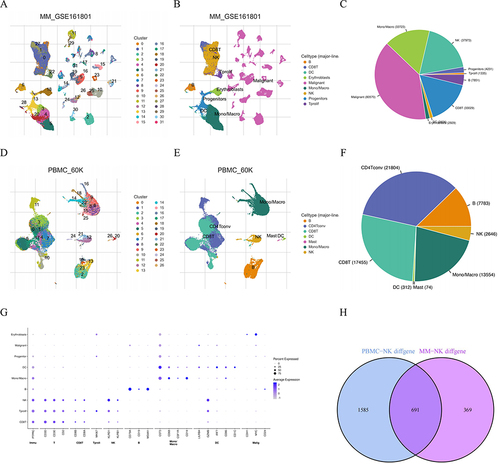
Figure 3 Identification of prognostic NK cell-related genes in MM. (A) The Venn plot of the intersection of OS-related genes and EFS-related genes. (B) The PPI network of the NK cell-related prognostic genes using STRING database. (C) The barplot diagram showing the degree of involvement of each key gene in the PPI network. (D) and (E) The gene co-expression analysis of the 32 key genes.
Two NK Subtypes Were Recognized Based on the Hubgene Among Prognostic Genes
As shown in , to delve deeper into the characteristics of prognostic NK cell-related genes, we utilized the STRING database to identify key hub genes, and the degree of involvement of each key gene was shown in the barplot diagram. Moreover, we explored the associations between the above genes, which were exhibited using the heatmaps of correlation and correlation plot. As illustrated in , these genes were then used to categorize MM samples into two subtypes using the consensus clustering method. The principal component analysis (PCA) plot, t-distributed stochastic neighbor embedding (t-SNE), and Uniform Manifold Approximation and Projection (UMAP) all demonstrated distinct differences between the two subtypes of MM. Notably, patients in cluster A exhibited poorer survival outcomes compared to those in cluster B in terms of OS and EFS.
Figure 4 Identification of prognostic NK cell-related genes and consensus clustering. (A) Two NK subtypes of MM were recognized with prognostic NK cell-related genes using consensus clustering. (B) PCA, (C) tSNE and (D) UMAP plot showing the NK subtypes of MM. The survival curve of the patients in the two subgroups for (E) OS and (F) EFS. (G) Heatmap of distribution of clinicopathological variables and NK cell-related genes between different cluster groups. (H) The boxplot illustrating the difference in NK related-cell genes between two clusters. (I) The boxplot visualizing the distribution differences of immune cells between the two clusters.
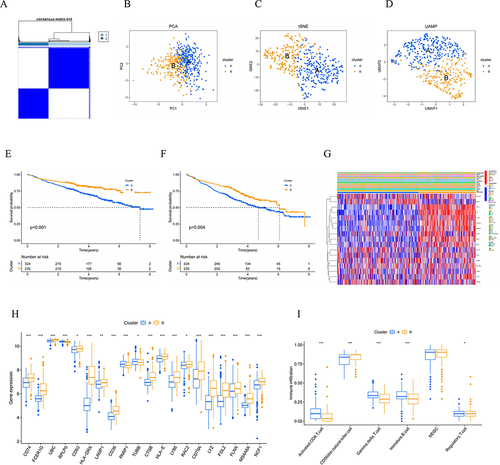
Furthermore, we visualized the differential expression levels of hub genes, including CD74, FCER1G, UBC, RPLP0, CD63, HLA-DRA, LAMP1, CD36, PARP1, TUBB, CTSB, HLA-E, LY86, RAC2, CD79A, LYZ, FGL2, FLNA, MS4A6A, and NCF1, across the two subtypes using a boxplot. To further our analysis, we employed the ssGSEA method to compare the immune cell infiltration levels in clusters A and B. It clearly demonstrated that the two subtypes exhibited a higher abundance of CD56 dim natural killer cells, and a lower presence of activated CD8 T cells, gamma delta T cells, and immature B cells. Furthermore, it was observed that cluster B had a slightly higher presence of CD56 dim natural killer cells and a slightly lower abundance of activated CD8 T cells, gamma delta T cells, and immature B cells compared to cluster A.
Clinical Significance and Biological Functions of NK Cell Subtypes in MM
To further elucidate the relationship between the two NK cell subtypes and clinical features in MM patients, we constructed a heatmap. It illustrated the gene expression and the distribution of clinical traits within cluster A and cluster B subtypes (). Furthermore, GSEA tools were employed to further explore and identify the functional mechanisms within the KEGG and GO in clusters A and B. As depicted in Figure S1, the GSEA for cluster B indicated involvement in various biological processes, such as cell adhesion molecules, complement and coagulation cascades, hematopoietic cell lineage, response to Leishmania infection, and systemic lupus erythematosus. Additionally, the GO analysis showed that cluster B was significantly associated with processes including cell-mediated immunity, humoral immune response, leukocyte-mediated immunity, lymphocyte-mediated immunity, and the regulation of lymphocyte activation.
Development and Assessment of Two Prognostic NK Cell Risk Models
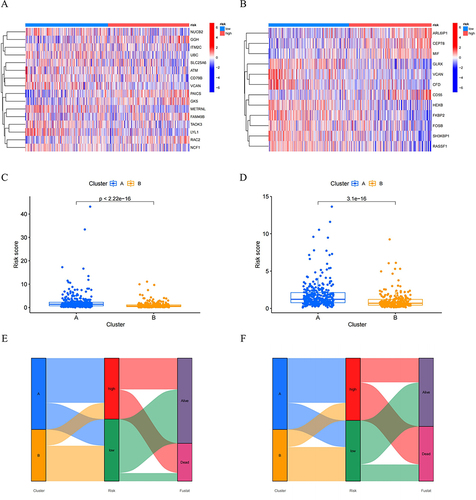
As shown in and , we further identified 153 genes based on the λ value by the LASSO and multivariate Cox regression analyses. Subsequently, within the OS group and the EFS group, we identified 16 and 12 NK cell-related genes, respectively. Based on these findings, NK cell risk models were constructed for each group. MM patients were divided into high-risk and low-risk groups. Then we demonstrated the disparities in the NK cell-related risk score signature for OS and EFS between these high- and low-risk groups. Furthermore, we assessed the impact of high- and low-risk groups on long-term survival outcomes. In the total cohort, the survival analysis revealed that patients in the high-risk group had significantly shorter OS and EFS compared to those in the low-risk group. The ROC curve presented the prognostic model had a high level of capacity in predicting 1-, 3-, and 5-year OS and EFS. For OS, the AUC value were 0.773, 0.784 and 0.731; for EFS, the AUC value were 0.724, 0.724 and 0.677. In both the training and test cohorts, the survival analysis yielded results consistent with those observed in the total cohort. By integrating the NK cell subtypes with the NK cell-related gene risk scores mentioned above, we compared the risk score levels of MM between different cluster groups. The results indicated that cluster A was more distributed predominantly in the high-risk category, whereas cluster B was associated with a better prognosis.
Figure 5 Construction of NK cell-related genes risk model in the MM cohort. LASSO regression and cross-validation for (A) OS group and (B) EFS group. (C, E and G) OS and (D, F and H) EFS: Kaplan–Meier curves analysis based on risk score, and ROC analysis for predicting the risk of death at 1, 3 and 5 years in MM patients in all cohort, training cohort and testing cohort.
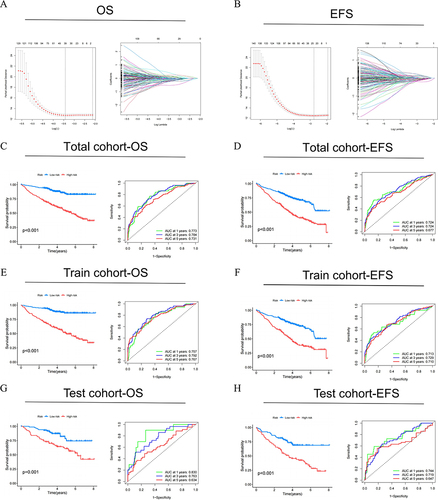
Figure 6 The heatmaps were plotted to show the expression level of (A) 16 genes from OS risk model and (B) 12 genes from EFS risk model in high- and low-risk groups. The boxplot for risk score of (C) OS and (D) EFS comparisons between A and B cluster subgroups. The Sankey diagram revealed the connection between cluster, risk score, and survival status for (E) OS group and (F) EFS group.
Correlation Between NKscore and Clinical Characteristics of MM
Based on our previous analysis, it has been established that the risk score significantly influenced the prognosis of MM patients. We subsequently delved into the relationship between the risk score and the clinicopathological characteristics of MM patients. The comparisons of the clinical and molecular characteristics among the 559 MM patients in the GSE24080 dataset, based on different risk score levels, were summarized in . To facilitate a more intuitive understanding of the correlations between the two risk groups and clinical features of MM patients, we constructed boxplots.
Figure 7 Clinical relevance analysis between high- and low-risk groups. (A) and (B) Correlation of NK risk score and clinicopathological characteristics based on the whole MM cohort. Expression of NKscore in different clinical factors in patients with MM patients. (C) Age; (D) Gender; (E) Race; (F) Isotype; (G) β2-MG; (H) CRP; (I) Creatinine; (J) LDH; (K) Albumin; (L) Haemoglobin; (M) BMPC; (N) Cytogenetics.
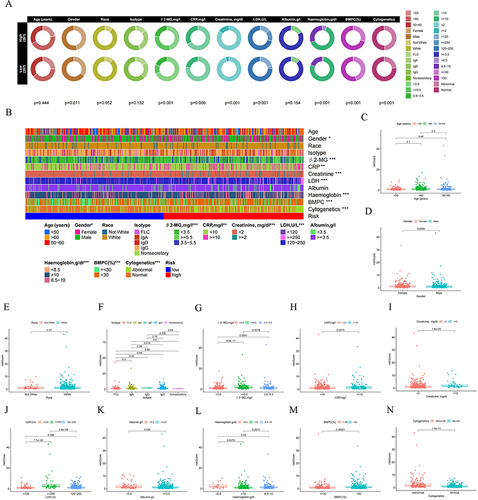
Compared to the low-risk group, the high-risk group demonstrated increased levels of CRP (P = 0.0073), β2-MG (P =0.0014), creatinine (P <0.001), LDH (P <0.001), and BMPC% (P =0.00021), along with lower levels of albumin (P =0.026) and haemoglobin (P <0.01). Additionally, a significant difference was observed across the isotype of MM between the two groups (P <0.05). The level of risk score was not associated with age or race. Moreover, the high-risk group tended to include a higher proportion of female MM patients and exhibited more complex and abnormal cytogenetic features. Overall, our analyses indicated that the clinical findings were consistent with the prognostic analysis.
GSEA Analysis of Prognostic Models for OS and EFS
As depicted in Figure S2, we then analyzed the critical signaling pathways involved in the high- and low-risk groups for OS. The GO enrichment analysis revealed that the most prominent biological processes in the low-risk group were linked to “humoral immune response”, “leukocyte chemotaxis”, “leukocyte migration”, “myeloid leukocyte migration”, and “phagocytosis”. Additionally, the KEGG enrichment analysis indicated that the most significant pathways in the low-risk group included “complement and coagulation”, “cytokine-cytokine receptor interaction”, “hematopoietic cell lineage”, “intestinal immune network for IgA production”, and “systemic lupus erythematosus”.
For EFS, the GO analysis indicated that the low-risk group was predominantly associated with biological processes such as “leukocyte chemotaxis”, “leukocyte migration”, “myeloid leukocyte migration”, “phagocytosis”, and “vesicle lumen”. Similarly, the KEGG analysis for the low-risk group revealed pathways related to “asthma”, “complement and coagulation cascades”, “hematopoietic cell lineage”, “intestinal immune network for IgA production”, and “systemic lupus erythematosus”. Collectively, these findings highlight the immune-related aspects of our risk models.
Univariate and Multivariate Analyses of NKscore and Clinical Traits in MM
To evaluate the clinical predictive capability of NKscore, we conducted univariate and multivariate Cox proportional hazard models incorporating multiple clinical factors. These factors included gender, race, age, isotype, β2-MG, CRP, creatinine, LDH, albumin, hemoglobin, BMPC, and cytogenetics. As demonstrated in , the univariate analysis indicated that the NK model risk score for OS, along with age, β2-MG, creatinine, LDH, albumin, haemoglobin, BMPC, and cytogenetics, were significantly associated with the OS of MM patients.
Figure 8 Independent prognostic value of NKscore and nomogram construction. (A) Univariate and (B) Multivariate analysis to identify independent prognostic risk factors for OS. (C) The established Nomogram integrating risk score and clinical features. (D, E and F) Calibration curves of the NKscore-integrated nomogram in 1-, 3-, and 5-year in the all cohort.
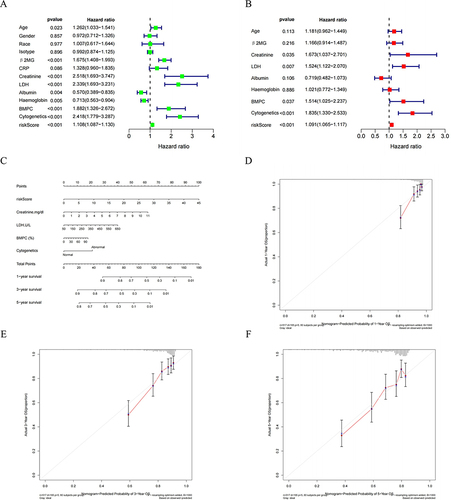
In the multivariate analysis, the risk score was identified as an independent factor for OS in MM patients (P <0.001), alongside creatinine, LDH, BMPC, and abnormal cytogenetics (with P-values of 0.035, 0.007, 0.037, and <0.001, respectively). Subsequently, we developed a Nomogram integrating the clinical information of patients and the established risk model. The risk score was confirmed as an independent prognostic factor for predicting 1-year, 3-year, and 5-year OS in MM patients. Furthermore, calibration curves exhibited good consistency between the Nomogram-predicted and the observed values for 1-year, 3-year, and 5-year OS.
Further Evaluation of NK Cell Risk Model Genes in Conjunction with WGCNA and DEGs
As shown in , to identify clinically valuable genes within the NK cell risk model, we conducted RNA-Seq differential expression analysis on MM and normal samples from the GSE39754 dataset. We then conducted GO enrichment analysis and KEGG pathway analysis on 1128 DEGs between MM and healthy donors (Figure S3). The GO analysis revealed that the DEGs were predominantly associated with immune biological processes, such as the positive regulation of cytokine production, negative regulation of immune system processes, and myeloid leukocyte activation. Additionally, the KEGG analysis indicated that these DEGs were mainly enriched in pathways like “protein processing in endoplasmic reticulum” and “neurodegeneration - multiple diseases”.
Figure 9 Identification of NK cell risk model genes in conjunction with WGCNA and DEGs. (A) Volcano plot and heatmap for DEGs in the MM and normal samples. Black: non DEGs in groups; red: upregulated DEGs in MM group; green: downregulated DEGs in in MM group. (B) Analysis of soft thresholds. (C) Gene dendrogram and module colors. (D) Module trait relationships. (E) The venn diagram of the DEGs, Black modules genes of WGCNA and NK risk model genes for OS.
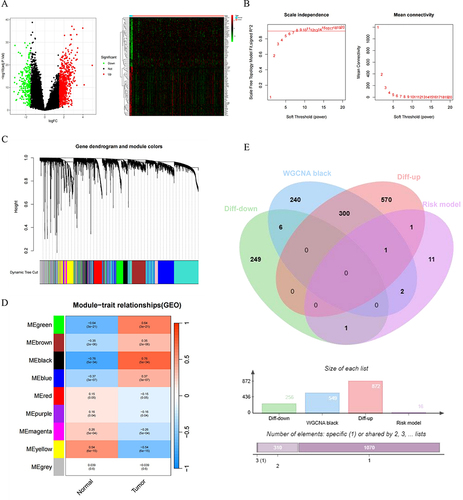
Simultaneously, we constructed a co-expression network using the WGCNA package. As depicted in , nine co-expression modules were identified. Among these, the black module showed the strongest negative correlation with normal samples and positive correlation with tumor samples. Ultimately, by overlapping the DEGs, genes from the black module identified in the WGCNA, and genes from the NK cell risk model for OS, we discovered that the ITM2C gene was consistently relevant across these modules and the OS risk model. As a result, ITM2C was selected as a key gene of interest for follow-up analysis.
Analysis of ITM2C Expression in Relation to Clinical Parameters and Co-Expression Gene Profiling of ITM2C
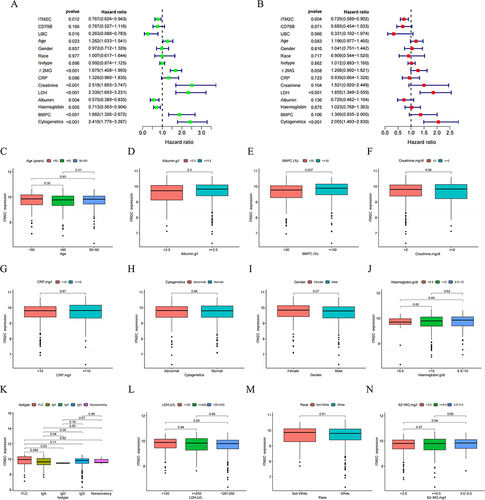
To assess the clinical predictive ability of ITM2C, we performed univariate and multivariate Cox proportional hazard models incorporating multiple clinical factors. As shown in , in the multivariate analysis, high expression of ITM2C emerged as an independent prognostic factor for OS, along with LDH ≥250 and abnormal cytogenetics (P =0.004, P <0.001, P <0.001, respectively). In short, ITM2C demonstrates considerable potential as a reliable prognostic marker in the MM cohort. We further investigated the relationship between ITM2C expression and the clinicopathological characteristics of MM patients. The comparisons of clinical and molecular characteristics among the 559 MM patients in the GSE24080 dataset, stratified by different ITM2C expression levels. Compared to the ITM2Clow group, the ITM2Chigh group demonstrated a lower percentage of BMPC (P =0.037). Furthermore, we identified correlations between ITM2C and its co-expressed genes (Figure S4). Most of these genes were positively associated with ITM2C expression, with the exception of BTG1.
Figure 10 Expression of ITM2C in different clinical factors in patients with MM. (C) Age; (D) Gender; (E) Race; (F) Isotype; (G) β2-MG; (H) CRP; (I) Creatinine; (J) LDH; (I) Albumin; (K) Haemoglobin; (L) BMPC, (M) Albumin; (N) Haemoglobin.
Discussion
NK cells are critical components of the immune system, comprising approximately 5–15% of lymphocytes.Citation10 As innate immune cells, NK cells operate independently of antigen sensitization and antibody involvement. They are not restricted by major histocompatibility complex (MHC) molecules and possess the ability to non-specifically recognize and attack tumor cells, as well as cells infected by viruses and other pathogens.Citation11 Due to their broad-spectrum anti-cancer properties and low side effects, NK cells have garnered widespread attention in recent years for their role in cancer mechanisms and therapeutic applications. The clinical indications for NK cell and chimeric antigen receptor-modified NK (CAR-NK) cell therapies, both domestically and internationally, are primarily focused on malignant hematological tumors. These therapies have been employed in treating diseases such as multiple myeloma, acute myeloid leukemia, acute lymphoblastic leukemia, and non-Hodgkin lymphoma.Citation12–15 Recently, a team has utilized single-cell sequencing data to study the significance of NK cell-related gene models in cancer prognosis. Xiang et al screened and validated NK cell marker genes in hepatocellular carcinoma (HCC) cells, as well as to develop an NK-cell-related gene signature to predict the prognosis of HCC patients. Not only did they discover that this gene signature model is associated with immune and tumor metabolic pathways, but they also revealed that higher expression levels of KLRB1 and DUSP10 within the NK cell-related signatures were correlated with favorable survival outcomes in HCC patients.Citation16
Currently, research on NK cell-related gene prognostic models primarily focuses on solid tumors. To date, no study has utilized single-cell sequencing data to analyze the prognostic models of NK cell-related genes and potential immune targets in hematological tumors. In MM patients, due to the clonal proliferation and genomic changes of tumor cells, an immunosuppressive tumor microenvironment is formed, which affects the normal growth of NK cells and reduces the immune function of NK cells. For example, MM cells secrete TGF-β, which inhibits the production of IFN-γ mediated by the ADCC effect of NK cells, further reducing NK cells’ response to pro-inflammatory factors. There are also IL6 and IL10 cytokines that interfere with the toxic function of NK cells and antagonize the production of TNF-A.Citation17,Citation18 In addition, compared with healthy controls and patients in remission, the expression of activating receptors NKG2D, CD226, 2B4 and CD16 on NK cells in active MM patients was reduced, while the inhibitory receptors PD1 and NKG2A were upregulated, resulting in NK cell dysfunction, preventing the recognition and killing of myeloma cells and further promoting myeloma disease progression.Citation19 Given the poor prognosis associated with MM and its complex immune mechanisms, our research will initially concentrate on constructing a prognostic model of NK cell-related genes specifically for MM. This will also involve exploring its related functions and identifying potential immune genes.
In our prognostic model for OS, ITM2C, which is part of the type 2 transmembrane family, was identified as a significant gene. Notably, its expression level is observed to increase during the process of B cell differentiation.Citation20 CD79b plays a crucial role in the activation of the B cell receptor complex, initiating intracellular signal transduction processes. There have been significant advancements in developing CAR-T cell therapies targeting CD79b for B-cell lymphomas.Citation21 VCAN, identified as a gene associated with inflammatory cells in esophageal cancer, has been found to correlate with a better prognosis in this type of cancer.Citation22 Studies have highlighted that METRNL plays a significant role in the regulation of angiogenesis. Notably, its expression levels have been found to be substantially higher in colorectal cancer tissues compared to those in normal tissues.Citation23 PAICS has been found to be highly expressed in various types of cancer and is notably associated with lower survival rates in patients.Citation24 SLC25A6 has been identified to exhibit the strongest correlation with M1 macrophages in uveal melanoma, highlighting its significance in tumor immunity.Citation25 TAOK3 is known to play a significant role in modulating T cell activity and in the stabilization process of dendritic cells, highlighting its importance in immune regulation.Citation26,Citation27 NUCB2 functions as a pivotal regulatory gene in tumor-infiltrating plasma cells and exhibits a bidirectional role in tumor progression, underscoring its complex impact in oncogenesis.Citation28 In human immunodeficiency diseases and tumors, the overactivation of Rac2 leads to an increase in PI3K activity, and affects the development and function of NK cells.Citation29 LYL1, functioning as a transcription factor, mediates the critical transition from lymphoid progenitor cells to NK progenitor cells, playing a key role in NK cell development.Citation30 Moreover, in our prognostic model for EFS, the genes that contribute to the prognostic risk score are distinct from those in the OS model. This highlights the differing molecular mechanisms underlying these two aspects of multiple myeloma progression.
In consideration of the evaluation results from both the OS and EFS models, our focus shifted to the NK cell-related genes in the OS model for further discussion. We analyzed the relationship between this NK cell-related gene prognostic model and various clinical parameters. By combining the NK cell-related risk scores for OS with clinical indicators, we also developed a nomogram that accurately predicts survival outcomes for MM patients. Furthermore, the GSEA results showed that immune-related pathways were significantly enriched in both the OS and EFS models.
To pinpoint the most prognostically valuable genes within the NK risk model, our study utilized WGCNA and identified DEGs that showed the strongest correlation with normal and tumor samples. One such gene, ITM2C, emerged as particularly noteworthy and was identified as an independent prognostic marker for MM patients. Furthermore, our investigation into the relationship between ITM2C expression and clinical parameters revealed that increased ITM2C expression correlates with a lower percentage of BPMC in MM patients. This finding aligns with the observed association between reduced ITM2C expression and poor prognosis in MM patients.
ITM2C, encoding the Integral Membrane Protein 2C, is a part of the ITM protein family. Research conducted by Corcoran and his team revealed that ITM2C is highly selectively expressed in antibody-secreting cells and myeloma cells in both mice and humans. This gene plays a critical role in the development and differentiation of B lymphocytes, as well as in the secretory function of antibody-producing cells, underscoring its significance in immune responses,Citation20 which is similar to our findings. A study has studied the gene expression profile of myeloma cells by RNA sequencing technology, and found that ITM2C is a candidate gene associated with myeloma development.Citation31 Besides, there has been research applying machine learning algorithms to gene expression data with the aim of identifying genetic markers of colorectal cancer. This research found that ITM2C expression is downregulated in colorectal cancer, suggesting its potential role as a tumor suppressor gene. This downregulation implies that ITM2C may play a critical role in inhibiting tumor growth and progression in colorectal cancer.Citation32 Another study focused on the gene characteristics of estrogen receptor (ER)-positive and ER-negative breast cancer patients. It was found that the downregulation of ITM2C is associated with a poor prognosis in breast cancer patients, with this effect being particularly pronounced in ER-negative cases. This indicates that ITM2C expression levels could be a significant biomarker for assessing breast cancer outcomes, especially in the context of ER status.Citation33
Currently, there is a lack of research on how ITM2C influences the immune function of NK cells in MM patients. Our study offers preliminary evidence suggesting the potential therapeutic application of ITM2C in treating multiple myeloma. Additionally, we employed the Pearson correlation method to identify genes co-expressed with ITM2C. Our analysis revealed that the five most significant genes positively correlated with ITM2C expression are HEXB, UQCRQ, PECAM1, CD59, and EMC4, indicating potential targets for further investigation. Previous research has indicated that the level of CD59 in extracellular vesicles of MM patients is significantly higher compared to healthy individuals.Citation34 In addition, literature reports suggest that NK cells exhibit an increased cytotoxic function against target cells that express CD59, highlighting its potential role in the immune response against multiple myeloma.Citation35 HEXB is the beta subunit of the lysosomal enzyme beta-hexosaminidase and catalyzes the degradation of the ganglioside GM2. HEXB has been found to be a marker of a unique type of T cell that exerts tissue remodeling and anti-neuroinflammatory capabilities.Citation36 UQCRQ encodes a ubiquinone-binding protein of low molecular mass, which has been identified as one of the core genes of atherosclerotic diseases.Citation37 PECAM1 is a member of the immunoglobulin superfamily. A study revealed that the peritumoral tissue of clear cell renal cell carcinoma patients is a reservoir of TRAIL+FasL+, TRAIL+PECAM-1+, or FasL+PECAM-1+ NK and T cells.Citation38 EMC4 is involved in many cellular processes by regulating the insertion of various proteins in membranes.Citation39 This finding further suggests that ITM2C, along with its co-expressed genes, plays a collaborative role in modulating the immune response of NK cells against multiple myeloma, highlighting the potential for targeted therapeutic strategies.
In summary, our research represents the inaugural effort to construct prognostic models within NK cell-related genes. We have demonstrated these models as valuable tools when combined with clinical traits, leading to the development of a Nomogram for multiple myeloma. Our study provides preliminary evidence for the potential of ITM2C as a therapeutic target in MM, especially highlighting its role in modulating NK cell immunity. The co-expression of ITM2C with genes like CD59 further underscores its pivotal involvement in the immune response against MM. This research lays the groundwork for future investigations into the role of ITM2C in NK cell-mediated immunity and its potential as a therapeutic target in MM.
Abbreviations
MM, Multiple myeloma; TISCH2, Tumor Immune Single-cell Hub 2; GSEA, Gene Set Enrichment Analysis; PBMC, peripheral blood mononuclear cell; ROC, receiver operating characteristic curve; AUC, area under the ROC curve; CRP, CRP C-reactive protein; β2-MG, β2-microglobulin; LDH, lactate dehydrogenase; BPMC, bone marrow plasma cells; LASSO, least absolute shrinkage and selection operator; WGCNA, Weighted Gene Co-Expression Network Analysis; DEGs, Differentially Expressed Genes; OS, overall survival; EFS, event-free survival.
Author Contributions
All authors made a significant contribution to the work reported, whether that is in the conception, study design, execution, acquisition of data, analysis and interpretation, or in all these areas; took part in drafting, revising or critically reviewing the article; gave final approval of the version to be published; have agreed on the journal to which the article has been submitted; and agree to be accountable for all aspects of the work.
Disclosure
The authors declare no conflicts of interest in this work.
Acknowledgments
The authors sincerely acknowledge the public databases, including and scientists who provided grand accessible bioinformatic data for our analyses.
Data Sharing Statement
The original data used to support the findings of this study are available in public databases that were included within this article.
References
- Silberstein J, Tuchman S, Grant SJ. What is multiple Myeloma? JAMA. 2022;327(5):497. doi:10.1001/jama.2021.25306
- Sung H, Ferlay J, L SR, et al. Global Cancer Statistics 2020: GLOBOCAN Estimates of Incidence and Mortality Worldwide for 36 Cancers in 185 Countries. CA Cancer J Clin. 2021;71(3):209–249. doi:10.3322/caac.21660
- K KS, Rajkumar V, A KR, et al. Multiple myeloma. Nat Rev Dis Primers. 2017;3:17046. doi:10.1038/nrdp.2017.46
- E JD, Bryant C, Dix C, et al. Biology and therapy of multiple myeloma. Med J Aust. 2019;210(8):375–380. doi:10.5694/mja2.50129
- Ahmetlic F, Fauser J, Riedel T, et al. Therapy of lymphoma by immune checkpoint inhibitors: the role of T cells, NK cells and cytokine-induced tumor senescence. J Immunother Cancer. 2021;9(1):e001660. doi:10.1136/jitc-2020-001660
- Wang D, Wang J, Hu G, et al. A Phase 1 study of a novel fully human BCMA-targeting CAR (CT103A) in patients with relapsed/refractory multiple myeloma. Blood. 2021;137(21):2890–2901. doi:10.1182/blood.2020008936
- Quach H, Ritchie D, K SA, et al. Mechanism of action of immunomodulatory drugs (IMiDS) in multiple myeloma. Leukemia. 2010;24(1):22–32. doi:10.1038/leu.2009.236
- Nahi H, Chrobok M, Meinke S, et al. Autologous NK cells as consolidation therapy following stem cell transplantation in multiple myeloma. Cell Rep Med. 2022;3(2):100508. doi:10.1016/j.xcrm.2022.100508
- Han Y, Wang Y, Dong X, et al. TISCH2: expanded datasets and new tools for single-cell transcriptome analyses of the tumor microenvironment. Nucleic Acids Res. 2023;51(D1):D1425–D1431. doi:10.1093/nar/gkac959
- G FA, L M-B-B, Yu J, et al. The broad spectrum of human natural killer cell diversity. Immunity. 2017;47(5):820–833. doi:10.1016/j.immuni.2017.10.008
- Y WS, Fu T, Z JY, et al. Natural killer cells in cancer biology and therapy. Mol Cancer. 2020;19(1):120. doi:10.1186/s12943-020-01238-x
- Leivas A, Valeri A, Cordoba L, et al. NKG2D-CAR-transduced natural killer cells efficiently target multiple myeloma. Blood Cancer J. 2021;11(8):146. doi:10.1038/s41408-021-00537-w
- Christodoulou I, J HW, Marple A, et al. Engineering CAR-NK cells to secrete IL-15 sustains their anti-AML functionality but is associated with systemic toxicities. J Immunother Cancer. 2021;9(12):e003894. doi:10.1136/jitc-2021-003894
- Liao C, Wang Y, Huang Y, et al. CD38-Specific CAR Integrated into CD38 locus driven by different promoters causes distinct antitumor activities of T and NK cells. Adv Sci (Weinh). 2023;10(27):e2207394. doi:10.1002/advs.202207394
- Liu E, Marin D, Banerjee P, et al. Use of CAR-transduced natural killer cells in CD19-positive lymphoid tumors. N Engl J Med. 2020;382(6):545–553. doi:10.1056/NEJMoa1910607
- Li M, Huang J, Zhan G, et al. The novel-natural-killer-cell-related gene signature predicts the prognosis and immune status of patients with hepatocellular carcinoma. Int J Mol Sci. 2023;24(11):1.
- Swamydas M, V ME, J I-HJ, et al. Deciphering mechanisms of immune escape to inform immunotherapeutic strategies in multiple myeloma. J Hematol Oncol. 2022;15(1):17. doi:10.1186/s13045-022-01234-2
- Holthof LC, Mutis T. Challenges for immunotherapy in multiple myeloma: bone marrow microenvironment-mediated immune suppression and immune resistance. Cancers (Basel). 2020;12(4):988. doi:10.3390/cancers12040988
- Fauriat C, Mallet F, Olive D, et al. Impaired activating receptor expression pattern in natural killer cells from patients with multiple myeloma. Leukemia. 2006;20(4):732–733. doi:10.1038/sj.leu.2404096
- Trezise S, Karnowski A, L FP, et al. Mining the plasma cell transcriptome for novel cell surface proteins. Int J Mol Sci. 2018;19(8):2161. doi:10.3390/ijms19082161
- Chu F, Cao J, Liu J, et al. Chimeric antigen receptor T cells to target CD79b in B-cell lymphomas. J Immunother Cancer. 2023;11(11):e007515. doi:10.1136/jitc-2023-007515
- J ZW, Liu Y, Guo J, et al. Prognostic biomarkers identification in esophageal cancer based on WGCNA and single-cell analysis. Dis Markers. 2022;2022:6595778. doi:10.1155/2022/6595778
- Xu X, Zhang C, Xia Y, et al. Over expression of METRN predicts poor clinical prognosis in colorectal cancer. Mol Genet Genomic Med. 2020;8(3):e1102. doi:10.1002/mgg3.1102
- Meng X, Song W, Zhou B, et al. Prognostic and immune correlation analysis of mitochondrial autophagy and aging-related genes in lung adenocarcinoma. J Cancer Res Clin Oncol. 2023;149(18):16311–16335. doi:10.1007/s00432-023-05390-x
- R LA, N LY, X SS, et al. Comprehensive analysis and validation of solute carrier family 25 (SLC25) and its correlation with immune infiltration in pan-cancer. Biomed Res Int. 2022;2022:4009354. doi:10.1155/2022/4009354
- Ormonde J, Li Z, Stegen C, et al. TAOK3 regulates canonical TCR signaling by preventing early SHP-1-mediated inactivation of LCK. J Immunol. 2018;201(11):3431–3442. doi:10.4049/jimmunol.1800284
- Vanderkerken M, Maes B, Vandersarren L, et al. TAO-kinase 3 governs the terminal differentiation of NOTCH2-dependent splenic conventional dendritic cells. Proc Natl Acad Sci U S A. 2020;117(49):31331–31342. doi:10.1073/pnas.2009847117
- Shu L, Tang J, Liu S, et al. Plasma cell signatures predict prognosis and treatment efficacy for lung adenocarcinoma. Cell Oncol Dordr. 2023;47:555–571. doi:10.1007/s13402-023-00883-w
- Tabellini G, Baronio M, Patrizi O, et al. The RAC2-PI3K axis regulates human NK cell maturation and function. Clin Immunol. 2019;208:108257. doi:10.1016/j.clim.2019.108257
- Wang D, Uyemura B, Hashemi E, et al. Role of GATA2 in Human NK Cell Development. Crit Rev Immunol. 2021;41(2):21–33. doi:10.1615/CritRevImmunol.2021037643
- Sariman M, Abaci N, S SE, et al. Investigation of gene expressions of myeloma cells in the bone marrow of multiple myeloma patients by transcriptome analysis. Balkan Med J. 2019;36(1):23–31. doi:10.4274/balkanmedj.2018.0356
- S MN, Kushwaha S, R VR, et al. Unlocking the Potential of the CA2, CA7, and ITM2C gene signatures for the early detection of colorectal cancer: a comprehensive analysis of RNA-Seq Data by utilizing machine learning algorithms. Genes (Basel). 2023;14(10). doi:10.3390/genes14101836
- Xiao B, Hang J, Lei T, et al. Identification of key genes relevant to the prognosis of ER-positive and ER-negative breast cancer based on a prognostic prediction system. Mol Biol Rep. 2019;46(2):2111–2119. doi:10.1007/s11033-019-04663-4
- Brennan K, F IK, Blanco-Fernandez A, et al. Extracellular vesicles isolated from plasma of multiple myeloma patients treated with daratumumab express CD38, PD-L1, and the complement inhibitory proteins CD55 and CD59. Cells. 2022;11(21):3365. doi:10.3390/cells11213365
- Omidvar N, C WE, Brennan P, et al. Expression of glycosylphosphatidylinositol-anchored CD59 on target cells enhances human NK cell-mediated cytotoxicity. J Immunol. 2006;176(5):2915–2923. doi:10.4049/jimmunol.176.5.2915
- Gu Y, Zhang X, Li H, et al. Novel subsets of peripheral immune cells associated with promoting stroke recovery in mice. CNS Neurosci Ther. 2024;30(4):e14518. doi:10.1111/cns.14518
- H MY, Yang Y, H LJ, et al. NDUFB11 and NDUFS3 regulate arterial atherosclerosis and venous thrombosis: potential markers of atherosclerosis and venous thrombosis. Medicine (Baltimore). 2023;102(46):e36133.
- Strizova Z, Taborska P, Stakheev D, et al. NK and T cells with a cytotoxic/migratory phenotype accumulate in peritumoral tissue of patients with clear cell renal carcinoma. Urol Oncol. 2019;37(7):503–509. doi:10.1016/j.urolonc.2019.03.014
- Bai L, You Q, Feng X, et al. Structure of the ER membrane complex, a transmembrane-domain insertase. Nature. 2020;584(7821):475–478. doi:10.1038/s41586-020-2389-3