
Abstract
Background
Ageing is an inevitable physiology process of humans, and skin biophysical parameters change owing to genetic and environmental factors in different ethnic populations.
Aim
To gain comprehensive data on the skin biophysical parameters of different anatomical regions and to explore the change trend of the skin characteristics associated with age for the indicated regions by generalized additive model.
Methods
We measured various skin biophysical parameters on forehead, cheek, chin and inner forearm of 178 Chinese women aged between 20 and 64 years living in Beijing. These parameters comprised skin hydration, transepidermal water loss (TEWL), sebum content, erythema index (EI), melanin index (MI), L*a*b* values, individual typology angle (ITA) and pH, which were quantified by non-invasive instruments.
Results
Comparing the skin parameters among the four test areas, we observed that the hydration, TEWL, EI and a* values were significantly higher for the face than for the forearm, but the L* and ITA values were just the opposite. The cheek was the lightest and brightest region with lowest sebum content, while the chin was much darker and the forehead was yellowish. Considering the change of the skin parameters with age, TEWL, sebum content and melanin and erythema indices had a linear relationship with age, whereas skin hydration, L, a, b, ITA and pH values exhibited a non-monotonic relationship. The turning points of these curves appeared almost at the thirties, showing the lightest and evenest skin color and more hydration, with lower pH values.
Conclusion
This study indicates that the skin biophysical characteristics of Chinese women were significantly affected by age and body regions.
Introduction
Ageing is an inevitable physiology process of humans over time, and both genetic mechanisms and environmental factors can account for it.Citation1 Skin constitutes the outermost protective barrier which makes it subject to sunlight, air pollution and climate change. All these external factors accelerate the ageing signs of the skin, especially the ultraviolet (UV) radiation-induced photoageing.Citation2 With the rapid development of technologies, a large number of non-invasive instruments are available to evaluate the cutaneous physiological properties, and the most commonly used parameters consist of stratum corneum (SC) hydration, transdermal water loss (TWEL), sebum content, melanin index (MI), erythema index (EI), L*a*b* skin color system and skin surface pH values.Citation3 Many studies have reported that these skin biophysical parameters changed according to age, gender, anatomical regions and seasons in different ethnic populations.Citation4–Citation11 Man et al demonstrated that the skin surface pH, sebum content and SC hydration varied with age, gender and body site in a large Chinese population.Citation12 Mayes et al reported that the facial skin L*a*b* skin colors, hydration and TEWL had associations with chronological age in Chinese females.Citation13 Qiu et al found variability in age-related skin lightness, chromaticity values, sebum production and skin hydration of the facial skin during winter and summer experienced by Chinese women.Citation14 However, the test regions were limited and the grouping criteria of age were different in these studies. No comparison between the regions and no regional change trends with age were presented, leading to a failure in understanding the regional variation of the biophysical properties of the Chinese women at different ages. In addition, a simple linear correlation was applied to describe the association between age and the skin parameters in the previous studies. A more precise fit model should be used to investigate the tendency.
In this study, we measured nine skin biophysical parameters on the forehead, cheek, chin and inner forearm in a healthy Chinese female population aged from 20 to 64 years using non-invasive methods. The forehead and chin belong to the oily “T-zone” on the face, while the cheek was chosen as the representative of the non-oily area of the face. The forearm is a less photo-exposed site in comparison with the face, which explains more of the natural ageing process. These four body regions are also the most frequently measured sites in the relevant studies. The aim of this investigation was to gain comprehensive data on the skin parameters of different anatomical regions and to explore the change trend of the skin biophysical characteristics associated with age for the indicated regions by generalized additive model.
Materials and Methods
Subjects
The study enrolled 178 female volunteers aged 20–64 years (mean 40.1±12.5 SD) who signed the written informed consent. The study was conducted according to the principles of the World Medical Association Declaration of Helsinki. This study was a part of a cosmetic efficacy evaluation project, of which the protocol was approved by the Ethics Committee of Intertek China who was the evaluation provider. All the subjects were healthy without any systemic or skin disorders which could influence the skin condition at the study sites. Exclusion criteria included pregnancy, lactation, invasive cosmetology treatment (face lift, BTX-A, chemical peels etc.), distinct signs of tanning or being a heavy smoker (≥ 20 cigarettes per week for over 2 years). The subjects were distributed into 4 age groups by 10-year ranges (20–29, 30–39, 40–49 and 50–64), and the characterization of the age groups was summarized in . The subjects were asked not to apply any skin care products or use soaps or surfactants to wash the measured sites for at least 12 hours prior to the study.
Table 1 Characteristics of the Subjects
Study Design
All subjects had been living in Beijing (north latitude 39°56′, east longitude 116°20′) for at least 1 year. The measurements were performed from October to December 2019. After washing the measured sites (face and forearm) with running water, subjects relaxed in a room with controlled condition (temperature of 22±2°C and relative humidity of 50±5%) for 30 min. The nine skin biophysical parameters, including skin hydration, TEWL, melanin index, erythema index, lightness L*redness a*yellowness b*individual typological angle (ITA) and skin pH, were measured at four anatomical sites: forehead, cheek (left), chin and inner forearm. The sebum content was measured at the forehead, cheek (left) and chin.
Instrument Measurements
Skin parameters were measured using various probes attached to an MPA10 multi-probe adaptor system (Courage & Khazaka Electronic GmbH, Cologne, Germany) connected to a PC, except that skin pH was recorded by a skin pH-meter PH905 (Courage & Khazaka Electronic GmbH, Cologne, Germany). The skin hydration in the stratum corneum was measured using the Corneometer CM825 based on a capacitance measurement and expressed in arbitrary units (a.u.) (mean of at least five readings). Epidermal barrier function was assessed as transepidermal water loss (TEWL) using a Tewameter TM 300 (mean of at least three readings after saturation of the chamber). Sebum content was measured with Sebumeter SM 815. Skin melanin and erythema indices were measured by a Mexameter MX18 (mean of at least four readings). Skin color, based on the L*a*b* color system and the individual typological angle (ITA), was evaluated by Colorimeter CL400 (mean of at least three readings).
Statistical Analysis
GraphPad Prism 7 software (GraphPad, San Diego, California, USA) was used for descriptive analysis and statistical inference. The statistical difference of skin biophysical properties among measured regions and age groups was calculated by one-way ANOVA, and Tukey HSD (honestly significant difference) was used for post hoc. The “mgcv” package of R (version 4.0.3) was used to fit the curves of regional skin parameters associated with age by generalized additive model (GAM). The statistical tests were two-tailed with significance levels of 0.05.
Results
Data from all the 178 female volunteers enrolled were taken into account for statistical analysis. Their demographic information is presented in . The subjects were all indoor workers without smoking habit. Over 90% of the subjects used moisturizers during the daily skincare steps, and 88% of them were exposed to sunlight less than 2 h per day.
Stratum Corneum Hydration
The skin surface moisture content was analyzed based on measuring the stratum corneum capacitance values. Regardless of the age, the skin hydration level for the forearm was significantly lower than that for the face, while the forehead, cheek and chin had comparable skin surface moisture content (). We further clarified the change of skin hydration with age for the indicated anatomical regions, and the results are shown in . For the forehead and forearm, the fitting curves of moisture content level as a function of age were bell-shaped, and the hydration values peaked around 35 and 40 years old, respectively. The skin hydration for the cheek decreased with ageing with a slight increase around the thirties, while it was stable for the chin. When we categorized the data into four age groups and compared them with each other, no statistically significant difference was seen among the groups.
Figure 1 Age-related change of skin hydration for the forehead (A), cheek (B), chin (C) and forearm (D), and the comparison among the four age groups (E). Hydration values are indicated by solid lines and 95% CIs by shaded area in the line graphs, and are expressed as mean ± 95% CIs in the bar graphs.
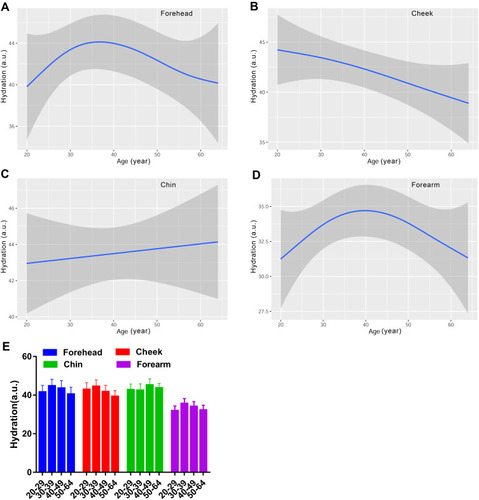
Table 2 Influence of Anatomical Regions on the Biophysical Parameters
Transdermal Water Loss
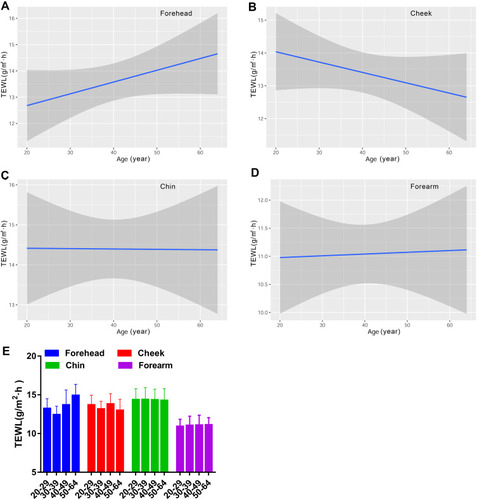
In accord with the skin hydration level, the forearm had significantly lower level of TEWL values than any area of the face (). There existed a monotonous relationship between TEWL values and age for the forehead, cheek, chin and forearm. It demonstrated that TEWL of the forehead showed a rising trend with age, but the change trend was just the opposite for the cheek. Additionally, the skin barrier function remained steady for the chin and the forearm from 20 to 64 years old (). The difference among the four age groups was not significant ().
Figure 2 Age-related change of TEWL for the forehead (A), cheek (B), chin (C) and forearm (D), and the comparison among the four age groups (E). TEWL values are indicated by solid lines and 95% CIs by shaded area in the line graphs, and are expressed as mean ± 95% CIs in the bar graphs.
Sebum Content
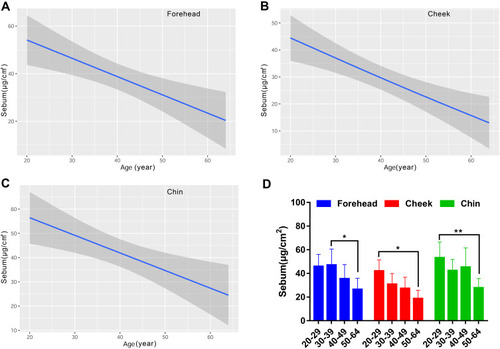
Since sebum content was not a routine parameter measured on the forearm in our daily practice, we just tested it on the face. The forehead and chin produced similar levels of sebum content, which was dramatically higher than that for the cheek (). The sebum content on the face was linearly correlated with age. The results indicated that the sebum level of the three measured facial sites decreased in an age-dependent manner (). The oldest population had dramatically lower sebum level than the young populations aged 30–39 years for the forehead and aged 20–29 years for the cheek and chin ().
Figure 3 Age-related change of skin sebum content for the forehead (A), cheek (B) and chin (C), and the comparison among the four age groups (D). Sebum values are indicated by solid lines and 95% CIs by shaded area in the line graphs, and are expressed as mean ± 95% CIs in the bar graphs. *p <0.05, **p <0.01.
Skin Surface pH
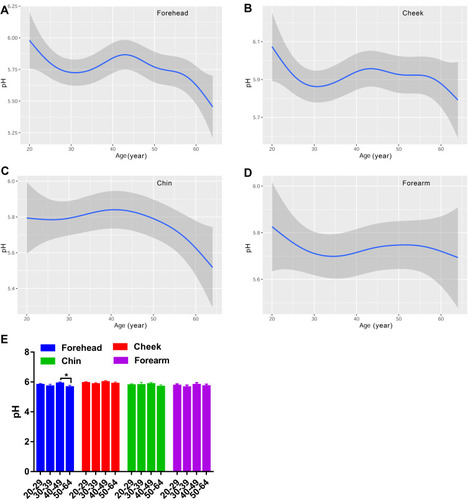
The skin surface pH value of the cheek was much higher than the other three regions (). The variations of pH values associated with age for the forehead, cheek and forearm fluctuated down (). It firstly went downward in the thirties, increased in the forties, and then reduced in the fifties. Furthermore, the change trend for the forearm was much more smooth and stable than the other two facial regions. For the chin, the pH values slowly reached a peak around 40 years old and smoothly declined afterwards (). A significant difference was only observed for the forehead between the forties and the fifties ().
Figure 4 Age-related change of skin surface pH for the forehead (A), cheek (B), chin (C) and forearm (D), and the comparison among the four age groups (E). pH values are indicated by solid lines and 95% CIs by shaded areas, and are expressed as mean ± 95% CIs in the bar graphs. *p <0.05.
Skin Color Parameters of Melanin Index and Erythema Index
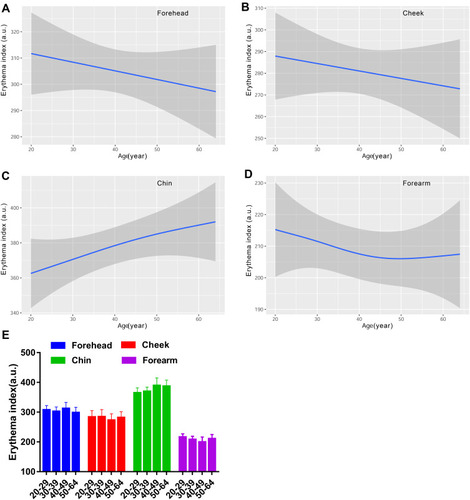
The regional variation of melanin index was prominent, and the MI values of the four sites ranked as: cheek < forearm ≈ forehead < chin (). Similarly, the regional differences of EI values were statistically significant, and the order was: forearm < cheek < forehead < chin; the forearm had the lowest EI value compared to areas of the face ().
The MI and EI values both presented a linear correlation with age for the face ( and ). However, the MI values were positively related to age, while the correlation of EI values with age was negative except for that for the chin. It showed a J-shaped fitting curve of MI values for the forearm, with the thirties as the bottom (). As for the EI values for the forearm, the fitting line was a smooth downward curve (). However, only the MI values in the 50–64 age group for the cheek showed significant differences in comparison with the 20–29 and 30–39 age groups (). The EI values did not present markedly differences among the age groups for the test regions ().
Figure 5 Age-related change of skin melanin index for the forehead (A), cheek (B), chin (C) and forearm (D), and the comparison among the four age groups (E). MI values are indicated by solid lines and 95% CIs by shaded areas, and are expressed as mean ± 95% CIs in the bar graphs. **p <0.01.
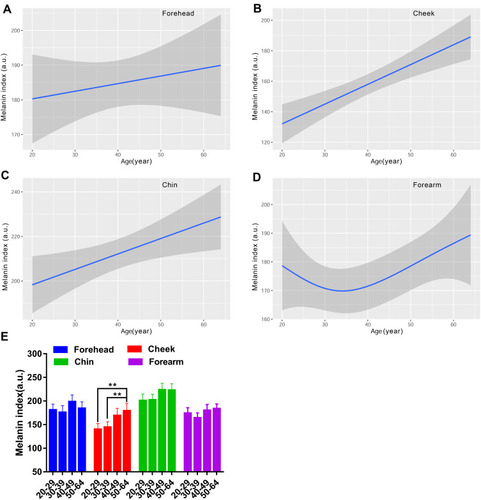
Figure 6 Age-related change of skin erythema index for the forehead (A), cheek (B), chin (C) and forearm (D), and the comparison among the four age groups (E). EI values are indicated by solid lines and 95% CIs by shaded area in the line graphs, and are expressed as mean ± 95% CIs in the bar graphs.
Skin Color Parameters of CIE L*a*b* Color System
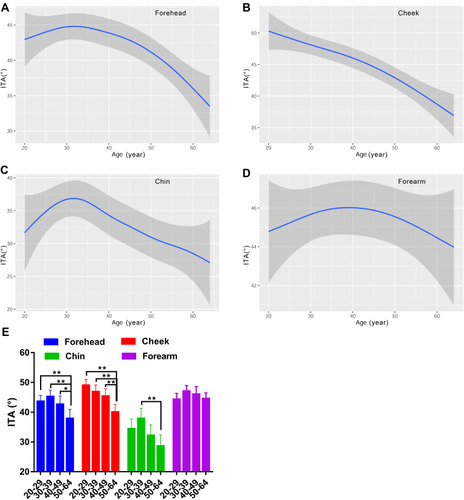
Besides MI and EI, the skin color was determined using the CIE L*a*b* color system as well, which included lightness L*redness a*yellowness b* and individual typology angle (ITA). According to , the impact of anatomical regions on the Lab skin color system revealed that the lightness for the chin was the lowest compared with the forehead, cheek and forearm. The highest a* values were for the cheek and chin, followed by the forehead, and the forearm was the least red region. The facial skin yellowness values were remarkably different among test sites, of which the rank in descending order was forehead, chin and cheek, and the yellowness for the forearm was at the same level as the cheek. The ITA represents the skin color homogeneity, and the most homogeneous skin color was seen for the cheek and forearm, the forehead in second place, and the least homogeneous was the chin.
The L values for the face exhibited a decreasing curve changing with age, with a small peak in the age group of 30–39 (). There existed remarkable difference between older subjects and younger subjects for the forehead and cheek, but not for the chin (). Lightness level for the forearm was quite stable with values around 64 (). Likewise, the skin redness for the face all showed a J-shaped fitting curve, and the inflection point was observed at about 35 years old for the forehead and cheek, while at 32 years old for the chin (). The a* values for the forearm were on the decline with age (). A significant difference of a* values was observed for the chin between the fifties and the twenties and thirties (). The four test regions all showed an increased trend of the b* parameter with the ageing process, but a fall occurred at the thirties for the forehead and forearm (). The yellowness level in the 50–59 age group was vastly lower than that of the 30–39 age group for the forehead chin and forearm, and in the 20–29 age group for the cheek (). Although the ITA values decreased along the lifespan, typically for the cheek, the women in their thirties showed a rise of ITA for the forehead and chin, and the top values for the forearm were at around 40 years old (). Except for the forearm, the oldest group had lower ITA values than the other age groups for the forehead and cheek, and a significant difference existed between the thirties and the fifties for the chin (). The data of the L*a*b color system illustrated that the skin color change in the age range of 30–39 had its own feature, showing the lightest and evenest skin color compared to other age groups.
Figure 7 Age-related change of skin lightness L* for the forehead (A), cheek (B), chin (C) and forearm (D), and the comparison among the four age groups (E). Lightness L* values are indicated by solid lines and 95% CIs by shaded area in the line graphs, and are expressed as mean ± 95% CIs in the bar graphs. *p <0.05, **p <0.01.
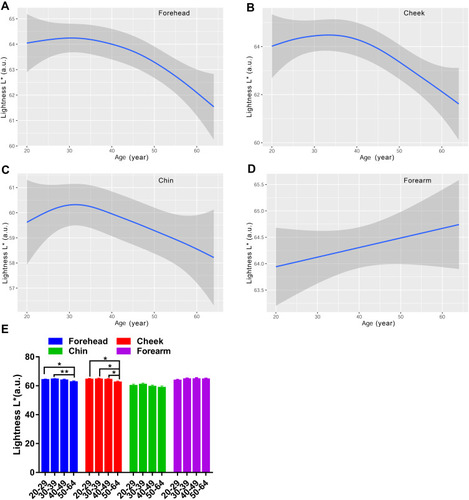
Figure 8 Age-related change of skin redness a* for the forehead (A), cheek (B), chin (C) and forearm (D), and the comparison among the four age groups (E). Redness a* values are indicated by solid lines and 95% CIs by shaded area in the line graphs, and are expressed as mean ± 95% CIs in the bar graphs. *p <0.05, **p <0.01.
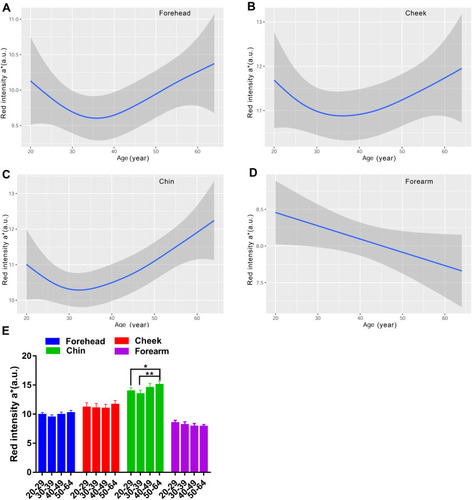
Figure 9 Age-related change of skin yellowness b* for the forehead (A), cheek (B), chin (C) and forearm (D), and the comparison among the four age groups (E). Yellowness b* values are indicated by solid lines and 95% CIs by shaded area in the line graphs, and are expressed as mean ± 95% CIs in the bar graphs. *p <0.05, **p <0.01.
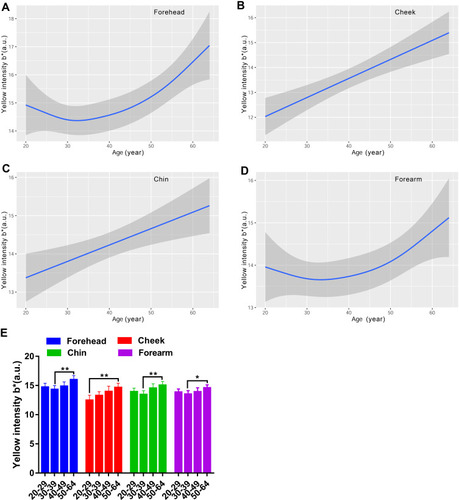
Figure 10 Age-related change of skin individual typological angle for the forehead (A), cheek (B), chin (C) and forearm (D), and the comparison among the four age groups (E). ITA values are indicated by solid lines and 95% CIs by shaded area in the line graphs, and are expressed as mean ± 95% CIs in the bar graphs. *p <0.05, **p <0.01.
Discussion
In this study, we investigated the inter-relationship between anatomical regions as well as age and moisture-, sebum-, pH- and color-related skin features of 178 Chinese women by noninvasive methods. These two factors highly affected the skin characteristics showing typical change patterns.
The intrinsic skin ageing equally influences all skin regions; however, some skin regions are exposed more often to the extrinsic factors such as UV radiation, pollution or bad weather. As an exposure site, the facial areas are more severely affected by harmful environmental factors than the inner forearm which is preserved by the clothes most of the time. Comparing the skin parameters for the forehead, cheek, chin and forearm areas, we observed a remarkable difference between the face and forearm, in addition to a prominent facial region variation. The hydration, TEWL, EI and a* values were significantly higher for the face than the forearm, but the L* and ITA values were just the opposite. Cheeks are characterized by the highest pH and ITA values, and lowest sebum level and MI, EI, and b* values among the facial regions. Chin is the darkest area of the face with the highest MI and EI values and lowest L* and ITA values. Besides, the forehead is the most yellow region for the face with the least redness.
The face was more hydrated than the forearm but with weaker skin barrier function (), and it was in line with several investigations.Citation15–Citation19 It was hypothesized that the keratinocyte size and organization linked with the skin barrier function.Citation20 In addition, the keratinocyte size is anatomical region-dependent, leading to our observation. The red color was prominent for the face, especially the chin, whereas the forearm had the lowest EI and a* values (). Some works confirmed our results,Citation16,Citation17,Citation19 and the increased blood circulation of the face is responsible for these results.Citation21,Citation22 The cheek was the brightest and lightest area on the face, while the chin was the opposite, representing the least brightness together with the most pigmentation (). This facial skin color diversity was shown in our previous workCitation23 but not in a Caucasian population owing to the ethnic difference.Citation9 Interestingly, the skin color parameters of the forearm were quite close to those of the cheek (), which has also been reported by other scientists.Citation16,Citation24,Citation25 Our observation that the cheek had higher pH values than the other locations was in accord with the earlier reports.Citation15,Citation17 However, Marrakchi and Maibach found that the highest pH values were those ofthe chin, and the cheek and forearm were at moderate pH levels.Citation18 The substantial amount of sebum content for the forehead and chin supports the well-known fact that the sebum distributes in a T-shaped manner on the face.Citation26 According to the available literature, the regional differences of the sebum content are consistent with our results.Citation9,Citation16,Citation18,Citation27 The lowest sebum level which was found for the cheek might contribute to the increased pH there, since epidermal lipids exist as non-ionic acid or in the ionic form depending on the pH.Citation28
In most studies, researchers considered that the various skin parameters and age were linearly correlated, and linear regression or linear correlation coefficient was used to describe the situation. Nevertheless, a few publications presented a non-monotonic relationship between some parameters and age.Citation5,Citation9 Instead of the linear regression model, we chose the generalized additive model to fit the change trend of skin parameters with age. The generalized additive model takes the additive form of nonparametric function to get better model interpretation and prediction in non-linear regression.Citation29 This statistical model has not been applied in the dermatological research yet. The changes of the skin parameters with age were different at different sites. Our results revealed that the TEWL and sebum content for all the tested regions, and melanin and erythema indices for the face, had a monotonic relationship with age. On the contrary, skin hydration, L, a, b, ITA and pH values for the test regions and MI and EI values for the forearm exhibited a non-monotonic relationship. The turning points of these curves appeared almost at the thirties. The skin hydration, lightness and ITA levels were increasing up to the age of 30 and then decreased, while a drop in the skin pH, redness and yellowness levels occurred in the age range from 30 to 40.
Many people believe that the skin moisture content diminishes with age, and some researchers supported this opinion.Citation5,Citation16,Citation30 In our study, this phenomenon was observed only for the cheek, but not for the forehead and forearm which presented curves with the peak at around the age of 35 and 40 years old, respectively (). Hydration was largely stable for the chin, with even a small increasing trend with age (). However, the difference between the age groups was not statistically significant, and similar results were obtained in another Chinese populationCitation12 and in Caucasian populationsCitation9,Citation31 as well. Water in the skin can be divided into two phases: free and protein-combined water. The ageing process impairs the structure of skin protein resulting in a decrease in protein-binding water, so our observation might be attributed to the free water level rather than the total moisture content of the skin.Citation32 Transdermal water loss is the most important indicator for the evaluation of the skin barrier integrity.Citation33 Our study found that the age-related TEWL level was steady for the chin and forearm, and went upward for the forehead and downward for the cheek, without statistical difference (). These results correspond with the study of a German female population.Citation34 It seems that the skin barrier function is damaged with age, but controversial findings have been reported regarding the effect of ageing on TEWL.Citation35 Several studies identified no association between TEWL and age.Citation16,Citation18,Citation27 However, a negative correlation of TEWL with age has been revealed by other researchers.Citation5,Citation9,Citation30 Discrepancies in the measured region selection, age groupings, race and geographical location might explain these conflicting results. Additionally, over 90% of the subjects in our study routinely used moisturizers which impacted the skin biophysical properties, especially skin hydration and TEWL, resulting in the lack of significant difference among age groups.
The sebum content gradually decreased with age for the face, presenting the least sebum content in the fifties group compared with the twenties or thirties (). Some previous publications also showed that skin sebum excretion declined after menopause in women, which might be associated with hormonal change.Citation5,Citation14,Citation16,Citation31 The pH plays an essential role on the cutaneous anti-microbial defense and regulating the skin barrier function, with a physiological range of 4.1–5.8.Citation28 We found that the pH value experienced a drop in the thirties group, went up in the forties and then decreased (). The difference between the forties and fifties reached statistical significance only for the forehead. Although the curves were fluctuating, the change trend of pH with age was descending. This result was in agreement with the published data that the pH was more alkaline in older populations.Citation12,Citation18,Citation36 The elevated skin surface pH in the older subjects could be attributable to the decrease of sebum content, which is one of the key factors regulating skin surface pH.Citation28
Skin color is the major sign related to ageing appearance. We used two systems to determine the skin color features in this study, and the parameters included MI, EI, L*a*b* and ITA values. Our results showed that the melanin index increased as a function of age regardless of the sites, reaching significance at the age of forty and above, for the cheek (). The L* and ITA values, representing the skin brightness, showed an inverse trend to the content of melanin and decreased across the lifespan, with dramatically age-related variation ( and ). These results are in line with previous studies manifesting a rise in melanin content with age for the face.Citation9,Citation37 Skin erythema showed a declining trend with age, although the difference was not remarkable within the age groups (). This decrease could be attributed to lower blood flow and immunosuppression in the aged skin.Citation38 The redness a* values displayed a significant rise at the age of fifty for the chin ( and ), which was in accord with the erythema content increase for the chin (). The finding described an age-related hemoglobin deposit area on the face. The yellowness values enhanced with age and reached the highest at the age of fifty for all the test sites (). The genetic and ethnic reasons could contribute to this yellowness change trend with age, as other researchers also came to a similar conclusion in Chinese subjectsCitation39 but not in Indian subjects.Citation40 These data supported that the skin was getting darker with increasing age, due to intrinsic factors and photo-ageing, just like the previous studies that were independent of race.Citation5,Citation9,Citation24,Citation30,Citation39
In summary, this comprehensive research showed that for the Chinese women skin properties differed between anatomical regions of face and forearm and changed with age in these areas. The skin baseline data from the present study could help dermatologists to better understand the variances in the skin parameters which will be conducive to the diagnosis of skin diseases. Moreover, precision skin care should be applied to target the individual needs of each part of the skin in different age groups. This contributes to the development of age-specific and region-specific skin care products, which is attracting more and more attention in the ageing society with a rising proportion of elderly people.
Although this is comprehensive study, it has some limitations. First, the age range was limited to 20–64 resulting in the lack of information from the younger and older populations with distinctive skin characteristics. Second, the environmental parameters, skin care habits and life styles were not included in the study, and the interaction of these factors on the skin properties could add more valuable information. Third, the sample size was not big enough to reach a precise fitting model explaining the correlation between the skin properties and age.
Disclosure
Qi Liu is an employee of Beijing EWISH Testing Technology Co., Ltd. The authors report no other potential conflicts of interest for this work.
References
- Bielfeldt S, Springmann G, Seise M, Wilhelm KP, Callaghan T. An updated review of clinical methods in the assessment of ageing skin – new perspectives and evaluation for claims support. Int J Cosmetic Sci. 2018;40(4):348–355. doi:10.1111/ics.12484
- Carvalho PRS, Sumita JM, Soares JLM, Sanudo A, Bagatin E. Forearm skin aging: characterization by instrumental measurements. Int J Cosmetic Sci. 2017;39(5):564–571. doi:10.1111/ics.12407
- Dobos G, Lichterfeld A, Blume Peytavi U, Kottner J. Evaluation of skin ageing: a systematic review of clinical scales. Brit J Dermatol. 2015;172(5):1249–1261. doi:10.1111/bjd.1350925363020
- Yang J, Tu Y, Man M, et al. Seasonal variations of epidermal biophysical properties in Kunming, China: a self-controlled cohort study. Skin Res Technol. 2020;26(5):702–707. doi:10.1111/srt.1285732196767
- Cho C, Cho E, Kim N, et al. Age‐related biophysical changes of the epidermal and dermal skin in Korean women. Skin Res Technol. 2019;25(4):504–511. doi:10.1111/srt.1267930758867
- Salomão Calixto L, Picard C, Savary G, Campos PMBG. Skin characterization and immediate effects of different dermocosmetic treatments in French and Brazilian skin. J Cosmet Dermatol-Us. 2019;19(2):466–472. doi:10.1111/jocd.13003
- Young MM, Franken A, du Plessis JL. Transepidermal water loss, stratum corneum hydration, and skin surface pH of female African and Caucasian nursing students. Skin Res Technol. 2019;25(1):88–95. doi:10.1111/srt.1261430028039
- Colomb L, Flament F, Wagle A, Idelcaid Y, Agrawal D. In vivo evaluation of some biophysical parameters of the facial skin of Indian subjects living in Mumbai. Part II: variability with age and gender. Int J Cosmetic Sci. 2018;40(2):141–147. doi:10.1111/ics.12445
- Machková L, Švadlák D, Dolečková I. A comprehensive in vivo study of Caucasian facial skin parameters on 442 women. Arch Dermatol Res. 2018;310(9):691–699. doi:10.1007/s00403-018-1860-630167813
- Vierkoetter A, Huels A, Yamamoto A, et al. Extrinsic skin ageing in German, Chinese and Japanese women manifests differently in all three groups depending on ethnic background, age and anatomical site. J Dermatol Sci. 2016;83(3):219–225. doi:10.1016/j.jdermsci.2016.05.01127289339
- Lee MR, Nam GW, Jung YC, et al. Comparison of the skin biophysical parameters of Southeast Asia females: forehead-cheek and ethnic groups. J Eur Acad Dermatol. 2013;27(12):1521–1526. doi:10.1111/jdv.12042
- Man MQ, Xin SJ, Song SP, et al. Variation of skin surface pH, sebum content and stratum corneum hydration with age and gender in a large chinese population. Skin Pharmacol Phys. 2009;22(4):190–199. doi:10.1159/000231524
- Mayes AE, Murray PG, Gunn DA, et al. Ageing appearance in China: biophysical profile of facial skin and its relationship to perceived age. J Eur Acad Dermatol. 2010;24(3):341–348. doi:10.1111/j.1468-3083.2009.03418.x
- Qiu H, Long X, Ye JC, et al. Influence of season on some skin properties: winter vs. summer, as experienced by 354 Shanghaiese women of various ages. Int J Cosmetic Sci. 2011;33(4):377–383. doi:10.1111/j.1468-2494.2011.00639.x
- Luebberding S, Krueger N, Kerscher M. Skin physiology in men and women: invivo evaluation of 300 people including TEWL, SC hydration, sebum content and skin surface pH. Int J Cosmetic Sci. 2013;35(5):477–483. doi:10.1111/ics.12068
- Firooz A, Sadr B, Babakoohi S, et al. Variation of biophysical parameters of the skin with age, gender, and body region. Sci World J. 2012;2012:1–5. doi:10.1100/2012/386936
- Kleesz P, Darlenski R, Fluhr JW. Full-body skin mapping for six biophysical parameters: baseline values at 16 anatomical sites in 125 human subjects. Skin Pharmacol Phys. 2012;25(1):25–33. doi:10.1159/000330721
- Marrakchi S, Maibach HI. Biophysical parameters of skin: map of human face, regional, and age‐related differences. Contact Dermatitis. 2007;57(1):28–34. doi:10.1111/j.1600-0536.2007.01138.x17577354
- Li X, Galzote C, Yan X, Li L, Wang X. Characterization of Chinese body skin through in vivo instrument assessments, visual evaluations, and questionnaire: influences of body area, inter-generation, season, sex, and skin care habits. Skin Res Technol. 2014;20(1):14–22. doi:10.1111/srt.1207623750880
- Hadgraft J, Lane ME. Transepidermal water loss and skin site: a hypothesis. Int J Pharm. 2009;373(1–2):1–3. doi:10.1016/j.ijpharm.2009.02.00719429281
- Waller JM, Maibach HI. Age and skin structure and function, a quantitative approach (I): blood flow, pH, thickness, and ultrasound echogenicity. Skin Res Technol. 2005;11(4):221–235. doi:10.1111/j.0909-725X.2005.00151.x16221138
- Nagashima Y, Yada Y, Suzuki T, Sakai A. Evaluation of the use of an integration-type laser-Doppler flowmeter with a temperature-loading instrument for measuring skin blood flow in elderly subjects during cooling load: comparison with younger subjects. Int J Biometeorol. 2003;47(3):139–147. doi:10.1007/s00484-003-0158-212687449
- Song Y, Pan Y, Wang H, Liu Q, Zhao H. Mapping the face of young population in China: influence of anatomical sites and gender on biophysical properties of facial skin. Skin Res Technol. 2019;25(3):325–332. doi:10.1111/srt.1265230628726
- Nedelec B, Forget NJ, Hurtubise T, et al. Skin characteristics: normative data for elasticity, erythema, melanin, and thickness at 16 different anatomical locations. Skin Res Technol. 2016;22(3):263–275. doi:10.1111/srt.1225626333046
- Nam GW, Baek JH, Koh JS, Hwang JK. The seasonal variation in skin hydration, sebum, scaliness, brightness and elasticity in Korean females. Skin Res Technol. 2015;21(1):1–8. doi:10.1111/srt.1214524528115
- Youn SW, Na JI, Choi SY, Huh CH, Park KC. Regional and seasonal variations in facial sebum secretions: a proposal for the definition of combination skin type. Skin Res Technol. 2005;11(3):189–195. doi:10.1111/j.1600-0846.2005.00119.x15998330
- Lee JS, Ha J, Shin K, Kim H, Cho S. Different cosmetic habits can affect the biophysical profile of facial skin: a study of korean and chinese women. Ann Dermatol. 2019;31(2):175. doi:10.5021/ad.2019.31.2.175
- Proksch E. pH in nature, humans and skin. J Dermatol. 2018;45(9):1044–1052. doi:10.1111/1346-8138.1448929863755
- Hastie T, Tibshirani R. Generalized Additive Models. 1990.
- Galzote C, Estanislao R, Suero MO, et al. Characterization of facial skin of various Asian populations through visual and non-invasive instrumental evaluations: influence of age and skincare habits. Skin Res Technol. 2013;19:454–465.23521621
- Wendling PA, Dell’Acqua G. Skin biophysical properties of a population living in Valais, Switzerland. Skin Res Technol. 2003;9(4):331–338. doi:10.1034/j.1600-0846.2003.00040.x14641883
- Waller JM, Maibach HI. Age and skin structure and function, a quantitative approach (II): protein, glycosaminoglycan, water, and lipid content and structure. Skin Res Technol. 2006;12(3):145–154. doi:10.1111/j.0909-752X.2006.00146.x16827688
- Fluhr JW, Feingold KR, Elias PM. Transepidermal water loss reflects permeability barrier status: validation in human and rodent in vivo and ex vivo models. Exp Dermatol. 2006;15(7):483–492. doi:10.1111/j.1600-0625.2006.00437.x16761956
- Luebberding S, Krueger N, Kerscher M. Age-related changes in skin barrier function - Quantitative evaluation of 150 female subjects. Int J Cosmetic Sci. 2013;35(2):183–190. doi:10.1111/ics.12024
- Kobayashi H, Tagami H. Functional properties of the surface of the vermilion border of the lips are distinct from those of the facial skin. Br J Dermatol. 2004;150(3):563–567. doi:10.1046/j.1365-2133.2003.05741.x15030342
- Choi EH, Man MQ, Xu P, et al. Stratum corneum acidification is impaired in moderately aged human and murine skin. J Invest Dermatol. 2007;127(12):2847–2856. doi:10.1038/sj.jid.570091317554364
- Kikuchi K, Masuda Y, Yamashita T, Kawai E, Hirao T. Image analysis of skin color heterogeneity focusing on skin chromophores and the age-related changes in facial skin. Skin Res Technol. 2015;21(2):175–183. doi:10.1111/srt.1217425130270
- Kinn PM, Holdren GO, Westermeyer BA, et al. Age-dependent variation in cytokines, chemokines, and biologic analytes rinsed from the surface of healthy human skin. Sci Rep. 2015;5:10472. doi:10.1038/srep1047226035055
- de Rigal J, Des Mazis I, Diridollou S, et al. The effect of age on skin color and color heterogeneity in four ethnic groups. Skin Res Technol. 2010;16(2):168–178. doi:10.1111/j.1600-0846.2009.00416.x20456097
- Colomb L, Flament F, Wagle A, Agrawal D. In vivo evaluation of some biophysical parameters of the facial skin of Indian women. Part I: variability with age and geographical locations. Int J Cosmetic Sci. 2018;40(1):50–57. doi:10.1111/ics.12431