
 ?Mathematical formulae have been encoded as MathML and are displayed in this HTML version using MathJax in order to improve their display. Uncheck the box to turn MathJax off. This feature requires Javascript. Click on a formula to zoom.
Abstract
Increased blood ammonia (NH3) is an important causative factor in hepatic encephalopathy, and clinical treatment of hepatic encephalopathy is focused on lowering NH3. Ammonia is a central element in intraorgan nitrogen (N) transport, and modeling the factors that determine blood-NH3 concentration is complicated by the need to account for a variety of reactions carried out in multiple organs. This review presents a detailed quantitative analysis of the major factors determining blood-NH3 homeostasis – the N metabolism of urea, NH3, and amino acids by the liver, gastrointestinal system, muscle, kidney, and brain – with the ultimate goal of creating a model that allows for prediction of blood-NH3 concentration. Although enormous amounts of NH3 are produced during normal liver amino-acid metabolism, this NH3 is completely captured by the urea cycle and does not contribute to blood NH3. While some systemic NH3 derives from renal and muscle metabolism, the primary site of blood-NH3 production is the gastrointestinal tract, as evidenced by portal vein-NH3 concentrations that are about three times that of systemic blood. Three mechanisms, in order of quantitative importance, release NH3 in the gut: 1) hydrolysis of urea by bacterial urease, 2) bacterial protein deamination, and 3) intestinal mucosal glutamine metabolism. Although the colon is conventionally assumed to be the major site of gut-NH3 production, evidence is reviewed that indicates that the stomach (via Helicobacter pylori metabolism) and small intestine and may be of greater importance. In healthy subjects, most of this gut NH3 is removed by the liver before reaching the systemic circulation. Using a quantitative model, loss of this “first-pass metabolism” due to portal collateral circulation can account for the hyperammonemia observed in chronic liver disease, and there is usually no need to implicate hepatocyte malfunction. In contrast, in acute hepatic necrosis, hyperammonemia results from damaged hepatocytes. Although muscle-NH3 uptake is normally negligible, it can become important in severe hyperammonemia. The NH3-lowering actions of intestinal antibiotics (rifaximin) and lactulose are discussed in detail, with particular emphasis on the seeming lack of importance of the frequently emphasized acidifying action of lactulose in the colon.
Introduction
Pavlov et al described a link between NH3 and hepatic encephalopathy (HE) in 1893, but detailed investigation into the biochemistry of NH3 and its alterations in liver disease did not begin until the 1950s.Citation1,Citation2 Despite enormous research efforts, the multifaceted pathophysiology of HE, including the role played by NH3, remains poorly understood.Citation3,Citation4
In our experience, clinicians commonly believe that HE results in large part from the defective hepatic removal of NH3 produced from bacterial deamination of protein in the colon.Citation5 As a result, therapeutic interventions have been directed toward attempts to limit this putative source of NH3 via colectomy (1960s)Citation5,Citation6 and more recently via medical interventions, such as administration of inabsorbable disaccharides and antibiotics.Citation7 While this medical therapy clearly has efficacy, it is equally clear that multiple processes in addition to protein deamination in the colon play major roles in the production of NH3. This review peripherally discusses the connection between NH3 and HE, but rather focuses on analyzing available data concerning the quantitative influence of the multiple reactions in various organs that determine blood-NH3 level. Our ultimate objective was the creation of a quantitative model describing the interaction of the multiple factors involved in NH3 homeostasis, a model that makes possible estimation of the influence of individual pathophysiological processes, such as portosystemic shunting, on blood-NH3 concentration.
Ammonia is ionizable with equilibrium between the gaseous (NH3) and ionized (NH4+) forms:
(1) The ratio of NH3:NH4+ is described by the Henderson–Hasselbalch relation:
(2) where pKa = −log10 (Ka). Substituting the pKa of 8.95 (at 35°C)Citation8,Citation9 and pH 7.4 into EquationEquation 2
(2) , NH3/NH4+ = 0.028, or 2.8% of NH3 is in the form of NH3. It had been generally assumed that the high cell-membrane permeability of the gaseous form (NH3) allowed NH3 to equilibrate rapidly between blood and tissue via nonionic diffusion. However, it has recently been recognized that there are cell-membrane transporters for both NH4+ and NH3,Citation10,Citation11 and hence the assumption of nonionic equilibrium may not be valid. Nonionic equilibrium clearly does not occur in the kidney, where acid–base balance is maintained via the concentration of NH4+ in the urine (discussed in detail in the “Renal N balance” section).Citation12 This review focuses primarily on factors determining blood NH3, and is not concerned with the details of blood–tissue exchange.
The factors determining blood NH3 (the term “NH3” is used herein to refer to both the gaseous and ionized forms) are extremely complicated, because NH3 is a central element in multiple transfer processes involving nitrogen (N) within the body, with blood-NH3 concentration being the resultant of all these N metabolic processes. While a number of recent reviews have focused on various aspects of this complex process,Citation3,Citation13–Citation15 we attempt to provide a complete examination of all the factors determining blood NH3, with an emphasis on their relation to human clinical pathophysiology.
summarizes the quantitative contribution of the main N-metabolizing organs (gastrointestinal [GI] tract, liver, kidney, brain, and muscle) to the four primary N metabolites (urea, NH3, glutamine, and alanine). summarizes the influence of the various reactions occurring in the different organs and the resultant arterial and venous concentrations of N compounds, based on the organ blood flows listed in the second column of . The rapid turnover of N compounds results in a pseudo-steady state, with the net rate of organ uptake equal to organ production. For example, plasma glutamine has a turnover half-life of 25 minutes.Citation16 The values listed for “muscle” in are theoretical (not experimental) rates that have been adjusted to produce this steady state. Although it is obviously difficult to measure some of these values, eg, the total body-muscle glutamine production, it will be shown that the theoretical values in are in rough agreement with experimental measurements.
Figure 1 Total human N balance.
Abbreviations: GI, gastrointestinal; AAs, amino acids, Gln, glutamine, Ala, alanine.
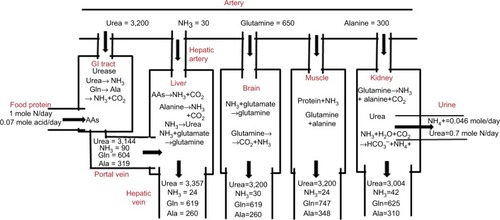
Table 1 Postprandial human blood-flow rates
The results in and should be regarded as highly simplified, first-order attempts to quantify the role played by various organs in the metabolism of N compounds, nitrogen balance, and the contribution of these organs to plasma-NH3 concentration. Measurements of human-organ N fluxes are difficult to perform, limited in number, and have large experimental variability, especially for the GI tract, which requires simultaneous sampling of portal and hepatic vein blood. We have limited the analysis to the four major N metabolites: urea, NH3, glutamine, and alanine. The attention paid to glutamine and alanine to the exclusion of the other amino acids (AAs) is in part related to the fact that the arterial blood concentrations (in units of micromole/liter) of glutamine (650 µM) and alanine (300 µM) are appreciably higher than those of other AAs, most of which have concentrations <100 µM.Citation17 More importantly, as discussed herein, glutamine and alanine are unique among the AAs in having important functions in interorgan N transport. Finally, we have only considered N balance in five organs (GI tract, liver, kidney, brain and muscle) and neglected the contributions of other major organs, such as adipose or lungs. Although the lungs may be involved in N exchange in rats,Citation18 they do not seem to be important in humans.Citation19 Although the brain is included because of its obvious clinical importance in HE, its contribution to the systemic N balance is small with negligible NH3 productionCitation20,Citation21 and small glutamine uptake.Citation22,Citation23 This analysis focuses on the net organ balance of NH3 and other N solutes. Studies following tracer N-labeled NH3 are not useful, because the N in NH3 exchanges rapidly (in seconds) with many AAs.Citation22,Citation24
Branched-chain AAs (BCAAs; leucine, isoleucine, and valine) have unique metabolic properties that have made them the subject of intense study.Citation25 Their total normal plasma concentration is about 215 µM,Citation26 less than that of alanine, and they make only minor direct contributions to organ-NH3 balance.Citation27 However, they have important indirect contributions through their influence on the muscle metabolism of glutamine and alanine. In chronic liver disease (CLD), plasma-BCAA concentrations are significantly reduced. HolečekCitation28–Citation32 reviewed their influence on muscle-protein metabolism and plasma NH3 and the therapeutic implications of nutritional BCAA supplementation. This is discussed in more detail in the following sections.
Brief overviews of the factors determining the steady state balance for urea, glutamine and alanine, and NH3 are presented next, followed by in-depth discussions of N metabolism in the GI tract, kidney, muscle, and liver. Then, we focus on the pathophysiology of the hyperammonemia associated with chronic and acute liver disease. Following a brief review of the hyperammonemia accompanying genetic urea-cycle disorders, we discuss the mechanistic basis of therapeutic GI interventions that have been used in the treatment of hyperammonemia in CLD. Finally, we discuss the clinical implications of blood-NH3 measurements.
Urea balance
The data for urea in and are based on simple metabolic balance estimates. Renal urea excretion is the primary N-excretory mechanism in mammals. The standard human diet contains about 85 g protein/day,Citation33 corresponding to about 13.6 g NCitation34 or about 1 M N/70 kg/day. In a steady state, this intake must be balanced by the excretion of 1M/day of N, which occurs via urine (~82%), feces (~15%), and skin (~3%).Citation35 Urine N is primarily urea (~87%), NH3 (~6%), and creatinine (~7%).Citation36 Therefore, about 0.7 M urea N or 350 mm of urea is excreted per day ().
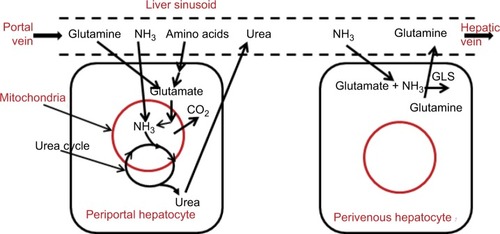
The normal renal urea clearance of 75 mL/min implies an arterial urea (UArt) concentration of 3,200 µM (). Urea is produced only in the liver by the urea-cycle system. As illustrated in , the liver removes AAs via transamination to l-glutamate, which is transported into liver mitochondria and deaminated by glutamate dehydrogenase. This process releases NH3, which is immediately converted to urea and cycled to the cytosol. The AAs metabolized by the liver represent both those newly absorbed from the intestinal tract and AAs released systemically during normal protein turnover. It should be emphasized that the NH3 produced by liver mitochondrial AA metabolism is completely captured and converted to urea by the urea cycle, and thus does not directly contribute to systemic NH3 (the focus of this review). The best evidence in support of this concept is that an intravenous (IV) AA infusion at a rate roughly three times the normal protein intake increased the urea-excretion rate fourfold, raised blood-urea N concentration by 10,000 µM, but had no appreciable effect on blood-NH3 concentration (normal, about 30 µM).Citation37
Figure 2 Processes involved in N balance in the liver.
Studies in humans of the kinetics of 15N- or 14C-labeled urea have found that only about 75% of IV labeled urea was recoverable in the urine (no urea is present in feces).Citation38–Citation40 Since mammalian cells lack urease and cannot metabolize urea, this metabolism must be the result of bacterial urease activity that presumably takes place in the GI tract:
(3) Direct support for this concept comes from the observation that hydrolysis of urea is negligible in germ-free ratsCitation41 and dogs.Citation42 In , it is assumed that GI urea metabolism is 25% of renal urea excretion (or 20% of the total renal plus GI), corresponding to normal GI urea clearance of 18.75 mL/min or MGI = −61 µm/70 kg/min (, where the negative sign indicates net urea extraction), which produces 122 µm/70 kg/min of NH3. A fraction of this NH3 is incorporated into bacterial protein and trapped in the GI tract (not well quantified in humans), while the remainder is absorbed into the portal circulation (). The portal vein urea concentration (UPV) in is determined from the net GI urea balance:
(4) where QPV is the portal vein flow rate. Assuming a normal QPV of 1.1 L/min/70 kgCitation43 and solving EquationEquation 4
(4) , UPV = UArt − 55 µM = 3,144 µM. The total body urea production is the sum of the urine secretion (350 mm/day) plus GI metabolism (87.5 mm/day) = 437 mm/day = 305 µm/70 kg/min. Since only the liver can synthesize urea, the corresponding hepatic vein urea concentration (UHV) is determined from the balance equation:
(5) where QHA is the hepatic artery flow rate (~0.45 L/min/70 kg).Citation43 Using the previously determined values for UArt (3,200 µM) and UPV (3,144 µM), solving EquationEquation 5
(5) indicates UHV = 3,357 µM. The only other organ that alters urea concentration is the kidney, which excretes 244 µm/70 kg/min of urea:
(6) where URV is the renal vein urea concentration and QRen the renal blood flow. Assuming a QRen of 1.24 L/minCitation43 and URV = 3,004 µM. These arterial and venous urea concentrations are illustrated in , and organ-urea uptake or output and blood flow are summarized in .
Glutamine, alanine, and branched-chain amino-acid balance
Glutamine has a major role in N transport, and knowledge of its rate of synthesis and metabolism in different body organs is crucial to understanding NH3 physiology. Skeletal muscle provides a large carbon, N, and energy reservoir, and glutamine is its primary transfer agent, acting, for example, as a major source for gluconeogenesis.Citation44,Citation45 Skeletal muscle has an extremely high free-glutamine cytosolic concentration of about 20,000 µMCitation46 that allows maintenance of relatively constant plasma glutamine of about 650 µM in response to rapid changes in utilization. In the postprandial state, skeletal muscle is the major endogenous source of glutamine.Citation47 As discussed herein, muscle glutamine and alanine synthesis is linked to BCAA metabolism. Estimates for the normal postprandial glutamine balance of the GI tract, liver kidney, brain, and muscle are listed in , and corresponding venous plasma concentrations are shown in . As discussed, it is assumed in that muscle production rates must balance other organ uptake. This theoretical muscle glutamine-production rate of rate of 113.67 µm/min/70 kg () is of the same order as the experimental measurement of 95 µm/min/70 kg of Damink et alCitation48 for the lower legs in patients with stable cirrhosis.
As shown in , there are high rates of glutamine utilization in the kidney and GI tract, organs for which glutamine is used as a source for energy production. The first step in glutamine metabolism is enzymatic conversion by glutaminase (GA) to NH3 and glutamate, which is then further metabolized to alanine, NH3, CO2, and minor amounts of citrulline and proline:
(7) Most of the alanine produced by this process in the kidneys and GI tract () is then metabolized by the liver during gluconeogenesis. In the kidneys, the NH3 produced has an important role in the regulation of acid–base balance and is discussed in more detail in the “Renal N balance” section. Glutaminase is located primarily in kidney, GI tract, liver, and brain tissue, and is notably absent from skeletal muscle.Citation49 Therefore, though muscle cannot produce NH3 by GA, NH3 is produced in muscle via another pathway, the purine nucleotide system (discussed in detail in the “Muscle N balance” section).Citation50
In the liver, there are two competing processes affecting glutamine (see ). In periportal hepatocytes, glutamine is metabolized by GA and the AA mitochondrial system to CO2, with the NH3 converted to urea. In perivenous hepatocytes, glutamine is synthesized from glutamate and catalyzed by glutamine synthetase (GLS):
(8) In mammals, all glutamine synthesis involves the amination of glutamate via the action of GLS. As such, EquationEquation 8
(8) depicts the necessary last step in glutamine synthesis, an important mechanism for clearing NH3 produced in the GI tract. These two hepatic processes involving glutamine are regulated in response to the body’s metabolic and acid–base needs. Because GLS is at the venous end of the sinusoid, the newly synthesized glutamine cannot be metabolized by the periportal GA.Citation51 Based on the arterial, portal, and hepatic vein glutamine measurements of van de Poll et alCitation27 and the estimated flow rates, these two effects roughly cancel each other out, so there is negligible hepatic glutamine uptake.
Alanine has a similar but smaller function than glutamine, serving as a muscle carbon and N reservoir that is tapped during the postprandial and fasting state. Some of the glutamine released from muscle is converted to alanine by the kidney and GI tract. Most of this alanine is consumed by the liver for gluconeogenesis, in marked contrast to glutamine, for which the liver has negligible uptake ().
Most AAs are metabolized in the liver via cytosolic aminotransferase to glutamate, which is then converted to urea. The BCAAs are unique among the AAs in that, since cytosolic branched-chain aminotransferase (BCAAT) is absent in the liver, the liver cannot metabolize BCAAs to urea, and BCAAs do not have hepatic first-pass metabolism.Citation25 The primary site of BCAAT is muscle, with about half the muscle AA uptake consisting of BCAAs.Citation25,Citation31,Citation32 As discussed in the “Muscle N balance” section, this conversion of BCAAs to glutamate provides the major source of muscle glutamine and alanine production.
Ammonia balance
Systemic NH3 is a byproduct of the urea, glutamine, and alanine metabolism discussed. Normal arterial plasma NH3 ranges 12–40 µM, with significant variation obtained by various laboratories using different methodologies.Citation52 We have assumed a normal value of 30 µM in . Plasma NH3 is relatively constant, eg, it does not change significantly following a meal.Citation53 Since human lung NH3 metabolism is insignificant, arterial concentration should be equal to central venous concentration.
As shown in , the main sites of systemic NH3 production are the kidneys and GI tract. In kidneys, 30 µm/min/70 kg of glutamine is removed and 13 µm/min/70 kg of alanine and 15 µm/min/70 kg of NH3 added to the systemic circulation. One can calculate a net N balance for this glutamine (2 N/molecule), assuming that the only N products of glutamine metabolism are alanine and NH3:
(9) Of the 47 µm/min/70 kg NH3 produced, 15 µm/min/70 kg () enters the systemic circulation and the other 32 µm/min/70 kg is secreted in the urine as NH4+ (). EquationEquation 9
(9) is an overestimate of the NH3 produced, because there are also significant amounts of proline and citrulline produced, in addition to alanine.
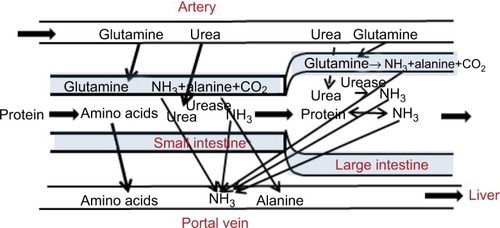
The GI tract is the major site of NH3 production, adding 66 µm/min/70 kg () to the portal vein, resulting in an NH3 concentration in the portal vein of about three times the arterial concentration (). GI NH3 is formed by three distinct processes: bacterial urease hydrolysis of circulating urea (EquationEquation 3(3) ), metabolism of glutamine (EquationEquation 7
(7) ) extracted from circulating blood, and bacterial deamination of luminal protein. The first two processes can be quantified from urea and glutamine arterial–venous concentration differences across the GI tract (; ). As listed in , 61 µm/min/70 kg urea and 50 µm/min/70 kg glutamine are metabolized and 66 µm/min/70 kg NH3 and 21 µm/min/70 kg alanine added to the portal circulation. An N balance on these three solutes (units in µm/min/70 kg) indicates:
(10) As indicated in EquationEquation 10
(10) , the NH3 produced from glutamine metabolism is uncertain, because significant (but unknown in humans) amounts of proline and citrulline (with their attendant N) are produced in addition to alanine.Citation54 The third process (NH3 release from bacterial protein deamination) is difficult to quantify, because it represents net NH3 release and NH3 uptake by bacteria and cannot be determined simply from arterial–venous differences. As discussed in the “GI-tract N balance” section, this process could potentially produce another 29 µm/min/70 kg NH3. Since only 66 µm/min/70 kg NH3 enters the systemic circulation via the portal vein, less than the 122 µm/min/70 kg NH3 produced just from urea, much of this NH3 is presumably converted to bacterial protein.
Since postprandial skeletal muscle conversion of protein to glutamine requires additional N (), muscle is a potential site of NH3 uptake. In the normal postprandial state, this NH3 uptake is small (~6 µm/min/70 kg) compared to liver uptake (~75 µm/min/70 kg) (). However, as discussed herein, in liver failure this muscle contribution increases and becomes of major importance.
The liver is the major organ responsible for NH3 removal. As shown in , there are two distinct liver pathways for NH3 metabolism. Periportal hepatocytes represent the major mass of the liver, responsible for most of the metabolism, including the breakdown of AAs and the very efficient mitochondrial conversion of NH3 to urea by the urea-cycle system. A fraction of the NH3 entering the liver via the portal vein diffuses to this site and is converted to urea. The second NH3-metabolic pathway is the conversion of NH3 to glutamine by cytosolic GLS (EquationEquation 8(8) ) that is localized in a small ring of cells encircling the terminal hepatic venules: perivenous hepatocytes.Citation51,Citation55 Although there are no quantitative human measurements, in mouseCitation56 and pigCitation57 liver, about half of the removed NH3 is converted to urea and the other half to glutamine.
GI-tract N balance
As discussed, it is clear from arterial–venous concentration measurements that the GI tract is the major source of the NH3 that determines plasma concentration. Based on a variety of earlier studies,Citation58,Citation59 the current (2016) textbook description is that NH3 “… is produced primarily in the colon, where bacteria metabolize proteins and other nitrogen-based products into ammonia”.Citation60 Therefore, it is generally assumed that the main source of GI-NH3 production results from two distinct colonic bacterial processes: urea hydrolysis (EquationEquation 7(7) ) and protein deamination of malabsorbed protein. More recently, a third mechanism, glutamine metabolism (EquationEquation 7
(7) ), which occurs throughout the GI tract, has been proposed as another major contributor to GI-NH3 production.Citation14 These three processes are illustrated schematically in and discussed in detail herein. One emphasis of this discussion will be demonstrating that there are serious questions about the conventional view that bacterial urea hydrolysis occurs in the colon. The location of bacterial urea metabolism has important clinical significance, because one of the primary forms of HE treatment is directed at decreasing this GI-NH3 production and it is important to understand the location and types of bacteria involved.
Figure 3 Processes involved in N balance in the gastrointestinal tract.
While bacteria are commonly recognized to produce NH3 in the gut, it should be noted that bacteria in the process of replicating must synthesize protein. A sizable fraction of the requisite nitrogen may be supplied by NH3, and hence bacteria may serve as a mechanism of eliminating intestinal NH3. Such bacterial uptake of NH3 is supported by the observation that enteric bacteria rapidly proliferate in a medium in which NH3 is the sole source of nitrogen.Citation61 The relatively low bacterial counts of the small bowel would seemingly relegate the importance of enteric bacterial accumulation of nitrogen to the colon. However, Miner-Williams et alCitation62 found that bacterial protein accounted for >50% of the roughly 0.6 g nitrogen passing the terminal ileum of healthy controls over an 8-hour period following a casein meal.
The commonly accepted idea that AA deamination by colonic bacterial metabolism is a primary net producer of gut NH3 has little direct experimental support. The massive proliferation of bacteria in the colon to counts of >1011/g feces could obviously be a major NH3 sump if most of the bacterial N was derived from NH3. The best (but indirect) argument for this concept that colonic bacteria are a net producer of NH3 is that the fecal NH3 estimated using swallowed dialysis bags is relatively high – about 14 mM (1%–2% of total fecal N) – and protein deamination is a likely source of this NH3.Citation40 A rough estimate of the balance between colonic bacterial production minus bacterial removal is provided by the difference between total N entering and leaving the large intestine, assuming that all this difference reflects net bacterial NH3 production. Gibson et alCitation63 compared the total N in ileostomy drainage (1.8 g/day) versus that in normal subject feces (1.2 g/day). Assuming that this difference (0.6 g/day) was all converted to NH3, it would be equivalent to 29 µm/min/70 kg NH3, about 16% of the total GI-NH3 production from all sources: protein deamination (~29 µm/min), urea hydrolysis (~122 µm/min/70 kg), and glutamine metabolism (~20 µm/min/70 kg).
Intestinal glutamine metabolism (EquationEquation 7(7) ) is now generally accepted to be a major source of GI NH3.Citation14 The glutamine extraction across the entire GI tract (arterial–portal vein NH3) varies from about 33% in ratsCitation54 and dogsCitation54 to 12% in monkeysCitation54 and 7.6% in humans (). Glutamine has a major role in maintaining normal gut function. It is an oxidative fuel source for the intestine. In the perfused rat intestine, glutamine was the source of 32% of the CO2 produced, even though the perfusate had a high glucose concentration.Citation54 This is species-dependent. In dogs in the 24-hour fasted state, glutamine provided only about 15% as much fuel as glucose.Citation64 The alanine produced by glutamine metabolism (EquationEquation 7
(7) ) is used by the liver for gluconeogenesis during the postprandial period. These two functions are regulated in response to the body’s nutritional needs. In dogs, the fraction of glutamine converted to alanine falls from 67% in the postprandial period (24-hour fast) to 20% after a 96-hour fast.Citation64 This fraction is important for NH3 balance, because for each alanine produced there is one less NH3 released than is the case with complete oxidation of glutamine as a fuel source (EquationEquation 10
(10) ). Glutamine is important for a number of other intestinal functions, including regulation of protein synthesis and as a precursor of nucleic acid biosynthesis.Citation65
Although there is unequivocal evidence from urea-tracer studies that in humans, about 20% of the urea produced is metabolized to NH3 in the GI tract, there are important questions about the actual location where this occurs. The large intestine has been assumed to be the main site of urea catabolism because the concentration of colonic bacteria exceeds that of the more proximal gut by roughly three orders of magnitude. However, there is strong evidence that the large intestinal mucosa is impermeable to urea, preventing systemic urea from reaching luminal bacteria. The measured rate of transport of blood urea to colonic saline perfusions is very small (clearance of about 0.2% colonic urea blood flow), and even this very small transport may be artifactual, because the absolute appearance rate in the lumen is not altered when plasma-urea concentration was doubled by IV urea infusion.Citation66 Similarly, there is negligible urea absorption when the human colonic lumen is perfused with high urea concentrations.Citation67 In marked contrast, urea readily permeates tight small-intestine junctions,Citation68–Citation70 and the urea concentration in human ileostomy fluid is nearly identical to plasma.Citation71 Additional support for the small-intestine site of urea metabolism is the observation of Gibson et alCitation71 that the absolute rate of GI-urea metabolism in patients with ileostomies and nonfunctioning colons is similar to that in normal subjects.
Using ingested cellophane dialysis bags to sample stool-fluid concentrations, Wilson et alCitation72 found that there was no detectable fecal dialysate urea in normal subjects. Supporters of the argument that the colon is the main site of urea metabolism have argued that this implies that bacteria catabolized 100% of the urea that diffused into the lumen.Citation73 Several observations argue against this interpretation. First, if colonic bacteria actually catabolized urea as rapidly as it enters the colon, the rate of urea metabolism would be diffusion-limited and directly proportional to plasma-urea concentration. However, the absolute rate of GI urea metabolism remains normal in patients with chronic renal failure, even though their plasma-urea concentration is up to six times normal.Citation74 Consistent with this is the important observation that blood NH3 is not elevated in chronic renal failure patients with urea levels six times normal.Citation75 Second, if colonic bacteria were consuming most of the urea, one would predict that a large fraction of the colonic NH3 production should be derived from urea metabolism. However, Wrong et alCitation76 labeled the plasma urea with 15N and found that the majority of the fecal NH3 was not derived from urea, but from some other source, such as plasma glutamine metabolism (EquationEquation 7(7) ) or protein deamination.
These arguments indicate that only a minor fraction of urea metabolism occurs in the large intestine, and thus implies that most bacterial urea metabolism must occur in the stomach and small intestine. This would provide an explanation for the unexpected observation that the absolute rate of urea metabolism is independent of plasma-urea concentration. Because of high small-intestine urea permeability,Citation70 the luminal intestinal urea concentration is approximately equal to plasma urea (~3.2 mM). This indicates that the rate of small-intestine bacterial urea metabolism is maximal at normal serum urea concentrations and further increases in plasma urea (eg, in renal failure) would not be expected to increase the urea metabolic rate.Citation74 For example, Helicobacter pylori urease has a Km of 0.48 mM,Citation77 sixfold lower than normal plasma urea (3.2 mM). If the rates of gastric and small-intestine bacterial urea metabolism were saturated at normal plasma-urea concentrations, it would also explain the “surprising” result that administering urea by mouth did not increase plasma-NH3 levels in cirrhotic liver patients.Citation78 Administering the same amount of urea by rectum increased plasma NH3 by a factor of about 4.Citation78 The increased gastric and small-intestine urea produced by oral dosing of urea does not increase NH3 production from bacteria that are already consuming urea at a maximum rate, and unmetabolized urea is absorbed in the small intestine before reaching colonic bacteria.
Even if the colonic mucosa were impermeable to urea, a small amount of urea would be delivered to the colon in the ileal effluent. Assuming a 1 L/per day ileal flow containing a urea concentration equal to that of plasma would make possible a colonic urea clearance of 1 L/day. This colonic clearance is negligible compared to the total GI urea clearance, which is 25% of renal urea clearance or about 27 L/day. One would expect this colonic clearance to increase as plasma (and thus ileal) urea increases in patients in renal failure. But even the sixfold increase in plasma urea observed in the studies of WalserCitation74 would only increase colonic clearance to about 22% of normal gut clearance, and this increase probably would not produce a recognizable increase in serum-NH3 levels in renal failure patients.
Although these arguments that most bacterial urea metabolism occurs in the stomach and small intestine seem convincing, surprisingly little attention has been directed at their implications. The only major urea-splitting bacteria that have been clearly identified in the upper gut are H. pylori. There is a surprising divergence of opinion in regard to the importance of H. pylori metabolism as a source of systemic NH3. The largest study was that of Chen et alCitation79 of 457 cirrhotic Chinese patients. They found that blood NH3 was significantly higher in H. pylori-positive (78 µM) versus H. pylori-negative (54 µM) patients, and that following successful eradication of H. pylori, blood NH3 declined to 54 µM, the value observed in the initially H. pylori-negative subjects. No such decline was observed in subjects in whom eradication efforts had failed. As might be expected, the authors concluded that “H. pylori is an important factor for inducing high blood-NH3 concentration in cirrhotic patients”. Other smaller studies have found no relationship between the existence of H. pylori infection and serum-NH3 concentrations.Citation80,Citation81 A meta-analysis published in 2013Citation82 came to the unusual conclusion that H. pylori infection increases serum NH3, but only in subjects of Asian ethnicity. While the explanation for this putative ethnic difference may be attributable to unclear technical differences among studies carried out in different countries, H. pylori organisms appear to be more aggressive in Asian subjects. It seems possible that H. pylori in these subjects produces more NH3. As discussed, only a fraction (50% or less) of the total NH3 produced in the GI tract appears in the portal vein, and presumably the remainder is converted into bacterial protein. This is supported by in vitro studies of H. pylori urea metabolism, where only about 12% of the NH3 produced was recovered as NH3 in the medium.Citation83 If the fraction of the NH3 converted into protein declined with increasing NH3 production, an influence on serum NH3 might only be observed at very high H. pylori NH3-production rates.
In contrast to the intensive study of urea catabolism by H. pylori, there has been limited research on other urea-splitting organisms that might inhabit the small bowel. In an older study (1966), before it was recognized that only bacteria could metabolize urea, Aoyagi et alCitation84 determined urease activity in mucosal biopsy samples. Not surprisingly, they found especially high gastric activity (presumably H. pylori), but also found jejunum mucosal urease activity that was about threefold that of the colon. Although the relationship between this mucosal activity and total luminal activity is uncertain, these results clearly indicate that there are urea utilizing bacteria in the human small intestine. The finding of higher bacterial urease activity in the small bowel versus colonic biopsies is surprising, given the likelihood of much greater luminal bacteria contamination in colonic biopsies. Presumably, small-bowel bacteria are either more closely associated with mucosal tissue than is the case with colon tissue or have higher urease activity. Exclusively of H. pylori, there has been surprisingly little study of human urease containing intestinal bacteria, with most attention directed to the presence of such organisms in urinary tract infections. Suzuki et alCitation85 studied the urease activity of 120 strains of human intestinal bacteria, and found evidence of urease activity in a sizable fraction of Bifidobacterium and Proteus spp. and a small fraction of Lactobacillus.
These arguments have focused on the evidence supporting a small-intestine or gastric site of urea metabolism. However, it should be emphasized that there is a body of contradictory evidence favoring the large intestine as the primary site of urea metabolism.Citation58,Citation59 Probably the strongest evidence favoring the large-intestine site in humans is that unabsorbable disaccharides (eg, lactulose), which are assumed to act primarily via acidification of colonic contents, are nearly as effective as antibiotics in reducing blood NH3 in patients with CLD.Citation86,Citation87 The potential mechanisms by which lactulose reduces blood NH3 are discussed in more detail in the “Gastrointestinal therapeutic approaches to lowering blood ammonia “ section.
As the preceding discussion demonstrates, there is uncertainty about the important clinical question of the site of NH3 production in the GI tract. This question could be definitively answered by determining NH3 concentration and flow rate in veins draining the different GI-tract segments. We are aware of only two preliminary reports. From measurements of NH3 concentration and flow rates in the portal and superior mesenteric veins of the pig, van Berlo et alCitation88 estimated that “ … more than 75% of total intestinal” NH3 was produced in the small intestine. van der Hulst et alCitation89 reported concentrations of 65, 33, and 30 µM in veins draining the jejunum, ileum, and colon, respectively, in patients during GI-cancer surgery. Although they did not measure flow rates, since total small-intestine blood flow is about fivefold that of the large intestine,Citation90 these NH3-concentration measurements suggest that about 80% of GI-tract NH3 is produced in the small intestine. Both of these results are consistent with arguments that the conventional view that GI tract NH3 is produced primarily by colonic bacteria is questionable.
Renal N balance
Ammonium (NH4+) urinary excretion () is the most important factor in the control of acid–base balance. Normal human net endogenous acid production (NEAP) depends on dietary protein composition, and we have assumed in that NEAP is 70 mEq/70 kg/day.Citation91,Citation92 In the steady state, this is balanced by the renal net acid excretion, which consists of about a third titratable acids (eg, phosphate) and two-thirds NH4+,Citation92 or 46 mm/70 kg/day NH4+ excreted in urine (). This urine NH4+ cannot come solely from plasma-NH3 clearance, because with arterial plasma NH3 of only 30 µM, it would require renal plasma clearance of about 1.5 L/min/70 kg, which is greater than the total QRen. Most of the NH4+ excreted in the urine is provided by glutamine metabolism (EquationEquation 7(7) ), which releases more NH3, than is excreted in the urine; therefore, the kidney is a net producer of systemic NH3 (; ).
Figure 4 Schematic diagram of processes involved in N balance in the kidney.
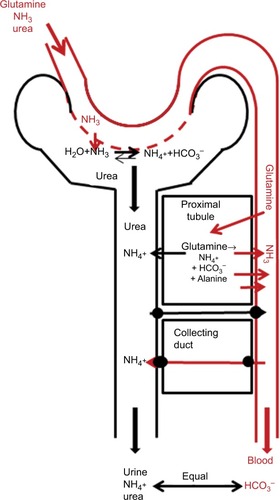
Not surprisingly for something as important as acid–base balance, the processes involved in renal NH4+ excretion are complicated.Citation92,Citation93 NH3 is synthesized from glutamine metabolism (EquationEquation 7(7) ), primarily in the proximal tubule, and the amount of NH4+ excreted in the urine is controlled by a complex set of collecting-duct NH4+ and HCO3− transporters (). In addition to providing NH3, the renal metabolism of glutamine provides fuel (eg, ATP) and is used for gluconeogenesisCitation94 or alanine synthesis.Citation95 In the normal postprandial state, the overall renal N balance assumed in (in units of µm/min/70 kg) is:
(11) where the alanine and 15 µm/min/70 kg NH3 are added to the systemic circulation and the 32 µm/min/70 kg NH4+ (0.046 M/day, ) is excreted in the urine. This balance depends on the metabolic acid–base state. In mild experimental acidosis in which total acid intake is increased by factor of about 3, urine NH4+ excretion increases threefold, renal glutamine uptake doubles, and NH3 added to the systemic circulation is relatively unchanged.Citation96 It should be emphasized that the NH3 added to the systemic circulation by the kidney does not undergo the “first-pass” type of metabolism of intestinal NH3 (about 70% efficient). Therefore, NH3 delivered to the serum via the kidney has a roughly threefold-greater effect on serum NH3 than is the case with intestinally produced NH3.
Muscle N balance
As discussed, the release of AAs by skeletal muscle () is a major source of both energy and N in the postabsorptive state. Muscle N balance has been comprehensively reviewed by Damink et al,Citation14 and this section summarizes the main features. Although muscle releases all AAs, alanine and glutamine dominate, accounting for >50% of the total.Citation97 Glutamine is utilized predominantly by the kidney and GI tract, while alanine is used by the liver, primarily for gluconeogenesis (). The major source for muscle glutamine and alanine synthesis is BCAAs, which are transaminated by BCAAT to glutamate.Citation28 Glutamate can then either pick up an NH3 molecule and be converted to glutamine by GLS (EquationEquation 8(8) ) or react with pyruvate and be converted to alanine.Citation28 As such, BCAA metabolism plays a central role in controlling muscle glutamine and alanine synthesis and NH3 uptake ().
Figure 5 Schematic diagram of processes involved in N balance in the skeletal muscle.
Abbreviations: BCAAs, branched-chain amino acids, GLS, glutamine synthetase.
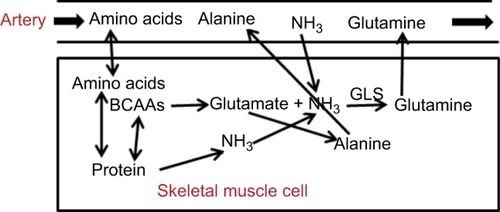
The NH3 required for glutamine synthesis can be provided either by uptake from the plasma or muscle AA metabolism. Muscle-NH3 uptake is much lower than glutamine production, and in a number of studies no significant muscle-NH3 uptakes have been detected.Citation14 In , the standard postprandial muscle-NH3 uptake is about 6 µm/min/70 kg, the glutamine release of 97 µm/min/70 kg. Muscle clearly cannot rely on NH3 uptake from plasma for glutamine synthesis, because the rate of glutamine synthesis may be greater than the total rate of NH3 supplied by arterial blood flow (). Therefore, most of the additional nitrogen released in the form of glutamine must come from muscle AA breakdown (). Muscle utilizes the purine-nucleotide cycle to produce N from protein breakdown.Citation50
Human muscle-tissue samples indicate that there is a large free muscle-NH3 concentration of about 150 µM,Citation98 roughly similar to the 300 µMCitation99 NH3 Km of GLS, the rate limiting enzyme of glutamine production. Since this is fivefold normal arterial NH3, it is presumably supplied by muscle-protein catabolism. Although we have emphasized the role of muscle-glutamine release as a fuel and gluconeogenesis source during the postprandial period, another function of muscle glutamine emphasized by Chang et alCitation100 is as a means of “nitrogen disposal” during AA breakdown that is less toxic than NH3.
The basal muscle-NH3 uptake of 6 µm/min/70 kg is negligible relative to normal liver-NH3 uptake (75 µm/min/70 kg). However, in a variety of animal studies, it has been shown that the rate of muscle-NH3 uptake increases roughly linearly with arterial NH3.Citation14 As discussed herein, in patients with increased NH3 secondary to cirrhosisCitation101,Citation102 or acute liver failure (ALF),Citation103 this increased muscle-NH3 uptake becomes important in limiting hyperammonemia.Citation104 Holeček et alCitation105 showed that in an in vitro rat-muscle model, increased bathing NH3 concentration increased BCAA oxidation and glutamine synthesis, suggesting that the increased plasma NH3 in cirrhosis may directly activate BCAA metabolism.
During exercise, muscle-protein catabolism increases the rate of muscle-NH3 production, with muscle becoming a net supplier of systemic NH3.Citation98,Citation106 In studies of Katz et al,Citation98 muscle NH3 balance went from a net NH3 uptake (for two legs) of about 6 µm/min/70 kg (identical to the value listed ) during rest, to a small net release of about 4 µm/min/70 kg during submaximal exercise, rising markedly to 178 µm/min/70 kg during maximal exercise. This is associated with a small increase in arterial plasma NH3 from 21 µM at rest to 27 µM during submaximal exercise and a dramatic fivefold increase to 112 µM during maximal exercise, when the rate of NH3 production is so high that it overwhelms the GLS system. Since submaximal exercise (50% VO2max) produces only minor changes in muscle-NH3 balance, it is assumed that the values in are applicable to the human postprandial state, even during the normal daily exercise regimen. It should once again be emphasized that NH3 released by muscle does not undergo first-pass metabolism in the liver, and hence has a disproportionate effect on blood NH3 relative to intestinally produced NH3.
As this discussion indicates, muscle GLS has at least two important functions related to NH3: it converts the muscle NH3 produced during postprandial protein catabolism to glutamine, and during hyperammonemia, it is an important factor in removing systemic NH3. A direct confirmation of these two muscle-GLS functions was provided by He et al,Citation45 in which GLS was selectively knocked out in mouse skeletal muscle. The knockout (KO) mice were healthy and fertile, with normal weight gain and organ histology. Fed KO mice had relatively normal blood chemistry, including normal arterial glutamine. However, major differences became apparent during fasting, when presumably muscle-protein catabolism becomes important. At 20 hours of fasting, the rate of muscle (actually, hindquarter)-glutamine production increased more than fourfold over the fed state in wild-type mice, but was unchanged from the fed state in the KO mice. The second GLS function was tested by IV administration of NH4HCO3 at varying rates. In control mice, blood NH3 remained relatively normal until the rate exceeded 40 µm/h, after which it rose rapidly, increasing eightfold at rates of 50 µm/h. This indicates that normal NH3-metabolizing functions in such tissue as liver and muscle become saturated and have a maximal removal rate of 40 µm/h/mouse. In the KO mouse, this maximal removal rate was reduced by half to 20 µm/h/mouse. Since the only difference between the normal and KO mice was the lack of muscle GLS, this implies that muscle contributes 50% to mouse NH3-metabolizing potential during hyperammonemia. It may seem antithetical to state that muscle is a major site of NH3 removal when it was emphasized in the “Urea balance” section that renal urea secretion is the only N-excretory process in humans. In actuality, the NH3 taken up by muscle is used to synthesize AAs (primarily glutamine and alanine), which are then converted to urea by the liver. To the extent that some of this glutamine is metabolized to NH3 in such organs as kidneys or intestines, this concept of net muscle-NH3 removal is incorrect.
Liver N balance
As previously discussed and summarized in , the liver is the major organ responsible for normal NH3 removal (ie, detoxification). There are two pathways involved: periportal hepatocyte conversion of NH3 to urea by the urea-cycle system, and perivenous hepatocyte conversion of NH3 to glutamine by GLS (EquationEquation 8(8) ). These processes are illustrated in . Resection of up to 90% of the liver in the pig surprisingly results in no significant change in serum NH3 levels,Citation107 indicating that liver-NH3-detoxifying capacity is far in excess of normal requirements. It also suggests that liver-NH3 metabolism is responding to some sort of arterial blood NH3 set point and is independent of absolute liver mass. This raises the possibility that the NH3 normally presents in blood has a physiological function yet to be demonstrated.
A significant fraction of glutamine entering the liver is catabolized to urea by the standard AA-metabolic process (transamination to glutamate, which then enters urea cycle) in periportal hepatocytes. However, this fraction cannot be determined simply from the net liver balance in , because glutamine is also synthesized from glutamate in perivenous hepatocytes (EquationEquation 8(8) ), and liver-glutamine balance is the difference between the rate of glutamine production and glutamine catabolism:
(12) Since glutamine output is approximately zero (), glutamine production and catabolism are about equal. Of the total liver-NH3 removal rate (75 µm/min/70 kg, ), about 50% results from glutamine production, implying that liver-glutamine production is about 37 µm/min/70 kg. Therefore, from EquationEquation 12
(12) , liver-glutamine catabolism must also be about 37 µm/min/70 kg. This is a major component of glutamine metabolism (37% of total muscle-glutamine production, ), and the liver is primarily responsible for controlling steady-state glutamine arterial concentration. Knocking out this glutamine catabolism produces a 25-fold increase in arterial glutamine.Citation108
The importance of the hepatic GLS mechanism was clarified by a recent (2017) interesting study in which GLS was selectively knocked out in mouse liver.Citation56 The KO mice had about doubled elevation of arterial NH3 and a third decrease in arterial glutamine. In the postabsorptive state when there is muscle protein breakdown and increased NH3 production, there was a marked decrease in the rate of glutamine production by the liver in the KO mice. It was also shown that the GLS system had relatively high NH3 affinity compared to the urea-cycle system, and in wild-type mice it accounted for about 50% of total NH3 detoxification. It was concluded that in wild-type mice, 70% of the NH3 delivered to the liver was cleared: 35% by the GLS system and 35% by the urea-cycle system. Again, as was discussed in the “Muscle N balance” section, the glutamine produced must eventually be converted to urea for net N removal.
In the same study, GLS KO mice had a 50% decrease in muscle mass and a threefold increase in fat mass.Citation56 Although the mechanisms responsible for this are unknown, one possibility is that arterial glutamine concentration is a signal controlling muscle and fat contributions to postprandial fuel supply. The decreased arterial glutamine (ie, fuel) in the KO mice may be a signal for increasing muscle breakdown and increasing adipose-energy stores.
As illustrated in , the GI tract is the major producer of systemic NH3, with portal vein-NH3 concentration three times the arterial. Normally, the rate that the liver removes NH3 exceeds the rate that NH3 is added to portal blood flow by the gut, such that the hepatic vein-NH3 concentration is only 80% that of arterial blood. As is discussed herein, one of the major causes of hyperammonemia in cirrhotic patients is the shunting of portal blood around the liver, and we try to relate quantitatively the degree of shunting to hyperammonemia. There is some confusion in the literature about how to quantify this portal NH3 metabolism. The standard pharmacokinetic term is “first-pass metabolism”, which is defined as the fraction of an orally absorbed drug that does not reach systemic circulation.Citation109 Since this cannot be applied to an endogenous solute, such as NH3, an alternative definition is necessary. Nomura et alCitation110 define “hepatic extraction” simply in terms of portal vein (CPV) and hepatic vein (CHV) NH3 concentration:
(13) This simple definition is only approximate, because it neglects the hepatic artery-NH3 contribution to CHV. In our analysis of the effect of portal shunting, we use another defi-nition – fraction metabolized (FMet) – which is the fraction of total NH3 reaching the liver that is metabolized:
(14) where QPV, QHA, and QHV are portal vein, hepatic artery, and hepatic vein blood-flow rates, respectively. For the data in , the hepatic extraction (EquationEquation 13
(13) ) is 73%, similar to that found experimentally in a series of patients with idiopathic portal hypertensionCitation110 or during cholecystectomy.Citation111 Using the flow rates and concentrations listed in , the fraction metabolized (EquationEquation 14
(14) ) is 67%, similar to values reported in mice, cows, lambs, and rats.Citation57
Hyperammonemia associated with CLD and acute liver failure
Hyperammonemia is commonly observed in CLD, and the potential for this elevated NH3 to cause HE is the primary reason for the strong interest in the pathophysiology of blood NH3. Plasma NH3 increases with severity of CLD classified by the Child–Pugh score, rising from a normal value of about 30–45 µM (high normal) for Child–Pugh A to 66 µM in Child–Pugh B and 108 µM in Child–Pugh CCitation112 (assignment of Child–Pugh score does not depend on plasma NH3). In the most severe forms of CLD, with marked HE, arterial NH3 can increase to 250 µM or higher.Citation113
Although multiple factors influence the degree of hyperammonemia, it has long been recognized that most important is the shunting of portal blood past the liver. As discussed, the GI tract is the major producer of systemic NH3, with portal vein-NH3 concentration three times arterial concentration. Normally, all the portal blood passes through the liver, which extracts NH3 more quickly than it is produced in the gut, thus maintaining low levels of NH3 in the systemic circulation. A portal to systemic shunt allows NH3 produced in the gut to circumvent the liver and enter the systemic circulation. Since the liver clears about 70% of the NH3, a portal shunt effectively increases the delivery of NH3 to the systemic blood about threefold. The classic experimental model of such shunting is the “Eck fistula”Citation114 described by Eck in 1877,Citation115 in which all the portal blood flow is shunted to the inferior vena cava in the dog. In 1893, Hahn et al carried out detailed and extended studies of Eck fistulae and described that these dogs developed severe HE.Citation1,Citation2 It was not until the 1950s that it was recognized that the GI tract was a major source of NH3 production and that the portacaval shunt allowed this NH3 to bypass the liver.Citation116–Citation118 In monkeys on a normal protein diet, plasma NH3 levels increase fourfold after creating a portacaval shunt, and rapidly fall back to normal levels if the shunt is closed.Citation119
Qualitatively, the increase in blood NH3 is correlated with the severity of the portosystemic shunt.Citation112 However, there are only a small number of quantitative measurements of portosystemic shunt flow in humans, and no measurements that have directly correlated this shunt flow with arterial NH3. Moreno et alCitation120 reported that the portal vein flow rate entering the liver in patients with advanced CLD is on average only about 32% of normal. If the total GI-tract flow remained constant, this would imply that about 68% of the normal GI flow is shunted to the systemic circulation. This is directly supported by the measurements of Groszmann et alCitation121 who found that on average 62% of mesenteric flow and 60% of splenic flow were shunted past the liver in CLD. In severe CLD, the portal flow can be reduced to zero,Citation120 and for a small fraction (8%), reverse flow (hepatofugal) has been observed in portal vein Doppler-flow measurements.Citation122
The following highly simplified model can be employed to make a quantitative estimate of the effect of a portosystemic shunt on arterial NH3. It will be assumed that in patients with portal shunts: 1) The “Fraction Metabolized” (FMet, eq.) of the NH3 that enters the liver is unchanged from the normal value of 67% determined above; 2) the rates of NH3 production by the kidney (MRen= 15 µm/min/70kg) and GI tract (MGI = 66 µm/min/70kg), and utilization by muscle (MMus= –6 µm/min/70kg) are unchanged from the normal values in ; and 3) the total portal vein (QPV) and hepatic artery (QHA) blood flow rates are unchanged from the normal values (). The change in steady-state NH3 arterial concentration as a function of the fraction of portal vein blood that is shunted (fshunt) can then be calculated using the following analysis.
In the steady state, the NH3 metabolized by the liver must balance the total amount made by the kidney, GI tract, and muscle:
(15) and CPV can be related to arterial concentration (CArt) by EquationEquation 4
(4) :
(16) Upon solving EquationEquations 15
(15) and Equation16
(16) , one can determine the steady-state NH3 CArt as a function of fshunt:
(17) Noiret et alCitation123 described a similar, but much more detailed modeling of portosystemic shunting using a somewhat different set of parameters. It should be emphasized that because of the uncertainty in the parameters in and how they vary in patients with CLD, these models are very approximate and useful primarily in a heuristic manner to illustrate the effect of a portosystemic shunt on arterial NH3.
A plot of arterial NH3 (CArt) as a function of fshunt (EquationEquation 17(17) ) is shown in (black line). It can be seen that as fshunt increases from 0 to 1, CArt increases from 30 µM to about 250 µM. This latter value is similar to the CArt levels that are reached in patients with severe CLD.Citation113 For the average advanced CLD shunt value of 65%,Citation120 CArt is 107 µM, similar to what is observed in Child–Pugh class C patients.Citation112 As such, this analysis shows that most of the hyperammonemia observed in CLD can be accounted for simply by portosystemic shunting, without invoking any other pathophysiology, such as poor hepatocellular function.
Figure 6 Arterial NH3 concentration as a function of the fraction of portal blood shunted to systemic veins, bypassing the liver.
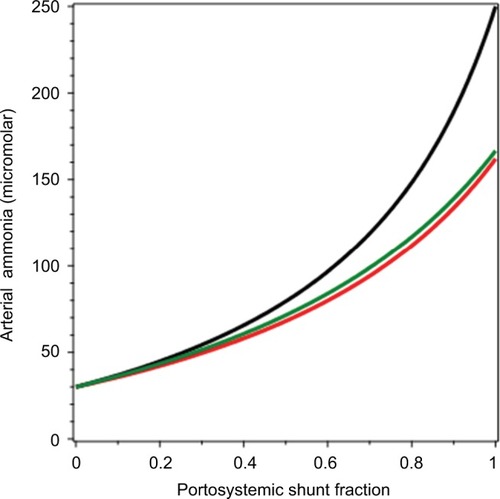
The fundamental assumption in the derivation of EquationEquation 17(17) is that the normal NH3-balance parameters listed in are unchanged in CLD. Actually, there are at least two adjustments in CLD that would be expected to blunt the increase in CArt resulting from portosystemic shunting. The first is an increased rate of muscle-NH3 consumption (MMus) as CArt increases. Bessman and BradleyCitation101 reported that in CLD patients, the increase in MMus was roughly proportional to CArt (there was also a smaller and more variable increase in brain uptakeCitation101 that we neglect). We can modify this derivation by assuming that MMus is directly proportional to CArt:
(18) where M0Mus is the normal value of muscle-NH3 uptake (6 µm/min/70 kg, ) and C0Art is the normal NH3 arterial concentration (30 µM). Substituting EquationEquation 18
(18) into EquationEquation 15
(15) and solving for CArt as a function of fshunt:
(19) The result of this calculation is plotted as the red line in . It can be seen that this increase in muscle-NH3 uptake reduces the increase in CArt, which reaches a maximum of about 162 µM when fshunt = 1.
As discussed in the “Muscle N balance” section, NH3 taken up by muscle is converted to glutamine. To the extent that this new glutamine is actually metabolized, eg, in kidneys or intestines, to glutamate and NH3, the assumption in EquationEquation 19(19) that increased muscle-NH3 uptake results in net NH3 removal from the body is wrong. HolečekCitation30 suggested that this recycling of glutamine to NH3 was a “vicious cycle”, increasing the hyperammonemia in CLD. However, as discussed, the liver’s conversion of glutamine to urea is the major pathway regulating plasma glutamine, suggesting that most of the additional glutamine production resulting from increased NH3 uptake may be directly converted to urea by the liver.
The second factor that can blunt the increase in CArt is a compensatory increase in QHA as QPV is reduced. There is a well-established “hepatic arterial buffer response” that tends to maintain total liver flow constant as QPV is decreased in the normal liver.Citation122,Citation124 However, this response is less pronounced in CLD,Citation125 and measurements in CLD are suggestive of only a small (if any) increase in QHA.Citation126,Citation127 To illustrate the potential effect of a compensatory increase in QHA, it was assumed that QHA increases by 50% as fshunt goes to 1:
(20) where Q0HA is the normal hepatic artery flow (0.45 L/min, ). Substituting EquationEquation 20
(20) into EquationEquation 15
(15) and solving for CArt as a function of fshunt:
(21) This is plotted as the green line in . It can be seen that this increase in QHA produces roughly the same blunting of the increase in CArt as the increase in MMus (red line).
Creation of shunts between the portal system and the hepatic vein or vena cava has been commonly employed to reduce portal pressure in patients with intractable ascites or variceal bleeding. Walser et alCitation128 estimated that 3 months after establishing a transjugular intrahepatic portosystemic shunt (TIPSS), fshunt ranged 0.84–1, with an average value of 0.93. Using EquationEquation 17(17) , one would predict that increasing fshunt from the pre-TIPSS value of 0.65Citation120 to the post-TIPSS value of 0.93, with all other factors remaining unchanged, should increase CArt from 107 to 204 µM. The most serious clinical complication of TIPSS is an increased HE,Citation4 presumably as a result of this increased NH3. However, an increase in CArt does not necessarily follow creation of the shunts. There is no significant increase in CArt 2 weeks following end-to-side portacaval shuntsCitation129 or 1 hour following a TIPSS,Citation102 suggesting that there must be compensating factors. An obvious candidate is the well-established increase in QHA (up to double) that results from decreased portal vein pressure following surgical creation of the shunt.Citation127,Citation130,Citation131 Recently, Damink et alCitation14,Citation48,Citation102,Citation132 carried out the most detailed available measurements of the effect of TIPSS on N and NH3 balance. They established that compensating changes in renal NH3 release to the systemic circulation (MRen) can significantly alter CArt. For example, they found that 1 hour following a TIPSS, MRen decreased by 22 µm/min/70 kg, presumably because of systemic hemodynamic changes produced by the stent.Citation102 Assuming that the overall effect of the stent is to increases fshunt from 0.65 to 0.93, while QHA increases 50% and MRen decreases by 22 µm/min/70 kg, one finds using EquationEquation 17
(17) that pre- and poststent CArt are 107 and 101 µM, respectively. Therefore, the calculated effect of these compensating factors can prevent a TIPSS-induced increase in CArt, as is observed experimentally.
A basic assumption of this discussion is that the FMet (EquationEquation 14(14) ) of the unshunted liver blood flow is normal in CLD, so the primary cause of the increased CArt is portosystemic shunting. An alternative possibility is that liver-NH3 clearance processes and FMet are impaired in CLD. The definition of FMet is problematic, because a fraction of the shunt may be intrahepatic and thus CHV (EquationEquation 14
(14) ) represents both blood that has passed through functioning liver and shunted blood. One can correct for this by using 99mTc- macroaggreated albumin to quantitate the intrahepatic shunting. Nomura et alCitation110 found that liver hepatic extraction (EquationEquation 13
(13) ) decreased as the severity of the CLD increased: from 77% in controls (patients with idiopathic portal hypertension) to 50% in Child–Pugh class A and 40% in Child–Pugh class B or C cirrhosis. However, if these measurements are corrected for intrahepatic shunting, the FMet of the unshunted blood remains relatively normal in these CLD patients. When the severity of CLD approaches the point where liver cells become nonfunctional, obviously significant impairment in FMet would be expected. The classic human model of a severe defect in FMet is ALF.
ALF is the sudden loss of a large fraction of liver function in a subject with no preexisting disease and presumably no portosystemic shunts. Among the liver functions reduced are NH3-uptake processes along with metabolism of AAs (including glutamine and alanine) to urea. In 22 ALF patients, Clemmesen et alCitation103 made detailed measurements of urea, AA, and NH3 balance across the splanchnic bed, ie, the GI tract plus liver determined from arterial–hepatic vein NH3-concentration difference and hepatic blood flow. In addition, they measured arterial-venous differences across a lower extremity. The patients were in an approximate steady state, with arterial NH3 increased to 182 µM (four times their normal of 46 µM) and glutamine increased to 2,393 µM (four times their normal of 568 µM). Most of the other AA concentrations are also increased three- to fourfold, with the major exception of BCAAs, whose concentrations were decreased from their normal values (valine 198–159 µM, leucine 110–85 µM, and isoleucine 57–28 µM). This is direct confirmation of the unique BCAA metabolism: as the normal liver cannot metabolize BCAAs because of the lack of the BCAA transaminase, liver failure should have no effect on their systemic plasma concentration. The decrease in plasma-BCAA concentration may be the result of increased muscle-BCAA conversion to glutamine stimulated by hyperammonemiaCitation30 or more simply associated with general malnourishment in liver failure.
As discussed, normally the main site of NH3 production is the GI tract, with all this NH3 removed by the liver, so that overall there is a small net splanchnic NH3 extraction. In marked contrast, in ALF there is a large net splanchnic production of 109 µm/min/70 kg compared to a splanchnic extraction of 9 µm/min/70 kg in normal controls (Clemmesen et alCitation103 could not determine liver extraction [FMet], because they did not sample the portal vein). This decreased liver-NH3 metabolism is balanced by increased lower-extremity (ie, muscle)-NH3 uptake, which as discussed is roughly proportional to arterial NH3. Some liver function remains because the liver urea-production rate is about 42% of normal, with arterial urea concentration increased threefold. Using this mathematical model with no shunt and assuming that muscle-NH3 uptake is proportional to arterial NH3 (CArt, EquationEquation 19(19) ), FMet would have to be reduced to about 20% of normal in order to increase CArt to 182 µM found in ALF patients. The ALF rate of muscle-NH3 removal is linearly related to the rate of muscle-glutamine production, with about two glutamine molecules produced for each NH3 consumed. The ALF rates of splanchnic alanine and NH3 production are nearly equal, suggesting that the increased splanchnic NH3 production arises primarily from GI-tract metabolism of glutamine to NH3 and alanine (EquationEquation 7
(7) ), rather than from bacterial urea metabolism.
Enzyme deficiencies
As summarized in and , AA turnover produces about 1 M/70 kg/day of NH3, most of which is converted to urea by the urea cycle and does not normally contribute to blood NH3. In patients with genetic defects in the urea cycle, this conversion is slowed, with potential for massive increase in blood NH3. There are eight enzymes required for normal urea-cycle function, and deficiencies in any of these can produce increased blood NH3.Citation133 The severity of the defect depends on the enzyme involved and the degree of its loss of function. Unlike CLD, where defects in hepatic detoxification can produce myriad compounds that can contribute to HE, urea-cycle defects represent pure hyperammonemia. Although there are a variety of associated changes in the plasma concentration of urea-cycle intermediates (eg, ornithine, citrulline, arginine) the clinical symptoms are the result of the hyperammonemia, which is the defining feature.Citation134
In the most severe forms, such as carbamoyl phosphate synthetase 1 (CPS1) deficiency, which affects the first step in the urea cycle, infants develop severe hyperammonemia (1,000 µM or greater) within 3 days of birth, producing catastrophic HE (eg, respiratory distress, convulsions) that is fatal unless treated acutely with mechanical ventilator and/or dialysis and chronically with protein restriction, IV NH3 scavengers (eg, sodium benzoate), and urea-cycle intermediates.Citation135 About half of affected neonates die from HE coma.Citation134 Most of the longer-surviving subjects have moderate-severe long-term neurocognitive disorders.Citation135
When there is only a partial enzyme deficiency, the onset of overt symptoms may be delayed for months or years, with acute episodes of symptomatic hyperammonemia (>100 µM) produced by some triggering event, such as an infection. These episodes are marked by a wide range of symptoms, including loss of appetite, cyclical vomiting, lethargy, hallucinations, and psychosis. Although these children have longer-term survival, they have high morbidity (eg, developmental disabilities, cerebral palsy, seizure disorders).Citation134 On occasion, a seemingly healthy adult with a minor defect may present with hyperammonemia and HE when some triggering event increases NH3 production and/or reduces the borderline urea-cycle function.
Gastrointestinal therapeutic approaches to lowering blood ammonia
The association of increased arterial NH3 with HE has led to therapeutic strategies for lowering NH3.Citation3 Because the portal shunting of GI-produced NH3 is the primary source of NH3, the therapeutic focus is directed at reducing NH3 production in the gut. As discussed, the quantitative estimates of the magnitude of the three GI-tract NH3-producing processes are: bacterial urea hydrolysis = 122 µm/min/70 kg, bacterial protein deamination = 29 µm/min/70 kg, and intestinal mucosal glutamine metabolism = ~20 µm/min/70 kg.
In the past, low-protein diets were widely recommended for hyperammonemia and HE. The N-balance diagram in shows that the relationship between protein intake and blood NH3 is indirect and ambiguous. As has been emphasized, since metabolism of dietary AAs by the liver to urea by the urea cycle does not alter blood NH3, no direct relationship between protein intake and blood NH3 would be expected. However, there is an indirect relation, because as discussed in detail in the “GI-tract N balance” section, 20% of the urea production is metabolized to urea in the GI tract by bacterial urease and 50% or more of portal vein NH3 could be derived from this urea metabolism. Protein restriction should reduce blood urea, which in turn would reduce blood NH3 if it resulted in less GI-tract bacterial production of urea-based NH3 production. As discussed in the “GI-tract N balance” section, because the intestinal urease is nearly saturated at normal blood-urea concentration, the relationship between blood-urea concentration and bacterial urea production is nonlinear. Picou and PhillipsCitation136 found that children on a low-protein diet (30% of normal), had a fivefold decrease in the rate of urea production (and presumably blood urea), and as predicted a proportionally smaller twofold decrease in the absolute rate of bacterial urea hydrolysis. Young et alCitation137 compared rates of urea production and hydrolysis in adults on a normal-protein diet (11.6 g N/day) vs a high-protein diet (2.4 times normal) and low-protein diet (quarter of normal). On the low-protein diet, urea production was 52% of normal and urea hydrolysis 59% of normal. The high-protein diet increased the rate of urea production by a factor of 2.45 (identical to the 2.4-fold increase in protein intake). However, as predicted, there was no significant increase in the absolute rate of urea hydrolysis (relative to the normal-protein diet), since presumably bacterial urease was saturated at the urea levels achieved with the normal-protein diet. These results suggest that since urea hydrolysis represents the largest component of GI-tract NH3 production, if severe enough, protein restriction should significantly reduce serum NH3 in CLD patients.
Surprisingly, there have been no well-controlled studies on the effect of a low-protein diet on blood NH3 in CLD.Citation138,Citation139 In 2004, Cordoba et alCitation138 described the first randomized study of the effect of a low-protein diet plus neomycin (delivered by nasogastric tube) in patients with an episodic HE. The protein restriction had no significant effect on either the outcome of the HE or blood-NH3 levels. Because of this result, coupled with the observation that low-protein diets have a deleterious effect on nutritional status in CLD patients, protein restriction is no longer recommended.Citation3,Citation140 The apparent explanation for the failure of Cordoba et al to observe a decrease in blood NH3 in their CLD patients may be attributable to the fact that both the control and low-protein arms of the study were receiving neomycin therapy, which would be expected to decrease bacterial urea metabolism.
Historically, the association between ingested protein and HE was supported by the original observation of Eck in 1877Citation115 that dogs with a portacaval shunt developed HE when they were fed meat. Similarly, the administration of bovine erythrocytes has been used as an experimental model to induce HE in rats with portacaval anastomosis.Citation141 In humans, this association of HE with dietary protein is supported by the common observation that HE is precipitated by GI bleeding in patients with hepatic cirrhosisCitation132,Citation142 (in nonanemic subjects, blood contains about 20 g/dL protein). This effect of gastric bleeding was confirmed experimentally by Bessman and MirickCitation142 in 1958, who showed that blood NH3 roughly doubled 4 hours after intragastric administration of blood to patients with CLD, but had no effect in normal controls. This interesting result was recently studied in much more detail by Damink et al.Citation132 They directly measured the NH3 balance across the GI tract, liver, leg (ie, muscle), and kidney in patients with cirrhosis and a TIPSS when administered an intragastric AA solution that simulated blood. The simulated blood increased arterial NH3 by a factor of 1.62 after 4 hours. Surprisingly, this increase seemingly resulted from an increase in renal NH3 production, with no significant change in either GI-tract or liver-NH3 balance. Although the mechanism of the increased renal NH3 production is not clear, these results indicate that a single oral protein dose does not increase GI-tract NH3 production.
As discussed in the “Muscle N balance” section, muscle-glutamine production and NH3 consumption (EquationEquation 8(8) ) result from the conversion of muscle BCAAs to glutamine. In addition, it has been suggested that increased blood NH3 in CLD leads to increased BCAA breakdown, contributing to the cachexia associated with CLD.Citation28 This has led to the idea that increased dietary BCAAs may be an effective way to lower blood NH3 and treat the cachexia of CLD.Citation28,Citation31 Unfortunately, clinical trials of BCAA diet supplements have shown conflicting results, with some studies actually finding an increase in blood NH3.Citation31
With the recognition in the 1950s of the large contribution of GI-tract bacterial urea metabolism to NH3 production, focus was directed at reducing or eliminating this bacterial population. Antibiotic therapy became a standard in the treatment of HE after the report of Fisher and FalconCitation117 in 1957 that venous blood NH3 in CLD patients fell by half or more after 3 days of neomycin therapy. Because such antibiotics as neomycin, metronidazole, and vancomycin have some associated side effects, poorly absorbed rifaximin has now become the standard antibiotic therapy for HE.Citation3 A number of controlled randomized trials have shown that a few days of rifaximin therapy results in statistically significant reductions in blood NH3, with posttreatment NH3 33%–67% of pretreatment NH3.Citation143–Citation146
In 1966, Bircher et alCitation147 showed that reductions in blood NH3 could be obtained by chronic administration of the unabsorbable disaccharide lactulose. In a meta-analysis of four randomized comparisons of unabsorbable lactulose versus rifaximin, Wu et alCitation148 concluded that although the disaccharide lowered blood NH3, the reduction was significantly less than that observed with rifaximin in three of the four studies. The exception was the study of Paik et al,Citation145 which found that lactulose and rifaximin had a nearly identical effect on blood NH3, with NH3 being lowered from 192 µM to 128 µM by lactulose and from 204 µM to 138 µM by rifaximin. Because of their relative safety, unabsorbable disaccharides are regarded as the standard, first-line therapy for HE.Citation3
Despite the relatively enormous use of lactulose as therapy for HE, the mechanistic basis of its NH3-lowering action is uncertain.Citation149 Virtually all ingested lactulose reaches the colon, where it is fermented by colonic flora to short-chain organic acids with the production of acidic colonic contents, as well as diarrhea. Lactulose is more effective at reducing serum NH3 than other cathartics, ie, polyethylene glycol; therefore, it has been assumed that the ability of lactulose to acidify the colon is responsible for its beneficial effect. Initially, it was postulated that this acidification increased the NH4+:NH3 ratio, with a resultant luminal “trapping” of NH3 via diminished nonionic diffusion. This excess NH3 would then be fecally excreted, possibly facilitated by the cathartic effect of lactulose. However, the quantity of NH3 excreted in feces has been shown to be minimal in both the basal and postlactulose situation,Citation150,Citation151 ruling out the possibility that trapping of NH3 accounts for the decline in serum NH3 observed with lactulose.
In vitro research has shown that colonic content acidity levels resulting from lactulose fermentation reduce the rate of fecal bacterial deamination of urea and protein.Citation152 However, if the quantitative estimates of NH3 production discussed in the “GI-tract N balance” section are correct, protein deamination accounts for only about 16% of total GI-tract NH3 production, and thus one would not expect this action of lactulose to have a large effect on plasma NH3. Also as discussed in the “GI-tract N balance” section, the limitation in the rate that urea can diffuse to the large intestinal lumen suggests that any NH3-lowering action of lactulose due to decreased bacterial urea breakdown may be an extracolonic action.
Lactulose has dramatic small-intestine effects. In patients with terminal ileostomies, adding 40 g lactulose to a meal reduces intestine-transit time by about 40% and increases total ileal effluent fivefold.Citation153,Citation154 This produces a doubling in the amount of malabsorbed carbohydrate and a 55% increase in the malabsorbed protein. In normal subjects, high doses of lactulose (160 g/day) produce massive protein fecal losses of about 0.5 M/day, about 50% of the total protein intake,Citation155 presumably resulting from small-intestine protein malabsorption.
This lactulose-induced protein malabsorption is equivalent to a low-protein diet which as discussed earlier should decrease plasma urea and correspondingly the rate of NH3 production from bacterial urea hydrolysis. In addition, the increased small- and large-intestine volume flows and decreased transit time should limit the time for bacterial urea hydrolysis and protein deamination. Both of these effects should decrease the rate of urea metabolism. This was directly confirmed by Weber, who looked at the effect of lactulose (40–80 g/day) on urea metabolism in six CLD subjects.Citation156 As predicted, if lactulose decreased protein absorption, lactulose increased stool-nitrogen output by a factor of 2.3 and decreased plasma urea by 17% and net urea production by 25%. Most importantly, it decreased bacterial urea metabolism by 38%, which could account for much of the decrease in plasma NH3 associated with lactulose. Note that if colonic protein deamination was appreciable, the increased small-intestine protein malabsorption should have a deleterious effect, increasing colonic GI-NH3 production. Since this is not observed, either protein deamination is not an important source of NH3 (in the presence or absence of lactulose) or the increased colonic transit time produced by lactulose limits the time for deamination.
These studies show that reducing bacterial urea metabolism by antibiotics or unabsorbable disaccharides reduces blood NH3 (CArt) by about 50%. One can use this quantitative model to predict the magnitude of inhibition of GI-NH3 production (MGI) that would be required to produce this 50% fall in CArt. The only change required is to make the substitution:
(22) where fGI is the fractional inhibition of GI-NH3 production and MGI0 the uninhibited rate (66 µm/min/70 kg). shows a plot of CArt as a function of fGI for fshunt = 1 (black line) and fshunt = 0.6 (red line). It can be seen that in order to produce a 50% reduction in CArt, it is necessary to reduce MGI by about 60%. Antibiotics could account for such a reduction if these agents almost totally eliminated the bacterial metabolism of urea.
Figure 7 Arterial NH3 concentration as a function of the fractional inhibition of GI-tract NH3 production (eg, by oral antibiotics).
Abbreviation: GI, gastrointestinal.
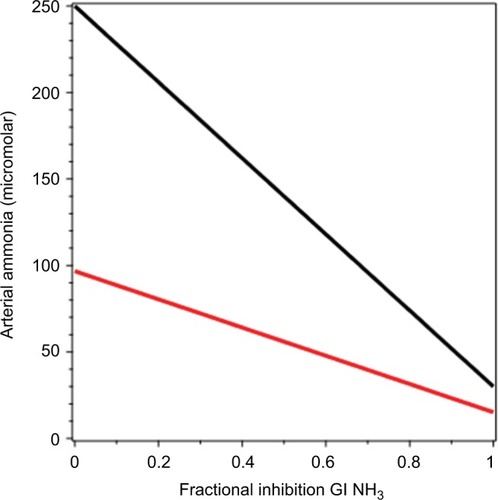
Clinical implications
Discussion of the vast array of clinical conditions causing hyperammonemia and the use of NH3 measurements in the diagnosis and approach to therapy of these conditions is beyond the scope or goal of this paper. The following discussion provides a brief summary of selected aspects of the use of NH3 determinations in clinical practice.
The laboratory assessment of blood-NH3 concentration is complicated by the large number of blood proteins (plasma and red blood cell-derived) that may “spontaneously” deaminate, resulting in artifactual elevations of true blood-NH3 concentration. For this reason, there was uncertainty that the blood of healthy subjects actually contained NH3 until the 1960s, when analytical techniques requiring minimal blood manipulation became available. The most important factor in minimizing spurious elevations of blood NH3 is maintenance of samples at ice-water temperature from collection to analysis, which should take place within 1 hour of sample collection. Care should also be taken when obtaining the venous blood sample, with minimal exercise of the arm and a short period of venous stasis. In addition, it has recently been shown that in patients with severe liver injury, deproteinization is required for accurate measurements using the glutamate dehydrogenase assay.Citation157 Despite apparent attention to these details, one laboratory found that of 86 pediatric patients with initially high blood NH3 levels, subsequent values in about 50% normalized without treatment, suggesting that 50% of the initially elevated values were false positives.Citation158 It follows that the finding of elevated blood NH3 requires confirmation with a repeat assay.
The clinical importance of hyperammonemia is its deleterious effect on the central nervous system with the induction of what is called HE. The most common manifestations of this problem are behavioral changes, confusion, somnolence to coma, and motor disturbances.Citation159 Since such symptoms are commonly observed in the absence of hyperammonemia, the obvious purpose of measuring blood NH3 is to determine if NH3 is playing a pathogenic role in the encephalopathic patient. Subjects with hyperammonemia tend to segregate into two groups: those with known liver dysfunction, either cirrhosis with portal collaterals, or acute hepatic necrosis, and patients with unexplained central nervous system dysfunction but normal liver function. Given the high prevalence of cirrhosis, the vast majority of NH3 measurements at our hospital are obtained from patients with known CLD, usually with extensive collateral circulation. It is commonly accepted that the encephalopathy manifested by these patients is a response to a wide variety of factors in addition to blood NH3, including hypokalemia, hyponatremia, infection, GI hemorrhage, altered neurotransmitter function, and drugs (that do not alter NH3 homeostasis). While the degree of encephalopathy based on clinical assessment roughly correlates with the degree of hyperammonemia, the correlation coefficient (about 0.6) is poor.Citation113 Particularly problematic are patients who apparently demonstrate encephalopathy (usually mild) with a normal NH3 level. While it is not clear to what extent the discrepancy between blood-NH3 level and encephalopathy is a function of inaccurate clinical assessment of mental status, the present mantra is that the serum-NH3 measurement adds little of value to simple bedside scoring systems for the severity of encephalopathy.
In contrast to the limited value of blood-NH3 determinations in patients with CLD, this measurement is crucial to establishing hyperammonemia as the cause of encephalopathy in patients with normal liver-function tests. The vast majority of such patients have disorders of the urea cycle with severe defects manifesting in infancy, whereas minor defects may not become clinically apparent until some aggravating event occurs in adulthood, such as infection or a surgical procedure. A variety of drugs, including chemotherapeutic agentsCitation160 and valproic acid,Citation161 have been observed to cause symptomatic elevations of blood NH3, apparently via interference with the urea cycle. Other conditions associated with hyperammonemia include urinary-tract infections with NH3-producing organismsCitation162 and bacterial overgrowth,Citation163 both presumably related to excessive production of NH3. Since hyperammonemia can result in irreversible brain injury or death if not treated, it is important to identify this problem as soon as possible in the course of the disease. It follows that serum-NH3 determination should be obtained early in the workup of any patient with unexplained encephalopathy.
Author contributions
Both authors contributed toward data analysis, drafting and revising the paper and agree to be accountable for all aspects of the work.
Disclosure
The authors report no conflicts of interest in this work.
References
- HahnMMassenONenckiMPawlowJDie Eck’sche Fistel zwischen der unteren Hohlvene und der Pfortader und ihre Folgen für den OrganismusArch Exp Pathol Pharmakol1893323–4161210
- ShawcrossDLDaminkSWButterworthRFJalanRAmmonia and hepatic encephalopathy: the more things change, the more they remain the sameMetab Brain Dis200520316917916167195
- RoseCFAmmonia-lowering strategies for the treatment of hepatic encephalopathyClin Pharmacol Ther201292332133122871998
- LiereVSandhuGDeMorrowSRecent advances in hepatic encephalopathyF1000Res20176163729026534
- McDermottWVJrVictorMPointWWExclusion of the colon in the treatment of hepatic encephalopathyN Engl J Med196226717850854
- McDermottWVJrTreatment of ammonia intoxication by exclusion of the colonGastroenterology19665157217235332923
- GluudLLDamGBorreMLactulose, rifaximin or branched chain amino acids for hepatic encephalopathy: what is the evidence?Metab Brain Dis201328222122523275147
- BatesRGPinchingGDAcidic dissociation constant of ammonium ion at 0° to 50°C, and the base strength of ammoniaJ Res Natl Bur Stand (1977)194942419430
- MartinelleKHäggströmLOn the dissociation constant of ammonium: effects of using an incorrect pKa in calculations of the ammonia concentration in animal cell culturesBiotechnol Tech19971112549551
- WeinerIDHammLLMolecular mechanisms of renal ammonia transportAnnu Rev Physiol20076931734017002591
- WeinerIDVerlanderJWMolecular physiology of the Rh ammonia transport proteinsCurr Opin Nephrol Hypertens201019547147720539225
- WeinerIDNew insights into the molecular regulation of urine concentrationAm J Physiol Renal Physiol20163111F184F18527029426
- BergenWGWuGIntestinal nitrogen recycling and utilization in health and diseaseJ Nutr2009139582182519282369
- DaminkSWDeutzNEDejongCHSoetersPBJalanRInterorgan ammonia metabolism in liver failureNeurochem Int2002412–317718812020618
- WalkerVAmmonia metabolism and hyperammonemic disordersAdv Clin Chem2014677315025735860
- DarmaunDMatthewsDEBierDMGlutamine and glutamate kinetics in humansAm J Physiol19862511 Pt 1E117E1262873746
- McGaleEHPyeIFStonierCHutchinsonECAberGMStudies of the inter-relationship between cerebrospinal fluid and plasma amino acid concentrations in normal individualsJ Neurochem1977292291297886334
- CooperAJFreedBRMetabolism of [13N]ammonia in rat lungNeurochem Int2005471–210311815923062
- WrightGNoiretLDaminkSWJalanRInterorgan ammonia metabolism in liver failure: the basis of current and future therapiesLiver Int201131216317520673233
- HagenfeldtLErikssonSWahrenJInfluence of leucine on arterial concentrations and regional exchange of amino acids in healthy subjectsClin Sci (Lond)19805931731817428288
- TizianelloADe FerrariGGaribottoGGurreriGEffects of chronic renal insufficiency and metabolic acidosis on glutamine metabolism in manClin Sci Mol Med1978554391397710053
- CooperAJPlumFBiochemistry and physiology of brain ammoniaPhysiol Rev19876724405192882529
- MeyerJSGotohFAkiyamaMToshitakeSMonitoring cerebral blood flow and oxygen, glucose, lactate and ammonia metabolismCirc Res19672156496604965304
- RosenspireKCSchwaigerMMangnerTJHutchinsGDSutorikAKuhlDEMetabolic fate of [13N]ammonia in human and canine bloodJ Nucl Med19903121631672313355
- ColeJTMetabolism of BCAAsRajendramRRajkumarPPatelVBranched Chain Amino Acids in Clinical Nutrition2HeidelbergSpringer20151324
- Guevara-CruzMVargas-MoralesJMMendez-GarciaALAmino acid profiles of young adults differ by sex, body mass index and insulin resistanceNutr Metab Cardiovasc Dis201828439340129422298
- van de PollMCLigthart-MelisGCDaminkSWThe gut does not contribute to systemic ammonia release in humans without portosystemic shuntingAm J Physiol Gastrointest Liver Physiol20082954G760G76518703642
- HolečekMThree targets of branched-chain amino acid supplementation in the treatment of liver diseaseNutrition201026548249020071143
- HolečekMBranched-chain amino acids and ammonia metabolism in liver disease: therapeutic implicationsNutrition201329101186119123756281
- HolečekMEvidence of a vicious cycle in glutamine synthesis and breakdown in pathogenesis of hepatic encephalopathy: therapeutic perspectivesMetab Brain Dis201429191723996300
- HolečekMBranched-chain amino acid supplementation in treatment of liver cirrhosis: updated views on how to attenuate their harmful effects on cataplerosis and ammonia formationNutrition201741808528760433
- HolečekMRelation between glutamine, branched-chain amino acids, and protein metabolismNutrition200218213013311844643
- FulgoniVL3rdCurrent protein intake in America: analysis of the National Health and Nutrition Examination Survey, 2003–2004Am J Clin Nutr20088751554S1557S18469286
- MariottiFToméDMirandPPConverting nitrogen into protein: beyond 6.25 and Jones’ factorsCrit Rev Food Sci Nutr200848217718418274971
- GersovitzMMotilKMunroHNScrimshawNSYoungVRHuman protein requirements: assessment of the adequacy of the current recommended dietary allowance for dietary protein in elderly men and womenAm J Clin Nutr19823516147064878
- MatthewsDECampbellRGThe effect of dietary protein intake on glutamine and glutamate nitrogen metabolism in humansAm J Clin Nutr19925559639701570805
- RudmanDDiFulcoTJGalambosJTSmithRB3rdSalamAAWarrenWDMaximal rates of excretion and synthesis of urea in normal and cirrhotic subjectsJ Clin Invest1973529224122494727456
- JacksonAAPicouDLandmanJThe non-invasive measurement of urea kinetics in normal man by a constant infusion of 15N15N-ureaHum Nutr Clin Nutr19843853393546511482
- WalserMBodenlosLJUrea metabolism in manJ Clin Invest19593891617162613842664
- WrongOMVinceAUrea and ammonia metabolism in the human large intestineProc Nutr Soc198443177866709639
- LevensonSMCrowleyLVHorowitzREMalmOJThe metabolism of carbon-labeled urea in the germ free ratJ Biol Chem195923482061206213673014
- NanceFCKaufmanHJKlineDGRole of urea in the hyperammonemia of germ-free Eck fistula dogsGastroenterology19746611081124809488
- LevittDGPKQuest Java: free, interactive physiologically based pharmacokinetic software package and tutorialBMC Res Notes2009215819656378
- GerichJEMeyerCStumvollMWHormonal control of renal and systemic glutamine metabolismJ Nutr20001304S Suppl995S1001S10736369
- HeYHakvoortTBKöhlerSEGlutamine synthetase in muscle is required for glutamine production during fasting and extrahepatic ammonia detoxificationJ Biol Chem2010285139516952420064933
- MittendorferBVolpiEWolfeRRWhole body and skeletal muscle glutamine metabolism in healthy subjectsAm J Physiol Endocrinol Metab20012802E323E33311158937
- NurjhanNBucciAPerrielloGGlutamine: a major gluconeogenic precursor and vehicle for interorgan carbon transport in manJ Clin Invest19959512722777814625
- DaminkSWJalanRRedheadDNHayesPCDeutzNESoetersPBInterorgan ammonia and amino acid metabolism in metabolically stable patients with cirrhosis and a TIPSSHepatology20023651163117112395326
- AledoJCGomez-FabrePMOlallaLMarquezJIdentification of two human glutaminase loci and tissue-specific expression of the two related genesMamm Genome200011121107111011130979
- LowensteinJMAmmonia production in muscle and other tissues: the purine nucleotide cyclePhysiol Rev19725223824144260884
- HaussingerDNitrogen metabolism in liver: structural and functional organization and physiological relevanceBiochem J199026722812902185740
- VelaCIPadillaFJDetermination of ammonia concentrations in cirrhosis patients: still confusing after all these years?Ann Hepatol201110Suppl 2S60S6522228884
- WalkerMCHillRCGuilfordWGScottKCJonesGLBuergeltCDPostprandial venous ammonia concentrations in the diagnosis of hepatobiliary disease in dogsJ Vet Intern Med200115546346611596733
- WindmuellerHGSpaethAEUptake and metabolism of plasma glutamine by the small intestineJ Biol Chem197424916507050794605420
- GebhardtREbertABauerGHeterogeneous expression of glutamine synthetase mRNA in rat liver parenchyma revealed by in situ hybridization and Northern blot analysis of RNA from periportal and perivenous hepatocytesFEBS Lett19882411–289932904380
- HakvoortTBHeYKulikWPivotal role of glutamine synthetase in ammonia detoxificationHepatology201765128129327641632
- KeidingSMunkOLRoelsgaardKBenderDBassLPositron emission tomography of hepatic first-pass metabolism of ammonia in pigEur J Nucl Med200128121770177511734914
- DeutzNEReijvenPLAthanasasGSoetersPBPost-operative changes in hepatic, intestinal, splenic and muscle fluxes of amino acids and ammonia in pigsClin Sci (Lond)19928356076141335399
- WolpertEPhillipsSFSummerskillWHAmmonia production in the human colon: effects of cleansing, neomycin and acetohydroxamic acidN Engl J Med197028341591645424005
- NevahMIFallonMBHepatic encephalopathy, hepatorenal syndrome, hepatopulmonary syndrome and systemic complications of liver diseaseFeldmanMFriedmanLSBrandtLJSleisenger and Fordtran’s Gastrointestinal and Liver Diseases: Pathophysiology/Diagnosis/Management10th edPhiladelphia, PASaunders201615771590
- MagasanikBThe regulation of nitrogen utilization in enteric bacteriaJ Cell Biochem199351134408094391
- Miner-WilliamsWDeglaireABenamouzigRFullerMFTomeDMoughanPJEndogenous proteins in terminal ileal digesta of adult subjects fed a casein-based dietAm J Clin Nutr201296350851522836032
- GibsonJASladenGEDawsonAMProtein absorption and ammonia production: the effects of dietary protein and removal of the colonBr J Nutr197635161651244844
- CersosimoEWilliamsPERadosevichPMHoxworthBTLacyWWAbumradNNRole of glutamine in adaptations in nitrogen metabolism during fastingAm J Physiol19862506 Pt 1E622E6283521309
- SoubaWWKlimbergVSPlumleyDAThe role of glutamine in maintaining a healthy gut and supporting the metabolic response to injury and infectionJ Surg Res19904843833912187115
- WolpertEPhillipsSFSummerskillWHTransport of urea and ammonia production in the human colonLancet197127739138713904107584
- BillichCOLevitanREffects of sodium concentration and osmolality on water and electrolyte absorption form the intact human colonJ Clin Invest1969487133613475794255
- FordtranJSRectorFCJrEwtonMFSoterNKinneyJPermeability characteristics of the human small intestineJ Clin Invest19654412193519445851951
- LoehryCAAxonATHiltonPJHiderRCCreamerBPermeability of the small intestine to substances of different molecular weightGut19701164664705430371
- EweKSummerskillWHTransfer of ammonia in the human jejunumJ Lab Clin Med19656583984714281378
- GibsonJAParkNJSladenGEDawsonAMThe role of the colon in urea metabolism in manClin Sci Mol Med197650151591248203
- WilsonDRIngTSMetcalfe-GibsonAWrongOMThe chemical composition of faeces in uraemia, as revealed by in-vivo faecal dialysisClin Sci19683521972095721228
- HillMJDrasarBSThe normal colonic bacterial floraGut19751643183231093952
- WalserMUrea metabolism in chronic renal failureJ Clin Invest1974535138513924825230
- DaviesSSpanelPSmithDQuantitative analysis of ammonia on the breath of patients in end-stage renal failureKidney Int19975212232289211367
- WrongOMVinceAJWaterlowJCThe contribution of endogenous urea to faecal ammonia in man, determined by 15N labelling of plasma ureaClin Sci (Lond)19856821931993967466
- MobleyHLCortesiaMJRosenthalLEJonesBDCharacterization of urease from Campylobacter pyloriJ Clin Microbiol19882658318363384908
- EvansWBAoyagiTSummerskillWHGastrointestinal urease in man – II: urea hydrolysis and ammonia absorption in upper and lower gut lumen and the effect of neomycinGut1966766356395957515
- ChenSJWangLJZhuQCaiJTChenTSiJMEffect of H. pylori infection and its eradication on hyperammonemia and hepatic encephalopathy in cirrhotic patientsWorld J Gastroenterol200814121914191818350632
- ChakrabartiPZulloAHassanCHelicobacter pylori, gastric juice, and arterial ammonia levels in patients with cirrhosisJ Clin Gastroenterol200234557858111960074
- ZulloAHassanCMoriniSHepatic encephalopathy and Helicobacter pylori: a critical reappraisalJ Clin Gastroenterol200337216416812869889
- JiangHXQinSYMinZGAssociation of Helicobacter pylori with elevated blood ammonia levels in cirrhotic patients: a meta-analysisYonsei Med J201354483283823709415
- NeithercutWDGreigMAHossackMMcCollKESuicidal destruction of Helicobacter pylori: metabolic consequence of intracellular accumulation of ammoniaJ Clin Pathol19914453803842045495
- AoyagiTEngstromGWEvansWBSummerskillWHGastrointestinal urease in man – I: activity of mucosal ureaseGut1966766316355957514
- SuzukiKBennoYMitsuokaTTakebeSKobashiKHaseJUrease-producing species of intestinal anaerobes and their activitiesAppl Environ Microbiol197937337938236839
- ButtNIButtUIKakarAMalikTSiddiquiAMIs lactulose plus rifaximin better than lactulose alone in the management of hepatic encephalopathy?J Coll Physicians Surg Pak201828211511729394969
- ShawcrossDLDiagnosis and management of hepatic encephalopathyBr J Nurs201827Suppl 3S7S1329411990
- van BerloCLvan LeeuwenPASoetersPBPorcine intestinal ammonia liberation: influence of food intake, lactulose and neomycin treatmentJ Hepatol1988722502573192927
- van der HulstRRvon MeyenfeldtMFDeutzNESoetersPBGlutamine extraction by the gut is reduced in depleted [corrected] patients with gastrointestinal cancerAnn Surg199722511121218998127
- DelaneyJPCusterJGastrointestinal blood flow in the dogCirc Res19651753944025320848
- FrassettoLAToddKMMorrisRCJrSebastianAEstimation of net endogenous noncarbonic acid production in humans from diet potassium and protein contentsAm J Clin Nutr19986835765839734733
- KoeppenBMThe kidney and acid-base regulationAdv Physiol Educ200933427528119948674
- WeinerIDMitchWESandsJMUrea and ammonia metabolism and the control of renal nitrogen excretionClin J Am Soc Nephrol20151081444145825078422
- StumvollMPerrielloGMeyerCGerichJRole of glutamine in human carbohydrate metabolism in kidney and other tissuesKidney Int199955377879210027916
- PittsRFStoneWJRenal metabolism of alanineJ Clin Invest19674645305386021204
- OwenEERobinsonRRAmino acid extraction and ammonia metabolism by the human kidney during the prolonged administration of ammonium chlorideJ Clin Invest196342226327613940831
- FeligPAmino acid metabolism in manAnnu Rev Biochem1975449339551094924
- KatzABrobergSSahlinKWahrenJMuscle ammonia and amino acid metabolism during dynamic exercise in manClin Physiol1986643653793742956
- DeuelTFLouieMLernerAGlutamine synthetase from rat liver: purification, properties, and preparation of specific antiseraJ Biol Chem1978253176111611828323
- ChangTWGoldbergALThe metabolic fates of amino acids and the formation of glutamine in skeletal muscleJ Biol Chem19782531036853693649596
- BessmanSPBradleyJEUptake of ammonia by muscle; its implications in ammoniagenic comaN Engl J Med1955253261143114713272854
- DaminkSWDejongCHDeutzNEKidney plays a major role in ammonia homeostasis after portasystemic shunting in patients with cirrhosisAm J Physiol Gastrointest Liver Physiol20062912G189G19416455791
- ClemmesenJOKondrupJOttPSplanchnic and leg exchange of amino acids and ammonia in acute liver failureGastroenterology200011861131113910833488
- RomanEGarcia-GalceranCTorradesTEffects of an exercise programme on functional capacity, body composition and risk of falls in patients with cirrhosis: a randomized clinical trialPLoS One2016113e015165227011355
- HolečekMKandarRSisperaLKovarikMAcute hyperammonemia activates branched-chain amino acid catabolism and decreases their extracellular concentrations: different sensitivity of red and white muscleAmino Acids201140257558420614225
- GrahamTETurcotteLPKiensBRichterEATraining and muscle ammonia and amino acid metabolism in humans during prolonged exerciseJ Appl Physiol (1985)19957827257357759446
- CourtFGLawsPEMorrisonCPSubtotal hepatectomy: a porcine model for the study of liver regenerationJ Surg Res2004116118118614732366
- BenhamoucheSDecaensTGodardCApc tumor suppressor gene is the “zonation-keeper” of mouse liverDev Cell200610675977016740478
- PondSMTozerTNFirst-pass elimination: basic concepts and clinical consequencesClin Pharmacokinet198491125
- NomuraFOhnishiKTerabayashiHEffect of intrahepatic portal-systemic shunting on hepatic ammonia extraction in patients with cirrhosisHepatology1994206147814817982647
- McDermottWVAdamsRDRiddellAGAmmonia metabolism in manAnn Surg1954140453955613198089
- TarantinoGCitroVEspositoPBlood ammonia levels in liver cirrhosis: a clue for the presence of portosystemic collateral veinsBMC Gastroenterol200992119292923
- OngJPAggarwalAKriegerDCorrelation between ammonia levels and the severity of hepatic encephalopathyAm J Med2003114318819312637132
- StarzlTEPorterKAFrancavillaAThe Eck fistula in animals and humansCurr Probl Surg198320116877526357642
- EckNVK voprosu o perevyazkie vorotnois veni: predvaritelnoye soobschjenyeVoen Med Zh187713012
- DavidsonCSHepatic comaAdv Intern Med19557336313248745
- FisherCJFaloonWWBlood ammonia levels in hepatic cirrhosis: their control by the oral administration of neomycinN Engl J Med1957256221030103513451988
- SilenWMawdsleyDLWeirichWLHarperHAStudies of hepatic function in dogs with Eck fistula or portacaval transpositionAMA Arch Surg195774696497013423997
- KlineDGCrookJNNanceFCEck fistula encephalopathy: long-term studies in primatesAnn Surg19711731971035543554
- MorenoAHBurchellARRousselotLMPankeWFSlafskyFBurkeJHPortal blood flow in cirrhosis of the liverJ Clin Invest19674634364456023778
- GroszmannRKotelanskiBCohnJNKhatriIMQuantitation of portasystemic shunting from the splenic and mesenteric beds in alcoholic liver diseaseAm J Med19725367157224564239
- GülbergVHaagKRössleMGerbesALHepatic arterial buffer response in patients with advanced cirrhosisHepatology200235363063411870377
- NoiretLBaigentSJalanRArterial ammonia levels in cirrhosis are determined by systemic and hepatic hemodynamics, and by organ function: a quantitative modelling studyLiver Int2014346e45e5524134128
- EipelCAbshagenKVollmarBRegulation of hepatic blood flow: the hepatic arterial buffer response revisitedWorld J Gastroenterol201016486046605721182219
- IwaoTToyonagaAShigemoriHHepatic artery hemodynamic responsiveness to altered portal blood flow in normal and cirrhotic liversRadiology199620037937988756933
- SchenkWGJrMcDonaldJCMcDonaldKDrapanasTDirect measurement of hepatic blood flow in surgical patients: with related observations on hepatic flow dynamics in experimental animalsAnn Surg196215646347114498225
- BurchellARMorenoAHPankeWFNealonTFJrHepatic artery flow improvement after portacaval shunt: a single hemodynamic clinical correlateAnn Surg19761843289302962397
- WalserEMHarrisVMHarmanJTParkHMSiddiquiARQuantification of intrahepatic portosystemic shunting after placement of a transjugular intrahepatic portosystemic shuntJ Vasc Interv Radiol1996722632679007808
- ChalmersTCHughesCWIberFLNitrogen metabolism after portacaval shunts in patients with cirrhosis – I: effects of the operation upon the blood ammonia concentrationAMA Arch Intern Med1958101243443813497346
- RichterGMBradoMSimonCChanges in liver perfusion caused by transjugular intrahepatic stent shunt (TIPSS)Zentralbl Chir19971222108116 German9173754
- WeidekammCCejnaMKramerLPeck-RadosavljevicMBaderTREffects of TIPS on liver perfusion measured by dynamic CTAJR Am J Roentgenol2005184250551015671371
- DaminkSWJalanRDeutzNEThe kidney plays a major role in the hyperammonemia seen after simulated or actual GI bleeding in patients with cirrhosisHepatology20033761277128512774005
- MewNASimpsonKLGropmanALLanpherBCChapmanKASum-marMLUrea cycle disorders overview1993 Available from: https://www.ncbi.nlm.nih.gov/pubmed/20301396Accessed April 3, 2018
- SummarMTuchmanMProceedings of a consensus conference for the management of patients with urea cycle disordersJ Pediatr20011381 SupplS6S1011148544
- AliEZKhalidMKYunusZMCarbamoylphosphate synthetase 1 (CPS1) deficiency: clinical, biochemical, and molecular characterization in Malaysian patientsEur J Pediatr2016175333934626440671
- PicouDPhillipsMUrea metabolism in malnourished and recovered children receiving a high or low protein dietAm J Clin Nutr19722511126112665086048
- YoungVREl-KhouryAERagusoCAForslundAHHambraeusLRates of urea production and hydrolysis and leucine oxidation change linearly over widely varying protein intakes in healthy adultsJ Nutr2000130476176610736327
- CordobaJLopez-HellinJPlanasMNormal protein diet for episodic hepatic encephalopathy: results of a randomized studyJ Hepatol2004411384315246205
- PlauthMMerliMKondrupJManagement of hepatic encephalopathyN Engl J Med19973372619211922
- CabralCMBurnsDLLow-protein diets for hepatic encephalopathy debunked: let them eat steakNutr Clin Pract201126215515921447768
- OriaMRomero-GimenezJArranzJARiudorERaguerNCordobaJOrnithine phenylacetate prevents disturbances of motor-evoked potentials induced by intestinal blood in rats with portacaval anastomosisJ Hepatol201256110911421835138
- BessmanANMirickGSBlood ammonia levels following the ingestion of casein and whole bloodJ Clin Invest195837799099813563627
- MasARodesJSunyerLComparison of rifaximin and lactitol in the treatment of acute hepatic encephalopathy: results of a randomized, double-blind, double-dummy, controlled clinical trialJ Hepatol2003381515812480560
- MiglioFValpianiDRosselliniSRFerrieriARifaximin, a non-absorbable rifamycin, for the treatment of hepatic encephalopathy: a double-blind, randomised trialCurr Med Res Opin199713105936019327194
- PaikYHLeeKSHanKHComparison of rifaximin and lactulose for the treatment of hepatic encephalopathy: a prospective randomized studyYonsei Med J200546339940715988813
- PedrettiGCalzettiCMissaleGFiaccadoriFRifaximin versus neomycin on hyperammoniemia in chronic portal systemic encephalopathy of cirrhotics: a double-blind, randomized trialItal J Gastroenterol19912341751781751811
- BircherJMüllerJGuggenheimPHaemmerliUPTreatment of chronic portal-systemic encephalopathy with lactuloseLancet1966174438908924159616
- WuDWuSMLuJZhouYQXuLGuoCYRifaximin versus non-absorbable disaccharides for the treatment of hepatic encephalopathy: a meta-analysisGastroenterol Res Pract2013201323696323653636
- ClausenMRMortensenPBLactulose, disaccharides and colonic flora: clinical consequencesDrugs19975369309429179525
- AgostiniLDownPFMurisonJWrongOMFaecal ammonia and pH during lactulose administration in man: comparison with other catharticsGut197213118598664646289
- ZeegenRDrinkwaterJEFentonJCVinceADawsonAMSome observations on the effects of treatment with lactulose on patients with chronic hepatic encephalopathyQ J Med1970391542452635449591
- VinceAKillingleyMWrongOMEffect of lactulose on ammonia production in a fecal incubation systemGastroenterology197874354454924570
- ReadNWCammackJEdwardsCHolgateAMCannPABrownCIs the transit time of a meal through the small intestine related to the rate at which it leaves the stomach?Gut198223108248287117901
- HolgateAMReadNWRelationship between small bowel transit time and absorption of a solid meal. Influence of metoclopramide, magnesium sulfate, and lactuloseDig Dis Sci19832898128196884167
- MortensenPBThe effect of oral-administered lactulose on colonic nitrogen metabolism and excretionHepatology1992166135013561446891
- WeberFLJrThe effect of lactulose on urea metabolism and nitrogen excretion in cirrhotic patientsGastroenterology1979773518523456846
- VodenicarovovaMSkalskaHHolečekMDeproteinization is necessary for the accurate determination of ammonia levels by glutamate dehydrogenase assay in blood plasma from subjects with liver injuryLab Med201748433934529126300
- MarandaBCousineauJAllardPLambertMFalse positives in plasma ammonia measurement and their clinical impact in a pediatric populationClin Biochem200740853153517408610
- ButterworthRFPathogenesis of hepatic encephalopathy: new insights from neuroimaging and molecular studiesJ Hepatol200339227828512873828
- NottLPriceTJPittmanKPattersonKFletcherJHyperammonemia encephalopathy: an important cause of neurological deterioration following chemotherapyLeuk Lymphoma20074891702171117786705
- Segura-BrunaNRodriguez-CampelloAPuenteVRoquerJValproate-induced hyperammonemic encephalopathyActa Neurol Scand200611411716774619
- AlbersenMJoniauSvan PoppelHCuylePJKnockaertDCMeerssemanWUrea-splitting urinary tract infection contributing to hyperammonemic encephalopathyNat Clin Pract Urol20074845545817673917
- GuptaADhimanRKKumariSRole of small intestinal bacterial overgrowth and delayed gastrointestinal transit time in cirrhotic patients with minimal hepatic encephalopathyJ Hepatol201053584985520675008
- TizianelloADe FerrariGGaribottoGGurreriGEffects of chronic renal insufficiency and metabolic acidosis on glutamine metabolism in manClin Sci Mol Med1978554391397710053