Abstract
Increased maspin expression in the colon is related to colon cancer risk and patient survival. Maspin is induced by the hydrophobic bile acid, deoxycholate (DOC), which is an endogenous carcinogen and inducer of oxidative stress and DNA damage in the colon. Persistent exposure of colon epithelial cells, in vitro, to high physiologic levels of DOC results in increased constitutive levels of maspin protein expression associated with the development of apoptosis resistance. When an apoptosis-resistant colon epithelial cell line (HCT-116RC) developed in the authors’ laboratory was treated with a maspin-specific siRNA probe, there was a statistically significant increase in apoptosis compared to treatment with an siRNA control probe. These results indicate, for the first time, that maspin is an anti-apoptotic protein in the colon. Immunohistochemical evaluation of maspin expression in human colonic epithelial cells during sporadic colon carcinogenesis (131 human tissues evaluated) indicated a statistically significant increase in maspin protein expression beginning at the polyp stage of carcinogenesis. There was no statistically significant difference in maspin expression between hyperplastic/adenomatous polyps and colonic adenocarcinomas. The absence of “field defects” in the non-neoplastic colonic mucosa of patients with colonic neoplasia indicates that maspin may drive the growth of tumors, in part, through its anti-apoptotic function.
Introduction
Colon carcinogenesis is associated with a high-fat dietCitation1 and such a diet results in increased concentrations of endogenous bile acids in the gut.Citation2–Citation4 Although numerous bile acids are released from the gallbladder into the small intestine, only the hydrophobic bile acids are particularly damaging to cells.Citation1 The hydrophobic bile acids, deoxycholic acid, and lithocholic acid, resulting from bacterial metabolism, are the predominant bile acids found in the human colon. Thus, in previous work, the authors explored the effects of exposure of cells of colonic origin to high pathophysiologic concentrations of deoxycholate (DOC). It was shown that repeatedly exposing HCT-116 colon epithelial cells to increasing concentrations of DOC over months resulted in the development of cells with apoptosis resistance,Citation5 a hallmark of cancer.Citation6,Citation7 Apoptosis resistance during colon carcinogenesis is a major process associated with the survival of cells with genomic instability.Citation8–Citation11 2D-gel electrophoresis/matrix-assisted laser desorption/ionization (MALDI)-mass spectroscopy of these apoptosis-resistant cells indicated, unexpectedly, that maspin was one of the proteins that was substantially upregulated.Citation5
Maspin is a 42 kDa protein with high sequence homology to members of the serpin peptidase inhibitor family of proteins.Citation12,Citation13 Early experimental results with maspin in mammary tissue indicated that it acts as a tumor suppressor.Citation14,Citation15 However, maspin does not undergo the S (stressed) to R (relaxed) conformational transition that characterizes active serpins.Citation16,Citation17 Thus, the mechanisms by which it exerts its tumor suppressor activity have been actively sought. One of the mechanisms proposed to explain the tumor-suppressive functions of maspin in noncolon-derived cells is that it sensitizes cells to apoptosis,Citation18–Citation25 thereby preventing the clonal expansion of preneoplastic cells with DNA damage. In contrast to mammary tissue, maspin expression in colon epithelial tissue appears to be related to increased colon cancer risk and reduced patient survival.Citation26–Citation31 High maspin expression is associated with neoplastic transformation and high tumor grade.
It was determined, using small interfering RNA (siRNA) technology, that maspin is an anti-apoptotic protein in colon epithelial cells, which can explain the association of increased maspin expression with increased risk of colon carcinogenesis. Human colonic tissues were screened, using immunohistochemical analysis, to determine if maspin was differentially expressed during colon carcinogenesis. Maspin’s first increased expression occurred at the hyperplastic/ adenomatous polyp stage of colon tumorigenesis. No evidence of “field defects” with respect to maspin expression was observed in the non-neoplastic mucosa of patients with polyps or adenocarcinomas. The role of maspin as a “double-edged sword” during colon carcinogenesis is discussed in the light of these new findings.
Materials and methods
SiRNA methodology
Potential siRNA probes were identified by Dr Seth Ririe, Senior Technical Service Scientist (QIAGEN, Inc, Valencia, CA) by scanning the mRNA nucleotide sequence for human maspin (GenBank Accession #NM_002639) using QIAGEN Software. Three siRNA probes were selected to have the highest potential for success based on siRNA design (QIAGEN, Inc). A BLAST (Basic Local Alignment Search Tool [designed by scientists at the NIH]) search was performed on these three oligonucleotide sequences, and the 19-mer sequence that was very specific with homology only to maspin mRNA (3′-dTdTGUCACACUUGCUGGUCUGG-5′) was chosen for the siRNA experiments. This sequence started at nucleotide #528 of the human maspin mRNA sequence (GenBank Accession #NM_002639). An siRNA control probe was provided by QIAGEN that does not target any known human gene. HCT-116RC colon epithelial cells were selected for the siRNA experiments, as it was one of the three resistant cell lines that was developed in the authors’ laboratory after persistent exposure of HCT-116 parental cells to increasing concentrations of the hydrophobic bile acid, DOC, for a period of ~40 weeks.Citation5 This cell line became stably resistant to apoptosis induced by 0.5 mM DOC and maintained a high level of maspin expression (sodium DOC was obtained from Sigma Aldrich [St Louis, MO]). The stability of this cell line as to apoptosis resistance and high maspin expression was ensured in the present siRNA experiments by including 0.5 mM DOC as a negative control. The HCT-116RC cells were plated in 24-well Falcon polystyrene tissue culture dishes (Fisher Scientific, Pittsburgh, PA) at a concentration of 1 × 10⁵ cells/mL, and treated with either 0.8 μg maspin-specific siRNA probe, 0.8 μg siRNA control probe, 0.5 mM DOC, or control media for 24 hours. (SiRNA treatments for 48 hours decreased cell viability, as determined using trypan blue exclusion.) All wells contained the TransMessenger Transfection Reagent (TTR) from QIAGEN. The ratio of siRNA to TTR was 1:5 (μg:μL). A total of ten experiments were used to analyze for the induction of apoptosis by the siRNA probes.
Assessment of apoptosis in SiRNA experiments
Cytospins were prepared of all experimental groups: (1) untreated control or treated with (2) DOC, (3) siRNA, or (4) control siRNA, and stained with Giemsa stain. A total of ten siRNA experiments were included to assess statistical significance. One hundred cells were counted from each prepared slide and the percentage of apoptosis assessed using standard morphologic criteria.Citation8,Citation32
Briefly, apoptotic cells can be identified by bright-field microscopy using the following criteria in various stages of the apoptotic process: condensation of the chromatin (deep purple to black stain intensity), fragmentation of the nucleus into round discrete chromatin masses, increase in cytoplasmic blebbing, and the formation of apoptotic bodies.
Western blot analyses
Western blot procedures were performed as previously described.Citation33,Citation34 Cells were grown in 20 × 50 mm Falcon polystyrene tissue culture dishes. Cultures treated with DOC or siRNA probes or cells incubated in control media were disrupted in lysis buffer (50 mM Tris pH 8, 5 mM EDTA, 150 mM NaCl, 0.5% NP-40) supplemented with 1 mM phenylmethylsulfonyl fluoride (PMSF), leupeptin (1 μg/mL), and aprotinin (0.01 U/mL). Cell lysates were prepared at a concentration of 2 μg/μL of protein and a total of 20 μg of protein was added to each well of a 15% Criterion Tris-HCl gel (Bio-Rad, Hercules, CA) for size fractionation by electrophoresis. The proteins were blotted onto Immobilon-P polyvinylidene fluoride (PVDF) transfer membranes (Millipore, Bedford, MA). The membranes were incubated with mouse antihuman maspin antibody (catalog #554292; BD Biosciences Pharmingen, San Jose, CA) at a dilution of 1:1000. The membranes were then incubated with goat antimouse secondary antibodies conjugated to horseradish peroxidase (Thermo Scientific, Rockford, IL). Antibody complexes were detected using the SuperSignal West Pico chemiluminescence detection system (Thermo Scientific). Finally, the membranes were stained for 20 minutes with Brilliant Blue G dye (Sigma-Aldrich, St Louis, MO) to confirm equal protein loading, as previously described.Citation33,Citation34 Brilliant Blue G dye was chosen to stain the membranes rather than a specific protein as a loading control since Brilliant Blue staining evaluates numerous bands found in the entire gelCitation33,Citation34 whereas the evaluation of a specific protein can be misleading. This approach is based on work published from the authors’ laboratory using GAPDH and G3PD,Citation35 and the results of Qi and SitCitation36 who screened 22 housekeeping genes and found a large number to be modulated by various experimental conditions. In addition, the cytoskeletal protein, β-actin, has been reported not to be a reliable loading control in Western blot analysis.Citation37 Even F-actin has been reported to be experimentally modulated as evidenced by the decomposition of F-actin in apoptosis experiments.Citation38
The Western blot experiments were repeated at least three times; in the repeats, separate cultures were treated and cell lysates were separately prepared. The band intensities after siRNA and DOC treatments were then compared with control cells (no siRNA, no DOC) using automated densitometry (Image-Pro software package, v 5.1.1.38; Media Cybernetics, Silver Spring, MD), and the values normalized to control values. Two replicates from each lysate were also run to ensure technical reproducibility.
Procurement of human colon tissues
A total of 131 tissue samples was procured for this study with informed consent according to procedures approved by the institutional review boards at the University of Arizona (supervises human subject studies at University Medical Center [UMC] and the Southern Arizona Veterans Affairs Health Care System [SAVAHCS]) and the Tucson Medical Center (TMC). All tissue samples (n = 106) from colon resections (16 patients [two normal, two diverticulitis, seven with sporadic adenocarcinomas, four with large adenomas, one with ulcerative colitis/adenocarcinoma]) were obtained in the operating room at UMC. In the resected colon segment, samples of the non-neoplastic mucosa were taken adjacent to the tumor on the proximal and distal sides (P0, D0), 2 cm away on the proximal and distal side (P2, D2) and near the surgical margins (PMAX, DMAX). These tissue samples were fixed immediately in formalin by CMP and HH, as previously described.Citation39–Citation41 All colonoscopy tissue samples (n = 10) from five patients without colonic disease were obtained at UMC and at SAVAHCS under the direct supervision of CB and fixed immediately in formalin, as previously described.Citation42 Tissue samples from archived biopsies of polyps/adenomas (n = 8, including two hyperplastic polyps, six adenomatous polyps), and colon cancers (n = 7) were obtained from TMC and selected for the present study by GW.
Immunohistochemical procedures
Four micron sections of each paraffin block were prepared, immersed in xylene and rehydrated through a series of ethanols. Antigen retrieval was achieved using Vector AR (Vector Laboratories, Burlingame, CA) in a microwave and endogenous peroxidase blocked with 30% H2O2 (Sigma-Aldrich). Background Sniper from a Mach 3 (Biocare Medical, Concord, CA) kit was applied followed by mouse antihuman maspin antibody (catalog #554292; BD Biosciences Pharmingen), the secondary antibody (polyclonal rabbit antimouse biotinylated antibody [catalog #E0413; DAKO, Glostrup, Denmark]), and then by Vector PK6100 (Vectastain ABC kit; Vector Laboratories, Burlingame, CA) and 3,3′-diaminobenzidine (Sigma-Aldrich). Slides were counterstained with freshly filtered hematoxylin, dehydrated through a graded series of ethanols, immersed in xylene, and mounted using Cytoseal Mounting Medium (VWR, Tempe, AZ), as previously described.Citation42,Citation43
Scoring of immunohistochemical results
The intensity of the maspin stain (light to dark brown color) and extent of the tissue expressing the maspin stain were taken into consideration using the immunohistochemical procedures described above. Slides were scored for maspin expression using a scale of 0 to +4.0. Since maspin expression was shown to be high in ulcerative colitis (UC),Citation28 a case of UC from the authors’ archived colon tissue bank was used as a positive control for this study. The associated adenocarcinoma from this UC case was strongly positive and received a score of +4. A more complete description of this positive control (with images) is described in Results. Slides that received no primary antibody served as the immunocontrol in each experimental run, and consistently had a score of zero (no brown stain). No tissues in the study that received the maspin antibody had a score of zero. Tissues with a blush of maspin staining were given a score of 0.5. The rest of the tissues were given a score of 1, 2, 3 or 4, relative to the strongly positive UC control tissues (ranged from 2 to 4). Epithelial cells near lymphoid follicles often expressed increased maspin. This immunostaining pattern was observed in both control samples and in the non-neoplastic mucosa of patients with colonic tumors; such immunostaining was not evaluated in the scoring of the tissues.
Statistical analyses
Individual densitometric scan values from experimental groups in Western blots, apoptosis percentages from siRNA experiments, and maspin immunostaining scores from human tissue groups were entered into spreadsheets using Microsoft Office Excel 2007 (Microsoft, Redmond, WA) software. The following parameters were assessed for each experimental group: average, standard deviation, and standard error of the mean. Differences in mean values between experimental groups were considered statistically significant at the 95% confidence level using Student’s t-test. Actual P values are reported in the study.
Photography
Digital images were obtained with 4× and 20× Nikon objectives using a Nikon Eclipse E400 (Nikon, Tokyo, Japan) bright-field microscope equipped with a Moticam 2300 (Motic®, Xiamen, China) 3.0 megapixel camera using Motic Images Plus (v 2.0; Motic) digital imaging software.
Results
Maspin proven to be an anti-apoptotic protein in colon epithelial cells in vitro based on siRNA strategies
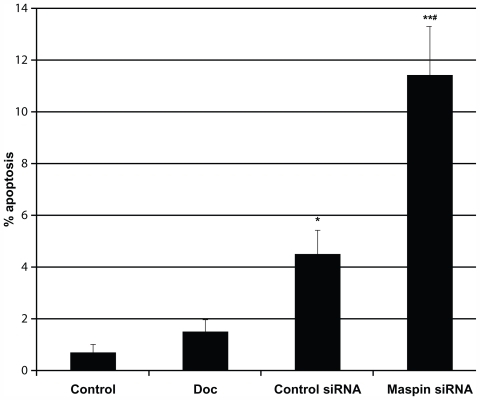
To determine if the reduction in maspin induced apoptosis, the apoptosis-resistant HCT-116RC cells were exposed to a maspin-specific antisense 19-mer oligonucleotide probe (3′-dTdTGUCACACUUGCUGGUCUGG-5′), and to a control siRNA probe for 24 hours and compared with control cells (no siRNA, no DOC) and cells treated with 0.5 mM DOC. (The control cells received only the TransMessenger Transfection Reagent (TTR) without any siRNA probe or DOC; the DOC-treated cells in TTR media served as a control for the stability of the resistant state of the cells.) Treatment of cells with the maspin-specific siRNA probe resulted in a statistically significant increase in apoptosis when compared with: (1) control cells (P = 3.29 × 10⁻⁵), (2) cells treated with DOC (P = 9.58 × 10⁻⁵), and (3) cells treated with a control siRNA probe (P = 4.57 × 10⁻³) (). The control siRNA probe showed a statistically significant increase in apoptosis when compared with control cells (P = 9.05 × 10⁻³) and DOC-treated cells (P = 9.14 × 10⁻³). DOC treatment did not show an increase in apoptosis compared with control cells (P = 0.173).
Figure 1 HCT-116RC cells treated with either control media, 0.5 mM DOC (deoxycholate), control siRNA, or maspin-specific siRNA for 24 hours and the percentage of apoptosis ± SEM determined for each experimental group. The single asterisk indicates statistically significant differences compared to untreated cells in control media. Treatment of cells with 0.5 mM DOC served as a control to ensure that the cells had maintained their apoptosis resistance to the same apoptosis-inducing agent that was used to develop the resistant cells over ~40 weeks of persistent exposure. There was no significant increase in the % apoptosis after treatment of cells with 0.5 mM DOC.
Abbreviations: siRNA, small interfering RNA; SEM, standard error of the mean; DOC, deoxycholate.
To ensure that the maspin siRNA knocked down the protein expression level of the 42 kDa maspin protein, the same treatment of cells as above was performed, and Western blots from each treatment group were probed with a monoclonal antibody for maspin (). A densitometric analysis () indicated that treatment of cells with the maspin-specific siRNA resulted in a significant (P = 7.8 × 10⁻³) reduction in maspin protein expression compared with untreated control cells. There was no significant reduction in maspin expression using the control siRNA (P = 0.272) or the DOC treatment (P = 0.437).
Figure 2 (A) Western blots of maspin expression from HCT-116RC cells treated with 0.5 mM DOC, siRNA control probe, or siRNA maspin probe for 24 hours. (B) Relative protein expression levels were obtained using densitometry. DOC treatment was used as an internal control to ensure that the resistant cells still maintained the same high level of maspin expression and could not be further induced by DOC. Routine staining of the entire gel with Brilliant blue indicated that all lanes received the same amount of protein.
Abbreviations: siRNA, small interfering RNA; SEM, standard error of the mean; DOC, deoxycholate.
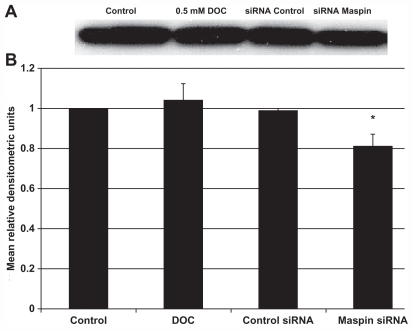
In conclusion, the use of a specific maspin siRNA probe resulted in an approximately 20% reduction in maspin protein levels, which had a significant effect on the induction of apoptosis. These findings indicate that maspin was responsible, in part, for the observed resistance of the HCT-116 cells.
Immunohistochemical evaluation of a case of UC as a positive control for maspin expression
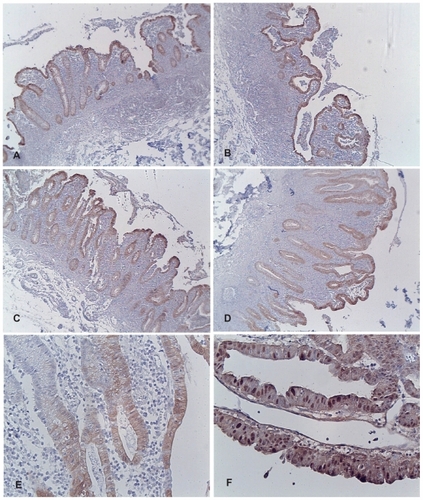
Since maspin expression is reported to be high in the non-neoplastic mucosa and associated adenocarcinomas from patients with inflammatory bowel disease,Citation28 a case of UC from the authors’ tissue archives was included as a positive control for the present immunohistochemical studies on sporadic colon cancers. Tissue from the cancer and 13 regions of the non-neoplastic colonic mucosa (PMAX, P3, P2, P0, D0, D2, D3, D4, D5, D6, D7, D8, D9) was immunostained for maspin and the intensity of expression scored on a scale of 0 to +4.0. Representative bright-field microscopic images displaying maspin expression are shown in . The adenocarcinoma displayed the highest expression of maspin (score of +4) (see , Panel F), with abundant nuclear maspin staining in addition to cytoplasmic staining. Twelve of the non-neoplastic tissue samples received a score of +3 and one received a score of +2. All 130 tissue samples from patients with polyps/sporadic colon cancer and from patients with no evidence of colonic neoplasia in the present study were compared with this positive control.
Figure 3 Composite of images of colonic tissue from a patient with ulcerative colitis and adenocarcinoma stained for maspin expression. (A) Non-neoplastic mucosa taken adjacent to the cancer on the proximal side. (B) Non-neoplastic mucosa taken adjacent to the cancer on the distal side. (C) Non-neoplastic mucosa taken 3 cm away from the cancer on the proximal side. (D) Non-neoplastic mucosa taken 9 cm away from the cancer on the distal side. (E) Higher magnification of representative non-neoplastic mucosa taken 3 cm away from the cancer on the distal side; note the predominately cytoplasmic staining of maspin. (F) Note the increased overall expression of maspin in the adenocarcinoma; prominent nuclear staining of maspin is evident.
Immunohistochemical evaluation of maspin expression in human tissues during colon cancer progression
Progression to colon cancer proceeds by means of numerous changes in the colonic mucosa, progressing from normal tissue to “field defects” in the non-neoplastic flat mucosa, to hyperplastic polyps, to adenomatous polyps (adenomas), and, ultimately, to colon cancer. A total of 131 representative tissues from the authors’ colon tissue banks was screened and the intensity and pattern of maspin expression at each of these stages was compared.
The colonic mucosa from patients with no evidence of colonic neoplasia exhibits a low expression of maspin
Multiple tissue samples of colonic mucosa were obtained from patients without colonic neoplasia. These tissue samples were from resected colon segments obtained during surgery and from biopsies obtained during colonoscopy. Two patients had a recurrent sarcoma removed that was external to the colon wall. To prevent further possible recurrences of the sarcoma, the surrounding tissues, including a segment of colon, were removed. Neither patient received radiation or chemotherapy prior. Two patients had diverticulitis that required the removal of the involved colon segment. Five patients with no evidence of colonic lesions had two biopsies of the colonic mucosa taken during routine colonoscopy. An immunohistochemical evaluation of maspin expression indicated low expression of maspin (score of 0.5 or 1) in these 35 tissue samples (). There was some variability in the pattern of maspin expression (), but all colonic tissues showed some focal or diffuse maspin expression in the cytoplasm of the epithelial cells. The low overall expression in the colonic crypts is shown in . The low overall staining predominantly at the top of the crypts is shown in . Focal distinct staining in individual cells of the crypts is shown in . There was no statistical difference (P = 0.91) () in maspin expression between the colonoscopy specimens () and the non-neoplastic tissue samples from the colon resections of patients with no colonic neoplasia ().
Figure 4 Variability in maspin expression in non-neoplastic colonic mucosa obtained from normal subjects and patients with colonic tumors (4× objective). (A) Normal mucosa obtained from a healthy patient during routine colonoscopy. This image shows a low overall expression of maspin; (B) normal mucosa obtained from a healthy patient during routine colonoscopy. This image shows focal staining in individual cells (arrows); (C) normal mucosa obtained from a colon resection from a patient who had a sarcoma surgically removed. The sarcoma was external to the body wall and the patient had received no prior radiation or chemotherapy. This image shows low overall staining predominantly at the top of the crypts (arrows); (D) region of colon 2 cm proximal to a large tubulovillous adenoma. This image shows a low overall expression of maspin; (E) region of colon 2 cm proximal to a large tubulovillous adenoma. This image shows a low overall expression of maspin; (F) region of colon near the distal margin of a colon resection from a patient with a colon cancer. This image shows low overall staining predominantly at the top of the crypts (arrows).
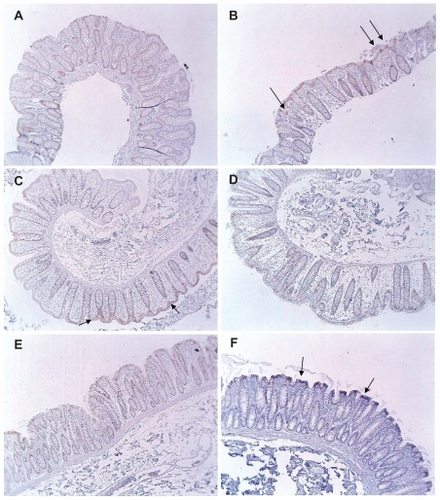
Table 1 Maspin expression in the colonic mucosa of patients with no colonic polyps, cancer or inflammatory bowel disease
Colon resections from patients with colonic tumors and evaluation of “field defects”
Tissue samples (n = 106) from non-neoplastic colonic mucosa, adenomas, and adenocarcinomas present in the resected colon segments obtained at surgery were immunostained for maspin, and a relative score of 0, 0.5 (minimal staining), 1, 2, 3, or 4 was assigned to each of these tissues (). Non-neoplastic tissues in resected colon segments that harbored a tumor (in ten patients) were scored to identify possible “field defects” associated with maspin expression. Samples of the non-neoplastic mucosa were taken adjacent to the tumor on the proximal and distal sides (P0, D0), 2 cm away on the proximal and distal side (P2, D2) and near the surgical margins (PMAX, DMAX). The adenomas/adenocarcinomas displayed a maspin score that was ~3 times (2.17/0.66) greater than the maspin score in tissue samples taken from non-neoplastic colonic mucosa present in the same colon resection (). The overall mean maspin expression in the adenomas/adenocarcinomas was significantly increased compared with the mean maspin expression in the non-neoplastic colonic mucosa in the same resected tissues (P = 0.00002) (), and significantly increased over that of control colonic mucosa from patients with no colonic neoplasia (P = 0.00004) (). There was no significant difference between the non-neoplastic colonic mucosa of patients with a colonic neoplasia () and the colonic mucosa of patients with no colonic neoplasia ().
Figure 5 Histogram displaying the average maspin score ± SEM in the non-neoplastic mucosa at different distances from the colonic neoplasms of 10 patients with a large adenoma (A) or cancer (CA). Samples of the non-neoplastic mucosa were taken adjacent to the tumor on the proximal and distal sides (P0, D0), 2 cm away on the proximal and distal side (P2, D2) and near the surgical margins (PMAX, DMAX).
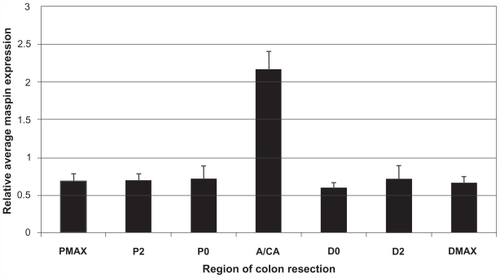
Table 2 Maspin expression in non-neoplastic colonic mucosa and tumors in colonic resections of patients with sporadic adenomas and adenocarcinomas
Table 3 Mean maspin expression in non-neoplastic colonic mucosa of colon resections from patients with and without colonic neoplasia: comparison to mean maspin expression of adenomas and adenocarcinomas
It is interesting that the non-neoplastic mucosa of the UC patient, shown in , exhibited a high expression of maspin (2.92 ± 0.28), which was significantly greater (P = 7.52 × 10⁻¹⁶) than the mean (0.66 ± 0.20) of the non-neoplastic mucosa of patients with sporadic adenomas/ adenocarcinomas (). This comparison of images of non-neoplastic mucosa from inflammatory bowel disease () and sporadic colon cancer () underscores the different etiologies of these two diseases. This will be briefly discussed in the discussion section.
High expression of maspin begins at the polyp/ adenoma stage of sporadic colon carcinogenesis
Since high maspin expression was not observed as “field defects” in the 61 samples of non-neoplastic colonic mucosa obtained from colon resections of patients with large sporadic adenomas or adenocarcinomas, maspin expression was evaluated in a number of early colonic growths, which included hyperplastic and adenomatous polyps, to determine if high maspin expression was characteristic of the polyp stage of colon cancer progression (). Statistically increased maspin expression occurred at the polyp stage () compared with the non-neoplastic mucosa of control patients () (P = 9.10 × 10⁻¹³) and the non-neoplastic mucosa adjacent to hyperplastic polyps and adenomatous polyps (P = 8.37 × 10⁻⁷) (). There was no statistical difference in maspin expression of polyps compared with that of adenocarcinomas (P = 0.43) (). Images of maspin expression in non-neoplastic mucosa from control subjects and from patients with colonic tumors are shown in . The non-neoplastic colonic mucosa immediately adjacent to polyps was also evaluated for maspin expression () and it was determined that there was no significant difference in maspin expression compared with the non-neoplastic colonic mucosa of control subjects () (P = 0.18) and that of the non-neoplastic colonic mucosa at some distance from colonic tumors () (P = 0.44). Images of polyps and adjacent non-neoplastic mucosa are shown in . Therefore, it appears that increased expression of maspin is associated with the formation of a tumor at the earliest macroscopic stage of tumor growth visible on routine colonoscopy.
Figure 6 Increased maspin expression in polyps (brown color) compared with minimal expression in adjacent non-neoplastic colonic mucosa (see arrows). (A) Adenomatous polyp; (B) adenomatous polyp; (C) hyperplastic polyp; (D) adenomatous polyp (4× objective).
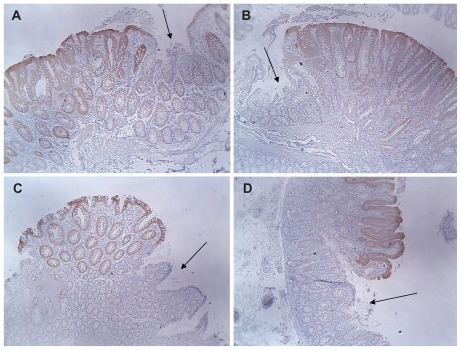
Table 4 Comparison of maspin expression in hyperplastic polyps, adenomatous polyps, adenocarcinomas and non-neoplastic mucosa
Discussion
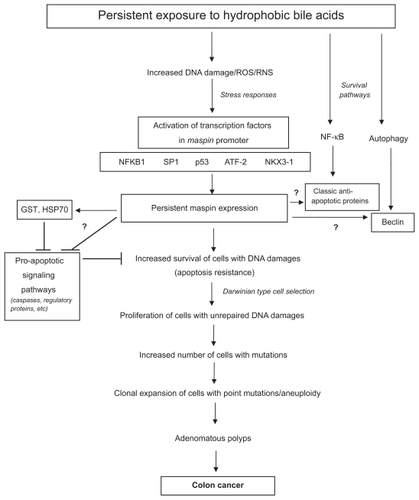
Previous work from the authors’ laboratory indicated that persistent exposure of apoptosis-sensitive colon epithelial cells to DOC, a hydrophobic bile acid, for ~40 weeks led to the selection of cells that were stably resistant to DOC.Citation5 These resistant cells were characterized at the molecular and cellular levels to understand some of the pathways and key proteins that may have been modulated to account for their resistance to apoptosis.Citation5,Citation33,Citation34,Citation44–Citation46 In one study, two-dimensional gel electrophoresis and mass spectroscopy of the HCT-116RC cell line, revealed a dramatic increase in maspin protein expression.Citation5 The DOC-induced maspin expression may have been the result of DOC-induced DNA damage and/or oxidative stress, since the maspin promoter contains binding sites for major transcription factors that respond to DNA damage and/or oxidative stress, such as NF-kappaB,Citation47,Citation48 SP1,Citation49,Citation50 p53,Citation51–Citation53 ATF-2,Citation54 and NKX3-1Citation55 ().
Figure 7 Molecular signaling pathways that may be activated after persistent exposure of cells to hydrophobic bile acids. Since hydrophobic bile acids can perturb cellular membranes, surface molecules can be activated that generate reactive oxygen and nitrogen species. This can cause oxidative DNA damage and the activation of genes associated with the stress response and the activation of transcription factors that turn on genes associated with cell survival. These survival genes include maspin, classic anti-apoptotic genes that are NF-κB-activated, and autophagy-related genes, such as beclin. In order for cells with DNA damages to proliferate, they must evade cell death pathways. Maspin may inhibit these pro-apoptotic pathways through interaction with proteins (eg, GST, HSP70) known to interact with maspin and to inhibit apoptosis. Future studies, designated by question marks, indicate possible interactions with apoptosis regulatory proteins, caspases (executioners of apoptosis) and proteins associated with the pro-survival NF-κB and autophagic pathways. Some of these potential maspin-target protein interactions may result in activation or inhibition of the target proteins.
Maspin is a multifunctional protein whose expression in different anatomic locations may affect different aspects of carcinogenesis.Citation56 Although maspin acts as a tumor suppressor in the breast and has a pro-apoptotic role in that tissue, the authors have shown for the first time that maspin acts as an anti-apoptotic protein in colon epithelial cells. This may explain its role as a stress-response protein in the colon (), since cells need to evade cell death so that oxidative DNA damages can be adequately repaired.Citation10 In fact, knockout of both maspin genes is embryonically lethal,Citation57 indicating its importance to cell survival or function. However, extended upregulation of anti-apoptotic proteins can have deleterious consequences. Apoptosis-resistant cells that harbor unrepaired DNA damages and enter the pool of proliferating cells may propagate mutations, some of which may lead to cancerCitation58,Citation59 ().
The mechanisms by which maspin inhibits apoptosis in the colon are not known.
The maspin protein has 8 cysteinesCitation60 and exists in several molecular configurations that are dependent upon degree of oxidative stress and the extent of intramolecular disulfide bridge formation.Citation61 In addition to the generation of oxidative stress, reactive oxygen species can have physiological effects on cells because of their ability to positively or negatively affect protein function,Citation62 thereby affecting different signaling pathwaysCitation63,Citation64 (). Since maspin can interact with at least 20 different molecules,Citation56 the effect of oxidative stress on maspin and the downstream maspin–protein interactions can ultimately affect cell survival and carcinogenesis. Since caspases have cysteines as a critical amino acid affecting their pro-apoptotic function,Citation65 it is possible that maspin may physically interact with and inhibit caspases through disulfide bridge formation (). Studies in different cell types indicate that maspin can interact with specific proteins that may reduce cellular stresses and cell death, such as glutathione S-transferase (GST)Citation66 and heat shock protein 70 (HSP70) ().Citation66 GST is a major antioxidant defense protein that protects epithelial cells in aberrant crypt foci from DOC-induced apoptosis,Citation67 and the activity of GST is increased by its interaction with maspin.Citation66 HSP70 serves to protect against cell death since it sequesters apoptosis-inducing factor (AIF) in the cytoplasm,Citation68–Citation73 thereby preventing the translocation of AIF to the nucleus and binding to DNA.Citation74,Citation75 When translocation of AIF to the nucleus occurs, it induces DNA condensation and the recruitment of endogenous endoand exonucleases, resulting in DNA fragmentation.Citation76,Citation77 The signaling pathways that lead to apoptosis are most complex, and maspin may interfere, through physical interactions, with the action or activity of apoptosis regulatory proteins (). The survival of cells depends not only on inhibiting pro-cell death pathways, but the activation of prosurvival pathways. Since the authors previously reported that the NF-κB and autophagy pathways are constitutively activated and contributed to the survival of the resistant HCT-116RC cells,Citation5,Citation33 maspin may also interact with key proteins in these prosurvival pathways (). A full understanding of maspin’s role as an anti-apoptotic protein will benefit from technologies such as yeast 2-hybrid analyses, co-immuno-precipitations, cDNA microarrays, proteomic analyses and transmission electron microscopy after siRNA knockdown, and confocal microscopy for organelle localizations under different experimental conditions.
To understand maspin’s role in colon carcinogenesis, an immunohistochemical analysis of maspin expression was performed in the epithelial cells of macroscopically normal colonic mucosa, polyps, adenomas and adenocarcinomas. It was found that maspin is highly expressed at the polyp and adenocarcinoma stages of colon carcinogenesis, which is consistent with others’ results.Citation29 High maspin expression, however, was not observed as “field defects” in the non-neoplastic colonic mucosa,Citation78 either directly adjacent to a tumor or at different distances proximal or distal to the tumor. In contrast, “field defects” were observed in the decreased expression of the DNA repair proteins Pms2, ERCC1, Xpf, and Ku86,Citation41,Citation79 and in an apoptosis-related mitochondrial protein, cytochrome c oxidase.Citation40,Citation42 It is possible that a dramatic and sustained increase in maspin expression at the polyp stage may drive sporadic colon tumorigenesis through its anti-apoptotic function and interaction with other survival signaling pathways in the colon. The anti-apoptotic function of maspin might also allow cells in a field of genomic instability within polyps and adenocarcinomas to proliferate and undergo further clonal expansion ().
Although DOC was previously thought to be a promoter of colon cancer, the authors have previously documented that DOC is a true carcinogen.Citation80 The authors found that prolonged dietary feeding of DOC to mice (to produce the colonic level of DOC found in the colons of humans on a high-fat diet) was responsible for the formation of both adenomasCitation81 and adenocarcinomasCitation80 in the mouse proximal colon. The DOC-induced increase in maspin expression previously documentedCitation5 may explain the increase in maspin expression in ampullary adenocarcinomas that occur near the ampulla of Vater,Citation82 through which copious amounts of bile are released into the small intestine (see endoscopy image in Rana et alCitation83). DOC contained in the secreted bile may be responsible for the formation of these rare adenocarcinomas that occur in the small intestine.
An interesting question has emerged from the authors’ studies concerning the role of maspin expression during colon carcinogenesis. Since maspin expression first appears significantly increased at the polyp stage of sporadic colon carcinogenesis, but is significantly increased in the non-neoplastic mucosa of patients with inflammatory bowel disease, what is the role of inflammation in sporadic colon cancer? An increase in maspin expression as a “field defect” was not observed in the colon of patients with sporadic colon cancer, and distinct areas of inflammatory infiltrates, as observed in UC, were absent in the tissues examined in the present study. There appear to be multiple pathways to colon cancer, including inherited genetic mutations, inflammatory conditions of the colon (eg, UC, Crohn’s disease), and a high-fat/low-vegetable diet. The development of sporadic colon cancer appears to result, in large part, from dietary factors. Since increased hydrophobic bile acids are associated with a high fat diet, persistent exposure to these bile acids over decades can induce multiple stresses on colon cells, causing DNA damage, oxidative/ nitrosative stress, and mitotic perturbations,Citation34,Citation46,Citation84–Citation90 resulting in the gradual selection of clones with a growth advantage (). The increase in maspin at the polyp stage in sporadic colon cancer may then reflect the proliferation of persistently stressed clones of cells. Since maspin is clearly a stress-response protein, it is possible that it responds to specific stresses associated with the polyp stage of colon carcinogenesis, which may be accentuated by a decrease in key DNA repair proteins, for example. Since the tissues of the polyps/cancers with high maspin expression also do not show an apparent inflammatory infiltrate, the association between maspin and inflammation in sporadic colon cancer cannot be made in the present study. In inflammatory bowel disease, large areas of the colon may be in a “highly stressed state,” as a result of multiple deleterious factors secreted from inflammatory cells, resulting in persistently increased maspin expression (and increased apoptosis resistance) in the non-neoplastic mucosa. The normal mucosa of patients with UC can harbor significant DNA damage, oxidative damage, and even mutations in cancer-related oncogenes,Citation91,Citation92 a situation that may increase the probability of development of neoplasia under these severe inflammatory conditions.
In future studies, it will be important to understand the mechanisms by which maspin functions as an anti-apoptotic protein, and to determine its role in early preneoplastic lesions. It may also serve as a biomarker to evaluate colon cancer risk and tumor progression, perhaps in conjunction with other biomarkers, such as increased 8-oxoguanine and loss of DNA repair proteins.
Acknowledgments
Supported by NIH grant #R01CA119087 and Biomedical Diagnostics & Research Inc, Tucson, AZ.
Disclosure
The authors report no conflicts of interest in this work.
References
- BernsteinHBernsteinCPayneCMGarewalHRecent molecular evidence illuminates the decades-long debate on the role of dietary fat in colon carcinogenesisJ Cancer Integr Med20042107109
- BernsteinHBernsteinCPayneCMDvorakovaKGarewalHBile acids as carcinogens in human gastrointestinal cancersMutat Res20055891476515652226
- BernsteinCPayneCMDvorakKBernsteinHRole of bile acids in gastrointestinal carcinogenesisUS Gastroenterol Hepatol Rev200846872
- BernsteinHBernsteinCPayneCMDvorakKBile acids as endogenous etiologic agents in gastrointestinal cancerWorld J Gastroenterol200915273329334019610133
- Crowley-WeberCLPayneCMGleason-GuzmanMDevelopment and molecular characterization of colon cell lines resistant to the tumor promoter and multiple stress-inducer, deoxycholateCarcinogenesis200223122063208012507930
- McCormickFCancer: survival pathways meet their endNature2004428698026726915029179
- WendelHGDe StanchinaEFridmanJSSurvival signalling by Akt and eIF4E in oncogenesis and cancer therapyNature2004428698033233715029198
- PayneCMBernsteinHBernsteinCGarewalHThe role of apoptosis in biology and pathology: Resistance to apoptosis in colon carcinogenesisUltrastruct Pathol19951942212487571081
- BernsteinCBernsteinHGarewalHA bile acid-induced apoptosis assay for colon cancer risk, and associated quality control studiesCancer Res199959102353235710344743
- PayneCMBernsteinCDvorakKBernsteinHHydrophobic bile acids, genomic instability, Darwinian selection and colon carcinogenesisClin Exp Gastroenterol20081194721677822
- PayneCMCrowley-SkillicornCBernsteinCHolubecHBernsteinHMolecular and cellular pathways associated with chromosome 1p deletion during colon carcinogenesisClin Exp Gastroenterol201147511921753893
- ShengSPembertonPASagerRProduction, purification, and characterization of recombinant maspin proteinsJ Biol Chem19942694930988309937983035
- SchneiderSSSchickCFishKEA serine proteinase inhibitor locus at 18q21.3 contains a tandem duplication of the human squamous cell carcinoma antigen geneProc Natl Acad Sci U S A1995928314731517724531
- ZouZAnisowiczAHendrixMJMaspin, a serpin with tumor-suppressing activity in human mammary epithelial cellsScience199426351465265298290962
- SeftorRSeftorEAShengSPembertonPASagerRHendrixMJCMaspin suppresses the invasive phenotype of human breast carcinomaCancer Res19985824568156859865722
- PembertonPAWongDTGibsonHLThe tumor suppressor maspin does not undergo the stressed to relaxed transition or inhibit trypsin-like serine proteases. Evidence that maspin is not a protease inhibitory serpinJ Biol Chem19952702615832158377797587
- NarayanMTwiningSFocus on molecules: maspinExp Eye Res20109012319615364
- LiuJYinSReddyNSpencerCShengSBax mediates the apoptosis-sensitizing effect of maspinCancer Res20046451703171114996730
- LiZShiHYZhangMTargeted expression of maspin in tumor vasculatures induces endothelial cell apoptosisOncogene200524122008201915688005
- LathaKZhangWCellaNShiHYZhangMMaspin mediates increased tumor cell apoptosis upon induction of the mitochondrial permeability transitionMol Cell Biol20052551737174815713631
- ZhangWShiHYZhangMMaspin overexpression modulates tumor cell apoptosis through the regulation of Bcl-2 family proteinsBMC Cancer200555015907209
- SchaeferJSZhangMTargeting maspin in endothelial cells to induce cell apoptosisExpert Opin Ther Targets200610340140816706680
- LiXChenDYinSMaspin augments proteasome inhibitor-induced apoptosis in prostate cancer cellsJ Cell Physiol2007212229830617458898
- ToillonRALagadecCPageAProteomics demonstration that normal breast epithelial cells can induce apoptosis of breast cancer cells through insulin-like growth factor-binding protein-3 and maspinMol Cell Proteomics2007671239124717446556
- McKenzieSSakamotoSKyprianouNMaspin modulates prostate cancer cell apoptotic and angiogenic response to hypoxia via targeting AKTOncogene200827577171717918931702
- BettstetterMWoenckhausMWildPJElevated nuclear maspin expression is associated with microsatellite instability and high tumour grade in colorectal cancerJ Pathol2005205560661415714592
- BoltzeCLoss of maspin is a helpful prognosticator in colorectal cancer: a tissue microarray analysisPathol Res Pract200520011–1278379015792121
- CaoDWilentzREAbbruzzeseJLHoLMaitraAAberrant expression of maspin in idiopathic inflammatory bowel disease is associated with disease activity and neoplastic transformationInt J Gastrointest Cancer2005361394616227634
- ZhengHTsuneyamaKChengCMaspin expression was involved in colorectal adenoma-adenocarcinoma sequence and liver metastasis of tumorsAnticancer Res2007271A25926517352241
- MarklBArnholdtHMJahnigHShift from cytoplasmic to nuclear maspin expression correlates with shorter overall survival in node-negative colorectal cancerHum Pathol20104171024103320334895
- Pasz-WalczakGSalagackaAPotemskiPBalcerczakEKorderRMirowskiMMaspin and Nm23-H1 expression in colorectal cancerNeoplasma20105729510120099971
- PayneCMCrowley-WeberCLDvorakKMitochondrial perturbation attenuates bile acid-induced cytotoxicityCell Biol Toxicol2005215–621523116323058
- PayneCMCrowley-SkillicornCHolubecHDeoxycholate, an endogenous cytotoxin/genotoxin, induces the autophagic stress-survival pathway: Implications for colon carcinogenesisJ Toxicol2009114 article ID 78590710.1155/2009/785907
- PayneCMCrowley-SkillicornCBernsteinCHolubecHMoyerMPBernsteinHHydrophobic bile acid-induced micronuclei formation, mitotic perturbations and decreases in spindle checkpoint proteins: Relevance to genomic instability in colon carcinogenesisNutr Cancer201062682584020661832
- YanQBriehlMCrowleyCLPayneCMBernsteinHBernsteinCThe NAD+ precursors, nicotinic acid and nicotinamide upregulate glyceraldehyde-3-phosphate dehydrogenase and glucose-6-phosphate dehydrogenase mRNA in Jurkat cellsBiochem Biophys Res Commun1999255113313610082668
- QiLSitKHHousekeeping genes commanded to commit suicide in CpG-cleavage commitment upstream of Bcl-2 inhibition in caspase-dependent and independent pathwaysMol Cell Biol Res Comm200035319327
- DittmerADittmerJBeta-actin is not a reliable loading control in Western blot analysisElectrophoresis200627142844284516688701
- KuzelovaKPluskalovaMGrebenovaDPavlaskovaKHaladaPHrkalZChanges in cell adhesivity and cytoskeleton-related proteins during imatinib-induced apoptosis of leukemic JURL-MK1 cellsJ Cell Biochem201011161413142520830748
- BernsteinHHolubecHWarnekeJAPatchy field defects of apoptosis resistance and dedifferentiation in flat mucosa of colon resections from colon cancer patientsAnn Surg Oncol20029550551712052764
- PayneCMHolubecHBernsteinCCrypt-restricted loss and decreased protein expression of cytochrome c oxidase subunit I as potential hypothesis-driven biomarkers of colon cancer riskCancer Epidemiol Biomarkers Prevent200514920662075
- BernsteinHPrasadAHolubecHReduced Pms2 in non-neoplastic flat mucosa from patients with colon cancer correlates with reduced apoptosis competenceAppl Immunohistochem Mol Morphol200614216617216785784
- BernsteinCFacistaANguyenHCancer and age related colonic crypt deficiencies in cytochrome c oxidase IWorld J Gastrointest Oncol201021242944221191537
- HolubecHPayneCMBernsteinHAssessment of apoptosis by immunohistochemical markers compared to cellular morphology in ex vivo-stressed colonic mucosaJ Histochem Cytochem200553222923515684335
- BernsteinHPayneCMKunkeKA proteomic study of resistance to deoxycholate-induced apoptosisCarcinogenesis200425568169214729586
- PayneCMWaltmireCNCrowleyCCaspase-6 mediated cleavage of guanylate cyclase α1 during deoxycholate-induced apoptosis: Protective role of the nitric oxide signaling moduleCell Biol Toxicol200319637339215015762
- Dall’AgnolMBernsteinCBernsteinHGarewalHPayneCMIdentification of S-nitrosylated proteins after chronic exposure of colonic epithelial cells to deoxycholateProteomics2006651654166216404723
- SchreckRRieberPBaeuerlePAReactive oxygen intermediates as apparently widely used messengers in the activation of the NF-kappaB transcription factor and HIV-1EMBO J1991108224722582065663
- TurpaevKTReactive oxygen species and regulation of gene expressionBiochem (Mosc)2002673281292
- OlofssonBAKellyCMKimJHornsbySMAzizkhan-CliffordJPhosphorylation of SP1 in response to DNA damage by ataxia telangiectasia-mutated kinaseMol Cancer Res20075121319133018171990
- IwahoriSYasuiYKudohAIdentification of phosphorylation sites on transcription factor Sp1 in response to DNA damage and its accumulation at damaged sitesCell Signal200820101795180318619531
- ZouZGaoCNagaichAKp53 regulates the expression of the tumor suppressor gene maspinJ Biol Chem200027596051605410692390
- TalosFMollUMRole of the p53 family in stabilizing the genome and preventing polyploidizationAdv Exp Med Biol2010676739120687470
- YoshidaKMikiThe cell death machinery governed by the p53 tumor suppressor in response to DNA damageCancer Sci2010101483183520132225
- MaekawaTSanoYShinagawaTATF-2 controls transcription of Maspin and GADD45 alpha genes independently from p53 to suppress mammary tumorsOncogene20082781045105417700520
- BowenCGelmannEPNKX3.1 activates cellular response to DNA damageCancer Res20107083089309720395202
- Khalkhali-EllisZMaspin: the new frontierClin Cancer Res200612247279728317189399
- GaoFShiHYDaughtyCCellaNZhangMMaspin plays an essential role in early embryonic developmentDevelopment200413171479148914985257
- NelsonDATanT-TRabsonABAndersonDDegenhardtKWhiteEHypoxia and defective apoptosis drive genomic instability and tumorigenesisGenes Dev200418172095210715314031
- MendezOFernandezYPeinadoMAMorenoVSierraAAnti-apoptotic proteins induce non-random genetic alterations that result in selecting breast cancer metastatic cellsClin Exp Metastasis200522429730716170666
- LawRHIrvingJABuckleAMThe high resolution crystal structure of the human tumor suppressor maspin reveals a novel conformational switch in the G-helixJ Biol Chem2005280223562236415760906
- NawataSShiHYSuginoNZhangMEvidence of post-translational modification of the tumor suppressor maspin under oxidative stressInt J Mol Med201127224925421132260
- CummingRCAndonNLHaynesPAParkMFischerWHSchubertDProtein disulfide bond formation in the cytoplasm during oxidative stressJ Biol Chem200427921217492175815031298
- ShengSMaspin and the order of signalingCancer Biol Ther20032440440514508114
- NamEParkCMaspin suppresses survival of lung cancer cells through modulation of Akt pathwayCancer Res Treat2010421424720369051
- PopCSalvesenGSHuman caspases: Activation, specificity, and regulationJ Biol Chem200928433217772178119473994
- YinSLiXMengYTumor-suppressive maspin regulates cell response to oxidative stress by direct interaction with glutathione S-tranferaseJ Biol Chem200528041349853499616049007
- NobuokaATakayamaTMiyanishiKGlutathione-S-transferase P1-1 protects aberrant crypt foci from apoptosis induced by deoxycholic acidGastroenterol20041272428443
- RavagnanLGurbuxaniSSusinSAHeat-shock protein 70 antagonizes apoptosis-inducing factorNat Cell Biol20013983984311533664
- GurbuxaniSSchmittECandeCHeat shock protein 70 binding inhibits the nuclear import of apoptosis-inducing factorOncogene200322436669667814555980
- MatsumoriYHongSMAoyamaKHSP70 overexpression sequesters AIF and reduces neonatal hypoxic/ischemic brain injuryJ Cereb Blood Flow Metab200525789991015744251
- LuiJCKongSKHeat shock protein 70 inhibits the nuclear import of apoptosis-inducing factor to avoid DNA fragmentation in TF-1 cells during erythropoiesisFEBS Lett2007581110911717182042
- ZhuQXuYMWangLFHeat shock protein 70 silencing enhances apoptosis inducing factor-mediated cell death in hepatocellular carcinoma HepG2 cellsCancer Biol Ther20098979279819270509
- ChoudhurySBaeKeQLeeJYKimJKangPMMitochondria to nucleus translocation of AIF in mice lacking Hsp70 during ischemia/ reperfusionBasic Res Cardiol2011106339740721387140
- YeHCandeCStephanouNCDNA binding is required for the apoptogenic actin of apoptosis inducing factorNat Struct Biol20029968068412198487
- VahsenNCandeCDupaignePPhysical interaction of apoptosis-inducing factor with DNA and RNAOncogene200625121763177416278674
- SusinSALorenzoHKZamzamiNMolecular characterization of mitochondrial apoptosis-inducing factorNature199939767184414469989411
- ModjtahediNGiordanettoFMadeoFKroemerGApoptosis-inducing factor: vital and lethalTrends Cell Biol200616526427216621561
- BernsteinCBernsteinHPayneCMDvorakKGarewalHField defects in progression to gastrointestinal tract cancersCancer Lett20092601–211018164807
- NguyenHLoustaunauCFacistaADeficient Pms2, ERCC1, Ku86, CcOI in field defects during progression to colon cancerJ Vis ExpJuly 28201041 Pii: 193110.3791/1931
- BernsteinCHolubecHBhattacharyyaAKCarcinogenicity of deoxycholate, a secondary bile acidArch Toxicol201185886387121267546
- PayneCMHolubecHBhattacharyyaAKBernsteinCBernsteinHExposure of mouse colon to dietary bile acid supplement induces sessile adenomasInflamm Bowel Dis200916572973020135625
- BlandamuraSD’AlessandroEGuzzardoVMaspin expression in adenocarcinomas of the ampulla of Vater: relation with clinicopathological parameters and apoptosisAnticancer Res20072721059106617465244
- RanaSSBhasinDKSinghKAmpulla of Vater as seen on capsule endoscopyGastrointest Endoscopy2008683613
- Washo-StultzDHoglenNBernsteinHBernsteinCPayneCMRole of nitric oxide and peroxynitrite in bile salt-induced apoptosis: relevance to colon carcinogenesisNutr Cancer199935218018810693173
- Washo-StultzDCrowley-WeberCLDvorakovaKRole of mitochondrial complexes I and II, reactive oxygen species and arachidonic acid metabolism in deoxycholate-induced apoptosisCancer Lett2002177212914411825660
- BernsteinHHolubecHBernsteinCDeoxycholate-induced colitis is markedly attenuated in Nos2 knock-out mice in association with modulation of gene expression profilesDig Dis Sci200752362864217253130
- PayneCMWeberCCrowley-SkillicornCDeoxycholate induces mitochondrial oxidative stress and activates NF-κB through multiple mechanisms in HCT-116 colon epithelial cellsCarcinogenesis200728121522216887864
- PayneCMCrowleyCWasho-StultzDThe stress-response proteins poly(ADP-ribose) polymerase and NF-κB protect against bile salt-induced apoptosisCell Death Diff199857623636
- BernsteinHPayneCBernsteinCBeardSSchneiderJCrowleyCActivation of the promoters of genes associated with DNA damage, oxidative stress, ER stress and protein malfolding by the bile salt, deoxycholateToxicol Lett19991081374610472808
- GlinghammarBInoueHRafterJJDeoxycholic acid causes DNA damage in colonic cells with subsequent induction of caspases, COX-2 promoter activity and the transcription factors NF-κB and AP-1Carcinogenesis200223583984512016158
- TerzicJGrivennikovSKarinEKarinMInflammation and colon cancerGastroenterol2010138621012114
- KawanishiSHirakuYOxidative and nitrative DNA damage as biomarker for carcinogenesis with special reference to inflammationAntioxidants Redox Signal200685–610471058