
 ?Mathematical formulae have been encoded as MathML and are displayed in this HTML version using MathJax in order to improve their display. Uncheck the box to turn MathJax off. This feature requires Javascript. Click on a formula to zoom.
Abstract
Serum bilirubin measurements are commonly obtained for the evaluation of ill patients and to screen for liver disease in routine physical exams. An enormous research effort has identified the multiple mechanisms involved in the production and metabolism of conjugated (CB) and unconjugated bilirubin (UB). While the qualitative effects of these mechanisms are well understood, their expected quantitative influence on serum bilirubin homeostasis has received less attention. In this review, each of the steps involved in bilirubin production, metabolism, hepatic cell uptake, and excretion is quantitatively examined. We then attempt to predict the expected effect of normal and defective function on serum UB and CB levels in health and disease states including hemolysis, extra- and intrahepatic cholestasis, hepatocellular diseases (eg, cirrhosis, hepatitis), and various congenital defects in bilirubin conjugation and secretion (eg, Gilbert’s, Dubin–Johnson, Crigler–Najjar, Rotor syndromes). Novel aspects of this review include: 1) quantitative estimates of the free and total UB and CB in the plasma, hepatocyte, and bile; 2) detailed discussion of the important implications of the recently recognized role of the hepatic OATP transporters in the maintenance of CB homeostasis; 3) discussion of the differences between the standard diazo assay versus chromatographic measurement of CB and UB; 4) pharmacokinetic implications of the extremely high-affinity albumin binding of UB; 5) role of the enterohepatic circulation in physiologic jaundice of newborn and fasting hyperbilirubinemia; and 6) insights concerning the clinical interpretation of bilirubin measurements.
Keywords:
Introduction
The yellow color imparted to the skin and sclera by elevations of plasma bilirubin has piqued the interest of physicians since the time of Hippocrates.Citation1 Quantitation of serum bilirubin as a diagnostic test awaited the description of the diazo reagent measurement of direct and indirect bilirubin by van den Bergh and Muller in 1916.Citation2 An additional 40 years elapsed before direct and indirect reacting bilirubins were shown, respectively, to be the glucuronide-conjugated (CB) and unconjugated (UB) forms of this molecule.Citation3,Citation4 An enormous body of research carried out over the last 100 years has elucidated the major features of bilirubin biochemistry and physiology. However, interest in this topic has waned in recent years, and most physicians have only a rudimentary understanding of the physiological/biochemical mechanisms that determine serum CB and UB concentrations in health and disease. Recently, such understanding has taken on greater clinical importance in that the precise serum bilirubin concentration is a major component in the calculation of the Model for End-Stage Liver Disease (MELD), Child–Pugh, Maddrey, and FibroTest discriminant function scores that are used to direct therapy and predict the prognosis of patients with liver disease.
Many of the important concepts concerning bilirubin excretion were published 40 or more years ago (see the 1990 edition of Zakim and Boyer’s Hepatology: A Textbook of Liver Disease)Citation5 and are no longer emphasized in current publications. In the present review, we have incorporated these older data with knowledge acquired since 1990, primarily of the genetic characterization of the bilirubin transport proteins.Citation6 The more novel aspect of this review is our attempt to quantitatively characterize each of the different pathways involved in bilirubin excretion and to show how these pathways interact to produce the serum bilirubin values observed in health and disease. diagrams the steps involved in bilirubin elimination – from its formation from heme to its gastrointestinal and renal excretion as glucuronide conjugates. This complex process involves multiple membrane transporters and enzymes. In addition to the normal transport pathways indicated by the solid lines, three other pathways (dashed lines) may become important when there is a reduced capacity to conjugate or excrete bilirubin. The terms in red refer to the selected, well-defined pathological conditions that alter the different pathways, each of which is discussed in detail in this review. While a wide range of bilirubin concentrations are observed both in health and disease, typical representative values for total bilirubin (TB), UB, and CB in normal and pathological conditions are listed in . Clinically, bilirubin concentrations are commonly expressed as mg/dL rather than umol/L (μM). One mg/dL of bilirubin is equivalent to 17.2 μM. Despite different molecular weights, the conversion factor is the same for UB and CB because mg/dL units represent only the weight of the bilirubin moiety of the conjugated molecule. For ease of understanding by clinicians, we employ mg/dL units when discussing measurements used in medical practice, whereas molar units may be utilized for more basic calculations.
Figure 1 Major pathways involved in bilirubin production, conjugation, and excretion.
Abbreviations: ATP, adenosine triphosphate; CB, conjugated bilirubin; GI, gastrointestinal; UB, unconjugated bilirubin; UGT, uridine diphosphate glycosyltransferase; ??, the mechanism is unknown.
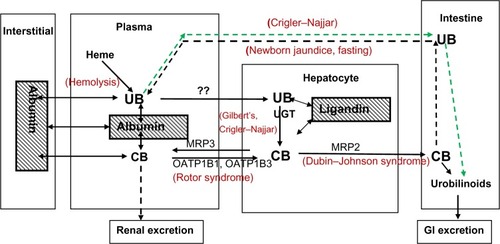
Table 1 Representative human plasma bilirubin values
UB: production, solubility, albumin binding, and pharmacokinetics
Bilirubin (a tetrapyrrole chain) is created when the alpha-methylene bridge of the tetrapyrrole ring of heme is cleaved by heme oxygenase. This reaction releases the alpha-methene carbon as carbon monoxide (CO) and biliverdin, which is rapidly reduced to bilirubin via the activity of biliverdin reductase. Since heme catabolism is the only endogenous source of CO in humans, and this CO is quantitatively excreted in expired air, breath CO measurements (corrected for ambient CO) provide a noninvasive means of estimating bilirubin production and red blood cell (RBC) turnover, a measurement not provided by any other simple methodology.Citation7,Citation8 About 250 mg/day of bilirubin is produced by normal adult humans; roughly 75% of this is derived from circulating hemoglobin, while the other 25% is derived from catabolism of other heme compounds, primarily cytochromes. Until recently, the breakdown of heme to bilirubin was considered simply to be a step in the elimination of senescent heme. However, it is now recognized that the products of this reaction have important regulatory functions: CO is an intracellular gaseous messenger, analogous to the well-accepted function of nitric oxide,Citation9–Citation11 and bilirubin is a free radical scavenger with antioxidant and anti-inflammatory actions.Citation12,Citation13 Mancuso and Barone have presented a detailed review of the oxygenase/biliverdin reductase reaction with a focus on the possible sites of clinical and pharmacological regulation of this reaction and the resulting control of the local concentrations of CO and/or bilirubin.Citation14 In addition, biliverdin reductase has a variety of other functions, including acting as a transcription factor and an activator of protein kinase C and other signaling pathways.Citation15 Although it was suggested that there was a redox cycling between bilirubin and biliverdin,Citation16 this is now thought to be of minor importance.Citation17,Citation18 In addition to bilirubin’s antioxidant properties, both free and albumin-bound bilirubin can scavenge NO and NO-related species.Citation19–Citation21 These myriad clinical actions of bilirubin suggest that there is teleological benefit to the seemingly counterproductive conversion of water-soluble, readily excretable biliverdin to highly water-insoluble UB that must be conjugated with glucuronides to become water soluble and hence excretable by the liver and kidney. Support for a beneficial effect of UB is provided by multiple studies showing a negative association between serum bilirubin concentration and various diseases such as coronary artery disease in subjects with normal liver function,Citation22–Citation24 as well as in subjects with Gilbert’s syndrome.Citation25
UB is formed in reticuloendothelial cells, transported to the liver where it is conjugated to glucuronides, and then secreted into the canaliculi. UB has unusual physical chemical properties. As a dicarboxylic acid, this molecule would be expected to have high water solubility; however, unusual intramolecular hydrogen bonding ties up the hydrophilic groups. Thus, UB has a very low water solubility, and in some respects behaves as if it were a lipophilic solute.Citation26 The water solubility at pH 7.4 is experimentally uncertain, with estimates ranging from 7 nMCitation27 to 100 nM.Citation28 As expected for a lipophilic solute, UB has a high octanol/buffer partition ratio of about 23 at pH 8.2Citation29 and a high permeability through lipid bilayer membranes,Citation30 which is manifested clinically by its ability to cross the blood–brain barrier.Citation29 This membrane permeability prevents secretion of high concentrations of UB by the liver or kidney, since UB would rapidly back-diffuse into the blood, hence the need for glucuronide conjugation to water-soluble CB prior to excretion. In contrast to most hydrophobic compounds, bilirubin has a low partition in olive oil and is not taken up by adipose tissue,Citation27 suggesting that the hydroxyl group of octanol accounts for its ability to solubilize UB. The insolubility of UB in adipose tissue limits the distribution space of UB to only the albumin space – about 9 L in normal subjects.Citation31 As a result, plasma UB concentrations fluctuate far more rapidly than would be expected for a typical lipid-soluble molecule.
UB is solubilized in serum via a very tight linkage to albumin. The measurement of the albumin dissociation constant (Kd) is uncertain, with reported values ranging from 8 to 160 nM.Citation32 We will use the value of 17 nM recommended in the authoritative review by Brodersen and Stern.Citation27 Although free serum UB concentration cannot be directly measured, based on this Kd, the unbound concentration is estimated to be in the order of 0.16 nM, about 1/50,000 of the total serum UB. The tight albumin binding of UB precludes glomerular filtration; thus, urine remains normal in appearance in icteric states resulting from hemolysis or genetic conjugating defects, conditions characterized by increased concentrations of only UB (). Since the normal plasma albumin concentration is 0.6 mM, UB concentrations of about 0.5 mM (29 mg/dL) are required to saturate the single high-affinity binding site per albumin molecule. This value is seldom achieved, with the exception of conditions in the newborn and patients with severe, congenital conjugation defects resulting in permeation of the blood–brain barrier and kernicterus.Citation33,Citation34 The molecular mechanisms of the bilirubin-induced neuronal cell injury are poorly understood, but likely include mitochondrial and/or endoplasmic reticulum membrane damage leading to increased intracellular Ca++.Citation35 It has also been suggested that the neurotoxic actions of bilirubin may result from its ability to modulate neurotrophin redox signaling.Citation36
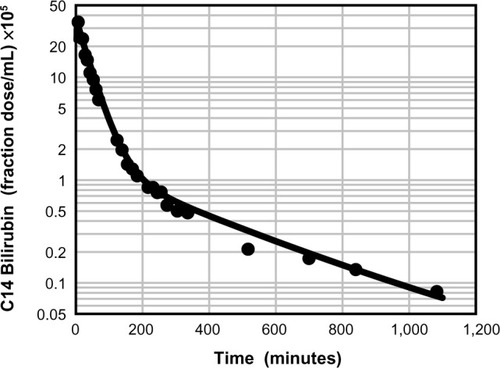
The affinity of albumin for UB is several orders of magnitude stronger than its affinity for most other drugs and endogenous compounds.Citation37 It has not been fully appreciated that this strong binding produces severe but finite constraints on the rate at which UB distributes between plasma and tissue spaces. For example, Berk et alCitation38 presented a detailed description of the plasma kinetics of an intravenously infused bolus of 14C-labeled UB, and shows a typical disappearance curve of labeled UB from the serum of a normal subject. Berk et al then developed a three-compartment, eight-parameter model representing the plasma, liver, and extravascular space to explain the somewhat unusual time course of UB disappearance from the plasma.Citation38 For what they assumed to be a totally albumin-bound solute, their model had an unusually rapid exchange rate between plasma and extracellular space (about a 9-hour time constant). This required Berk et alCitation38 to postulate the existence of a “rapidly exchanging” albumin pool to explain the 9-hour time constant, whereas the commonly accepted time constant for albumin is about 24 hours.
Figure 2 Physiologically based theoretical prediction (PBPK) of plasma unconjugated bilirubin concentration following a bolus 14C dose.
What was seemingly not recognized by Berk et al was that the observed UB exchange was consistent with movement of just the very small, but not negligible, unbound UB without invoking any albumin exchange. It can be shown that the fractional equilibration (FrEq) of UB between the plasma and interstitial albumin in a single pass through the capillary is described by:Citation39
(1)
where fp is the fraction free in plasma; S and F are the organ capillary surface area and flow, respectively; and P is the intrinsic capillary permeability (ie, if there were no albumin binding). The fraction that equilibrates is zero for an impermeable solute (P=0), and is 1 for an infinitely permeable solute. A solute can have a high intrinsic permeability (P), but a low fractional equilibration if it is highly protein bound (ie, has a small fp). UB with an fp of about 2×10⁻⁵ presents an extreme example of this phenomenon.Citation27
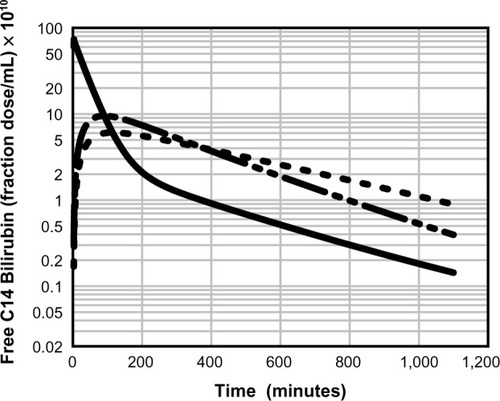
A physiologically based pharmacokinetic (PBPK) model for humans developed by one of the authors (DGL)Citation40 describes the pharmacokinetics of an albumin-bound solute in terms of the predicted capillary permeability, known organ flows and volumes, plasma and interstitial albumin concentration, and the plasma unbound fraction. Kinetics are assumed to be independent of the slow albumin plasma–tissue exchange. This model was previously used to estimate the capillary permeability of albumin-bound antibiotics.Citation31,Citation39 demonstrates the excellent fit of UB plasma disappearance predicted by the PBPK model with the experimental data of Berk et al.Citation38 It should be emphasized that this analysis employs the previously established normal human PBPK parametersCitation40 and has only two adjustable parameters: liver clearance and fractional equilibration for skeletal muscle. In contrast, the three-compartment model of Berk et alCitation38 had eight adjustable parameters. shows a plot of the time course of the PBPK model concentrations of free bilirubin in plasma and in two representative interstitial compartments: muscle (small interstitial space) and skin (large interstitial space). For times longer than about 100 minutes, the interstitial free concentration is greater than that of the plasma, and the slow movement of this interstitial UB back into the plasma is responsible for the slow rate of decay of the plasma UB.
Figure 3 Physiologically based theoretical prediction model of the free (unbound) unconjugated bilirubin concentration in the vein (solid line), muscle (long dashed line), and skin (short dashed line) following a bolus 14C dose.
CB: albumin binding, renal excretion, covalent albumin binding, and clinical measurements
The standard clinical measurement of CB as “direct”-reacting bilirubin is based on the assumption that only CB reacts “directly” with the diazo reagent, ie, without an accelerant. However, compounds other than CB are measured as direct-reacting bilirubin.Citation41 Measurements using analytic liquid chromatographic (high-performance liquid chromatography [HPLC]) measurements of the mono- and diconjugated bilirubin fractions indicate that CB comprises only about 3% of TB, or about 0.012 mg/dL (about one-eighth of the direct reacting value of 0.1 mg/dL) for an “average” subject with a TB of 0.4 mg/dL. Most of the values listed in are based on HPLC measurements. One of the rare comparisons of the HPLC and diazo measurements of CB described the rising plasma CB in guinea pigs following bile duct obstruction.Citation42 Before obstruction, CB was undetectable (<0.006 mg/dL) by HPLC measurement, while the diazo CB was 0.1 mg/dL (similar to normal human plasma). As serum CB rose after obstruction, the diazo CB remained about 0.1 mg/dL greater than the HPLC measurement,Citation42 suggesting a constant background contaminant (about 0.1 mg/dL), possibly representing cross-reacting UB.Citation43 When CB approaches 1 mg/dL or greater, this 0.1 mg/dL artifact becomes negligible and the direct diazo measurement accurately quantitates CB.
diagrams the major pathways involved in bilirubin conjugation and excretion. In addition to the normal bile CB excretion, the kidney can also excrete CB, since the unbound fraction of CB is freely filtered at the glomerulus and CB has a high water solubility, reaching concentrations of 500 mg/dL (7 mM) in gall bladder bile.Citation44 However, the combination of the very low normal plasma concentration of CB in conjunction with about 99% albumin bindingCitation45 renders urine bilirubin unmeasurable in healthy subjects. However, in some pathological conditions, serum CB concentration reaches a level that allows the urinary tract to become the major/sole excretory pathway. This was clearly illustrated by canine experiments showing that, following total biliary obstruction, plasma CB concentration rose to a steady-state value of only about 3 mg/dL (more than 70% conjugated), at which time the renal excretion of CB roughly equaled the expected bilirubin production.Citation46,Citation47 In these dogs, the CB renal clearance (CBclr) was about 1.7% of the creatinine clearance, which was in good agreement with the experimental dialyzable free fraction of 1.6% that is observed in dogs.Citation45 As expected, the plasma steady-state level was inversely related to the creatinine clearance. For humans, the dialysis value of about 0.7% free was consistent with the experimentally determined CBclr of 0.7% of the creatinine clearance.Citation45 In infants with biliary atresia, CB rises to about 15 mg/dL (260 μM []), the predicted value if the kidney accounted for all excretion of bilirubin with a CBclr of 0.7% of creatinine clearance. In these infants, 45%–71% of intravenously administered 14C-labeled bilirubin was recovered in the urine over 10 days.Citation48
At first glance, it is surprising that a CBclr of only 0.7% of that of creatinine can bring about bilirubin homeostasis. However, a creatinine clearance of 120 mL/minute extrapolates to a glomerular filtration rate of 173 L per day; 0.7% of this value yields a CBclr (if no reabsorption) of 1.2 L per day. When the serum CB reaches a level of 20 mg/dL, the daily renal excretion of bilirubin (200 mg/L ×1.2 L) equals 240 mg of bilirubin, roughly the normal production rate of this compound.
The rate at which plasma CB concentration would be expected to rise with no biliary elimination of bilirubin, eg, complete biliary tract obstruction, can be predicted, assuming rapid equilibration into a distribution space (VCB) equal to the albumin space of 9 L. The plasma concentration as a function of time (CB[t]) should rise exponentially to a steady state with a time constant of T = VCB/CBclr:
(2)
where R is the rate of bilirubin production. In the normal human, where R=250 mg/day and CBclr =0.007×120 mL/minute =0.84 mL/minute, the plasma CB should rise initially at a rate of R/VCB =2.8 mg/dL per day with a time constant T of 7.4 days, and should reach a steady state of R/CBclr =20 mg/dL after about two time constants, or 15 days. Higher rates of rise or higher steady-state values indicate abnormally rapid bilirubin production and/or decreased creatinine clearance, both of which may occur in severe cholestatic liver disease.
The covalent linkage of CB with albumin (referred to as δ-bilirubin) first recognized by Weiss et al in 1983Citation49 is measured as “direct” (conjugated) bilirubin with the diazo reaction. The half-time of δ-bilirubin is the same as that of albumin (13- to 18-day half-time).Citation50 The percentage of the serum CB composed of δ-bilirubin increases with the duration of conjugated hyperbilirubinemia, reaching steady-state levels of as great as 40% in long-standing hyperbilirubinemia.Citation49 When the obstruction to bile flow is alleviated, this fraction can rise to greater than 80% as δ-bilirubin becomes concentrated by the hepatic excretion of the non-covalently linked CB, and serum CB declines very slowly despite restoration of bile flow.
Bilirubin glucuronidation and UB excretion
diagrams the major pathways involved in bilirubin conjugation and excretion. Bilirubin production occurs primarily in the spleen, and a loss of first-pass hepatic metabolism has been proposed as a cause of unconjugated hyperbilirubinemia in cirrhotic patients with varices.Citation51 However, first-pass metabolism is important only for compounds with a high-percentage extraction by the liver. The normal UB plasma clearance of about 47 mL/minute is only about 5% of liver plasma flow,Citation38 thus first-pass effects can be neglected.
Glucuronidation is a major pathway of liver metabolism, representing about 45% of all phase II (ie, conjugating) liver enzymes.Citation52 Glucuronidation of bilirubin is carried out by the uridine diphosphate glycosyltransferase (UGT) family of enzymes that catalyze the conjugation of a very wide variety of substrates.Citation53 About 11% of UGT is UGT1A1, an isozyme that specifically catalyzes the covalent linkage of glucuronic acid to one or both propionic acid side chains of bilirubin.Citation54,Citation55 A large range of mutations in UGT1A1 (Crigler–Najjar) and its promoter (Gilbert’s) produce a variety of phenotypes ranging from the complete absence of bilirubin conjugation (Crigler–Najjar type I) to a condition with minor (up to fivefold) increases in serum UB (Gilbert’s syndrome) ().Citation56 The ratio of monoconjugated-to-diconjugated CB in bile is about 0.37 in normal subjects and rises to 0.94 in those with Gilbert’s syndrome.Citation57
Surprisingly, the mechanism by which UB enters the liver remains an enigma. Despite an intensive search for proteins that actively transport UB into the hepatocyte, no transporters have been identified.Citation58,Citation59 In this era of genome-wide targeted gene screening,Citation60 the inability to identify a transporter raises the possibility that such a protein does not exist. Another argument against an active transport system is that it would have to work against leakage of the bilayer permeableCitation30 bilirubin out of the cell. For these reasons, it is useful to consider the quantitative implications of the proposal that passive diffusion accounts for the hepatocyte uptake of UB.Citation30,Citation61
The free plasma concentration of UB of only about 0.16 nM puts severe constraints on a simple passive diffusion mechanism. A quantitative example of this constraint is provided by calculation of the predicted conjugation rate for a UB concentration of 0.16 nM. Using human liver biopsies, the Vmax for bilirubin glucuronidation is about 1 mg/hour/g liver,Citation62,Citation63 corresponding to about 36,000 mg/day for a 70 kg human. Since these assays were carried out in the presence of detergents (digitonin or Triton X-100) and optimal cofactors, this Vmax probably overestimates the true in vivo value.Citation62 The determination of the UGT1A1 half maximal binding concentration (Km) is uncertain because of bilirubin instability, binding, and insolubility. Zhou et alCitation64 recently estimated a Km of 0.2 μM for purified recombinant UGT1A1. Since some nonspecific bilirubin binding by the recombinant assay medium could not be ruled out, this Km may be greater than the true value. Using these values for Vmax and Km, the predicted rate of glucuronidation at a free UB concentration of 0.16 nM is only about 28 mg/day, or one-ninth of the requisite value of 250 mg/day.Citation38 This estimate assumes that the entire hepatocyte is exposed to a 0.16 nM concentration of UB. The actual exposure of the liver to UB can be estimated from a calculation of the thickness of the rate-limiting diffusive unstirred layer (Lus) between the sinusoids and the site of UB metabolism in the hepatocyte:
(3)
Using a glucuridation rate of 250 mg/day, aqueous diffusion coefficient (D) of 3×10⁻⁶ cm2/second, sinusoidal surface area (S) for 70 kg human of 4.5×105 cm2,Citation65 and free plasma UB concentration ([UB]free plasma) of 0.16 nM, the limiting unstirred layer is only 0.42 μm. Thus, the UB concentration falls from the plasma free concentration (at the sinusoidal membrane) to zero over a 0.42 μm thickness, and only a small fraction of the hepatocyte (about 10%, assuming a 25 μm cell diameter) would have any UB concentration exposure. Thus, glucuronidation of UB seemingly could not occur at the observed rate if hepatocyte uptake relied solely on passive diffusion and the normal free UB concentration was 0.16 nM.
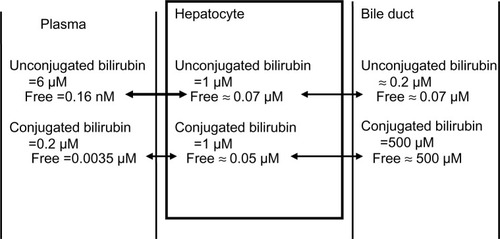
Direct measurements of the hepatocyte bilirubin concentration provide the strongest evidence for an active transport mechanism that raises the free UB concentration in the hepatocyte to a value greater than that in plasma. In the rat liver, the total (bound plus free) UB is about 1 μM, which is twice the rat serum concentration.Citation66,Citation67 There are no direct measurements of the hepatocyte free UB concentration, but it can be estimated from the following arguments. In the hepatocyte, UB is bound by several abundant cytosolic proteins that were initially referred to as “ligandins” and later identified as glutathione S-transferases.Citation68 The ligandin bilirubin Kd is about 5 μM,Citation32,Citation68 which is much weaker than that of albumin (Kd =17 nM). In addition, the ligandin concentration is about 0.07 mM, or one-tenth that of serum albumin.Citation69 Using these estimates, the free hepatocyte unconjugated concentration should be about 0.07 μM – about 400 times the free plasma value. summarizes these estimates of the total and free bilirubin concentrations in the plasma, hepatocyte, and bile duct (assuming human hepatocyte values are similar to rat).
Figure 4 Estimated normal human total and free (unbound) conjugated and unconjugated bilirubin in the plasma, hepatocyte, and bile duct.
It has been shown that the glucuronidation rate is proportional to the free (not total) plasma concentration of UB. For this case, in the steady state:
(4)
where k is the first-order glucuronidation rate constant and Freefr is the free plasma fraction. This relation predicts that the total plasma UB concentration should be inversely proportional to the free fraction (assuming a constant input from heme catabolism). This relationship was confirmed in the rat, where the free fraction was varied by infusion of salicylic acid or sulfisoxazole, competitive inhibitors of albumin binding of UB.Citation70,Citation71 As predicted by the above relation, doubling the free fraction reduced the total UB concentration by a factor of two but did not change the free concentration. A clinical illustration of this effect is seen in renal failure patients on dialysis. In such patients, the total plasma UB concentration was only one-quarter of the normal value,Citation72 and the free fraction was four- to eightfold greater than normal,Citation73,Citation74 as predicted from the above relation. This increase in free fraction (decrease in albumin affinity) in chronic renal failure has been attributed to plasma accumulation of organic acid “uremic toxins” such as 3-carboxy-4-methyl-5-propyl-2-furanpropanoic acid. Such compounds, which compete for the high-affinity albumin binding site for UB, reach concentrations of 0.4 mM.Citation75
The above results show that the glucuronidation rate is proportional to the serum free UB concentration and, therefore, the total UB is related to the albumin concentration (Alb) by the following relation:
(5)
where Kd is the UB albumin equilibrium dissociation constant. Thus, total serum UB should be proportional to the albumin concentration. Since serum albumin is reduced in most chronic diseases, total UB should be concomitantly reduced if the other factors in the above relation were unchanged. Although it has been suggested that the rate-limiting step in hepatic bilirubin uptake is the albumin dissociation rate,Citation76 this implies that the glucuronidation rate should be proportional to the total (not free) serum UB, and is therefore ruled out by the above observation.
UGT1A1 has a lower affinity for a variety of other xenobiotics than for UBCitation77 and a weak competitive inhibition of UB has been reported, eg, for indinavirCitation78 and ibuprofen.Citation79 Probably the most important competitive inhibitors are the mono- and diglucuronides of bilirubin.Citation80 Conditions that increase serum CB may produce very large increases (eg, 700-fold) in the hepatocyte CB concentration (see “CB transport from hepatocyte to blood”). Thus, competitive inhibition of conjugation might explain the rise in serum UB seen in cholestatic conditions that seemingly would act primarily on CB excretion and not alter UGT1A1 activity. This is discussed in more detail in the concluding section on the clinical implications of bilirubin metabolism (“Summary and clinical implications”).
As discussed in the section “CB: albumin binding, renal excretion, covalent albumin binding, and clinical measurements”, when the liver is unable to clear CB, the steady state is established primarily by urinary excretion of CB. In contrast, homeostasis for UB cannot be achieved via renal excretion, since only the trivial free fraction of UB could enter the urine and this free UB would not be concentrated due to back-diffusion from the tubule. For example, type I Crigler–Najjar subjects with a nearly complete absence of conjugating capacity excrete only about 5% of a 14C bilirubin dose in the urine,Citation81 and the steady state is established by gastrointestinal excretion as evidenced by a total fecal bile pigment excretion similar to that of normal subjects.Citation82 The mechanisms responsible for this intestinal excretion are poorly understood. There are two possible pathways. The first is via biliary secretion of bilirubin and bilirubin metabolites. Since the TB concentration of bile in type I Crigler–Najjar subjects was only about one-fifth of normal,Citation57,Citation83,Citation84 biliary secretion can account for only a small fraction of total excretion. Although Crigler–Najjar bile also contains significant amounts of bilirubin derivatives, these compounds are thought to be derived primarily from enterohepatic circulation of metabolites formed in the intestine and do not contribute to net bilirubin excretion.Citation85
The second intestinal excretion pathway for UB in type I Crigler–Najjar subjects is diffusion from the blood into the gut down a diffusion gradient maintained by bacterial and intestinal metabolism of luminal UB (indicated by the green dashed line in ). For Gunn rats (homologous to Crigler–Najjar) with external biliary diversions, fecal bile pigment concentration was more than 50% of that of control Gunn rats with no external drainage.Citation82 In contrast, in normal (Wistar) rats with diversion of all bile flow, there were no detectable stool bile pigments.Citation82 This strongly implies that more than 50% of the bilirubin clearance in Gunn rats is by transport from blood to intestine, presumably via passive diffusion. Direct support for the concept that appreciable UB diffuses into the intestine is provided by the observation that oral calcium phosphate, which binds UB and presumably increases the serum to lumen diffusion gradient, is very effective in lowering UB in Gunn ratsCitation86 and produces a small but statistically significant fall in serum UB in Crigler–Najjar type I patients.Citation87 Recently, it has been shown that Orlistat® (Roche, Woerden, the Netherlands) (a lipase inhibitor) significantly increases transmural intestinal UB excretion in Gunn rats, presumably by increasing the blood-to-lumen diffusion gradient via UB binding by undigested fat.Citation85
The following relationship estimates the plasma free UB concentration required to clear the total human daily bilirubin production rate (R=250 mg/day) by passive diffusion into the small intestine:
(6)
where P and S are the small intestinal permeability and surface area, respectively, and the last equality assumes that the intestinal concentration is maintained close to zero by intestinal metabolism. Using P=2×10⁻³ cm/second determined from the rate of human intestinal absorption of highly permeable (diffusion-limited) drugsCitation88 and S=4,400 cm2,Citation88 the free plasma UB would need to be about 0.56 μM. Although this value is much lower than the typical total UB found in Crigler–Najjar subjects of about 300 μM,Citation89 albumin binding will reduce the corresponding free UB concentration to only about 0.051 μM, or one-tenth of the requisite 0.56 μM required to bring about bilirubin homeostasis (assuming a serum albumin of 400 μM and an albumin dissociation constant of 17 nM). Although UB definitely reaches concentrations that saturate albumin in some type I Crigler–Najjar subjects,Citation90–Citation92 the mechanism establishing the steady state at lower UB concentrations (eg, 300 μM) is uncertain. Given that homeostasis is achieved in these patients, it seems necessary to postulate that free plasma UB must reach a concentration of roughly 0.56 μM, possibly via some mechanism that influences albumin binding of UB.
Bilirubin transport from hepatocyte to bile
CB is transported across the apical membrane of the hepatocyte into the bile by the multidrug resistance-associated protein (MRP) 2, a member of the superfamily of adenosine triphosphate-binding cassette transporters (ABC), also referred to as ABCC2 (). This transport system has recently been reviewed in depth by Nies and KepplerCitation93 and Jemnitz et al,Citation94 and our focus will be on the implications of this system for the general pharmacokinetics of bilirubin transport in normal and pathological conditions.
Free hepatocyte CB concentration has not been directly measured. In whole rat liver, the total CB concentration is about 1 μM.Citation66,Citation68 Most of this bilirubin is intracellular, since the contribution from contents of intrahepatic bile ducts is said to be small.Citation68 Intracellular CB is tightly bound to ligandin with a dissociation constant of about 3 μM,Citation68 similar to that for UB. Assuming a ligandin concentration of 0.07 mM,Citation69 the free hepatocyte concentration is about 0.04 μM. Although MRP2 transports a large variety of conjugated substrates, it has the highest affinity for CB with a Km for the mono- and diglucuronide of 0.7 and 0.9 μM, respectively.Citation93 Bile secreted by the liver has a CB concentration of about 500 μM, which is nearly all free. Thus, ATP-coupled active transport by MRP2 produces a relatively enormous, roughly 10,000-fold increase in free CB concentration. These estimates of bilirubin concentrations are summarized in .
Less than 1% of the bilirubin in the bile of normal subjects is unconjugated.Citation57 Since deconjugation occurs spontaneously in bile incubated at 37°C,Citation95 even this 1% may be artifactually produced during sampling and analytical procedures. In contrast, the very high serum UB concentration in Crigler–Najjar syndrome with severe UGT1A1 deficiency is seemingly in diffusion equilibrium with the hepatocyte, and bile and bile UB concentrations may reach 34 μM and constitute 50% of the total bile bilirubin. It is important to maintain very low concentrations of biliary UB since this poorly water-soluble compound is seemingly an initiating factor in gallstone formation,Citation44,Citation95 as evidenced by the high prevalence of gallstones in subjects with bilirubin conjugating defects.Citation96 Consistent with this observation, in subjects with normal serum bilirubin concentrations, the bilirubin in both pigment and cholesterol gallstones is >95% unconjugated,Citation97 indicating that precipitated UB is concentrated in gallstones.
The strongest evidence supporting the primary role of MRP2 in the transport of CB into the bile canaliculus is the high serum concentrations of CB observed with mutations in the MRP2 gene in Dubin–Johnson syndrome.Citation94,Citation98 Patients with this syndrome characteristically have a pigmented liver and roughly tenfold increase in total plasma bilirubin concentrations, consisting of a fourfold elevation in UB and a 200-fold elevation in CB ().Citation99 At a 2.34 mg/dL plasma CB, about 30 mg/day of bilirubin will be excreted by the kidney (see “CB: albumin binding, renal excretion, covalent albumin binding, and clinical measurements”), which is roughly 12% of the daily production. Thus, most of the bilirubin must still be excreted by the liver. This is consistent with the observation that rats with a similar genetic deficiency of MRP2 have a near-normal rate of biliary secretion of CB even though the rat plasma TB concentration is 25 times normal.Citation100 This biliary excretion may reflect the activity of a second, low-affinity ATP-independent transporter that partially compensates for the loss of MRP2.Citation101
CB transport from hepatocyte to blood
A recent, surprising observation suggests that defects in the sinusoidal transmembrane organic anion-transporting polypeptides (OATPs) are an important determinant of serum CB concentrations.Citation102,Citation103 In contrast to the ATP-coupled ABC transporter family (eg, canalicular membrane MRP2) that facilitates cellular efflux, the OATPs are members of the solute carrier (SLC) family that primarily promote cellular uptake of endo- and xenobiotics by a variety of tissues, including intestine, kidney, and liver.Citation104 The Km of OATP1B1 for bilirubin mono- and diglucuronide is 0.1 and 0.28 μM, respectively.Citation105 The mechanism, magnitude, and driving force for hepatic OATP solute transport is not known, although it is independent of both ATP and sodium.Citation104 The key new finding of Van de Steeg et alCitation102 and Iusuf et alCitation103 was that mice with a double knockout of OATP1A and OATP1B had about a 400-fold increase in serum CB along with a 50% reduction in the rate of secretion of bilirubin in bile and a markedly increased urinary CB excretion. Subjects with Rotor syndrome similarly have simultaneous complete deficiencies in the analogous human genes OATP1B1 and OATP1B3,Citation106 and the products of these genes are selectively localized to the hepatic basolateral (sinusoidal) membrane. These subjects have a conjugated hyperbilirubinemia (usually on the order of 5 mg/dL []), but lack the liver pigment characteristic of Dubin–Johnson syndrome.Citation107,Citation108 Another distinguishing feature of Rotor syndrome is a bromsulphthalein (BSP) clearance that is only about 15% of normal,Citation108,Citation109 as would be predicted if the sinusoidal OATP transport systems were required for the normal hepatic uptake of BSP. In contrast, in Dubin–Johnson syndrome, the initial hepatic uptake of BSP is close to normal, but, after about 45 minutes, there is a characteristic reflux of conjugated BSP back into blood, presumably as a result of the defect in the MRP2 canalicular excretion of conjugated BSP.Citation110
These observations with OATP deficiency raise the question of how a genetic defect that seemingly limits transport of CB into the hepatocyte produce marked increases in serum CB. Van de Steeg et alCitation106 proposed that, in the mouse, 50% of the total CB produced by the liver normally cycles from the hepatocyte to the sinusoids and back to the hepatocyte before being secreted in bile. The very low plasma CB observed normally would require extremely efficient reuptake of this “regurgitated” CB by the OATP transporters. The knockout of OATP proteins prevents this reuptake, hence the elevated serum CB.
There are still many unanswered questions about this new observation. In particular, does this large and energetically demanding recycling have a biological value? Van de Steeg et alCitation106 hypothesize that it serves an important function by evenly distributing the excretory load of glucuronide conjugates to all hepatocytes via the sinusoidal plasma flow. They have coined the term “hepatocyte hopping”Citation106 to describe what they propose to be a general property of the hepatic handling of conjugated solutes. However, since UB is only 5% cleared in a single passage through the liver, all hepatocytes are exposed to essentially the same sinusoidal UB concentration and, assuming similar hepatocyte conjugating ability, similar concentrations of CB. Thus, it does not seem necessary to “distribute the load” of CB unless conjugation is preferentially performed by hepatocytes located in zone 1, in proximity to the inflow of blood into the sinusoid. Although entirely speculative, given that sinusoidal and canalicular flow are roughly in opposite directions, “hopping” could minimize the quantity of CB that must be transported against the increasing canalicular concentration of CB that occurs as canalicular bile flows from the hepatic vein region toward the portal area. It is also possible that this normal leak of bilirubin has no purpose and simply reflects an unavoidable leak of CB down the large electrochemical gradient that exists between the hepatocyte and blood (). For example, there are at least five organic anion transporters (OATs) localized in the sinusoidal cell membrane (OATPB1, OATPB3, OATP2B1, OAT2, and OAT7) that are involved in the liver uptake of a myriad of organic anions.Citation104 Since these transporters allow bidirectional transport,Citation104 CB could leak out through these systems.
Another potential pathway for this leak of CB from hepatocyte to blood is the hepatocyte efflux ABC transporter MRP3 (ABCC3) (). MRP3 transports glucuronidated xenobiotics from the liver to the plasma, where they are renally excreted. For example, in MRP3 knockout mice, the hepatic concentration of the glucuronidated metabolites of morphineCitation111 and acetaminophenCitation112 are markedly increased, while the plasma concentration is decreased by more than 90%. The relative importance of the renal versus the gastrointestinal excretory pathway for such compounds is determined by the relative activity of the sinusoidal (eg, MRP3) versus the canalicular (eg, MRP2) transporters. Bile duct ligation (see “Bilirubin enterohepatic circulation”) and the resultant block of the gastrointestinal pathway induces a dramatic increase in the expression of MRP3 in both rats and humans,Citation113,Citation114 presumably as a means of shifting the excretory pathway from the gut to the kidney. Direct evidence for the involvement of MRP3 in bilirubin recycling was provided by the observation that, in mice with a double knockout of OATP1B1 and OATP1B3, the additional knockout of MRP3 reduced plasma CB by 50%.Citation106
The involvement of OATs in bilirubin homeostasis introduces a profound change in the interpretation of the serum CB concentration, both in normal and pathological conditions. The rate of OATP clearance can be estimated from a calculation of the fraction of hepatic plasma flow that must be cleared of CB to maintain the normal human serum CB of 0.012 mg/dL () for a given rate of bilirubin recycling (R):
(7)
where Cin and Cout are the CB concentrations in the plasma entering and leaving the liver, respectively, and Flow is the liver plasma flow. Defining clearance as the dimensionless fraction of liver blood flow that is cleared (assuming that Cin is equal to the systemic serum CB):
(8)
A value for R can be estimated from measurements made in Rotor syndrome, assuming that these subjects have normal bilirubin kinetics with the exception of negligible hepatic uptake of CB from the plasma. The plasma CB concentration of these patients is maintained at about 5 mg/dL (), implying that, at steady state, about 25% of the 250 mg of daily production of bilirubin will be renally excreted (see “CB: albumin binding, renal excretion, covalent albumin binding, and clinical measurements”). Hence, R (the quantity of bilirubin refluxed in these subjects but recycled in normal subjects) equals 0.25×250 or 62 mg/day. Substituting this R in the above relation and assuming Cin equals the normal plasma CB concentration of 0.012 mg/dL and a normal human liver plasma flow (Flow) of 0.8 L/minute,Citation40 the normal human fractional CB clearance must be about 0.36 L/minute (45% of the liver plasma flow) and about seven times greater than the human liver UB clearance. This rapid hepatic uptake of CB is quantitatively consistent with direct measurements in the rat of both unlabeledCitation115 and tritiatedCitation116 CB clearance of about 1 mL/minute/100 g body weight, which is equivalent to a clearance of about 35% of the rat liver plasma flow and three times faster than the rat UB clearance.Citation116
The implications of this OATP CB clearance are illustrated in and . Previously, the very low normal plasma CB concentration of 0.012 mg/dL was assumed to result from a minimal leakage of CB from the hepatocyte and/or canaliculus into the plasma balanced by renal clearance:Citation6
(9)
Figure 5 Role of OATP in CB homeostasis in normal subjects with a serum CB concentration of 0.012 mg/dL.
Abbreviations: CB, conjugated bilirubin; UB, unconjugated bilirubin; UGT, uridine diphosphate glycosyltransferase.
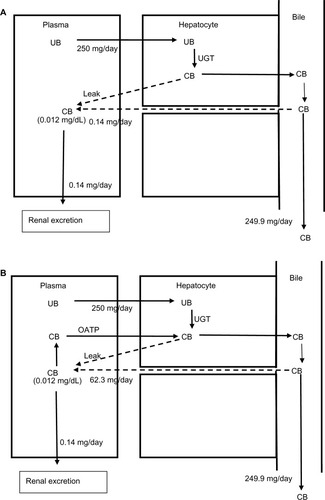
Figure 6 Role of OATP in CB homeostasis in a subject with hepatocellular disease and an elevated serum CB concentration of 0.36 mg/dL.
Abbreviations: CB, conjugated bilirubin; UB, unconjugated bilirubin; UGT, uridine diphosphate glycosyltransferase.

Using a renal clearance of 0.81 mL/minute (see “CB: albumin binding, renal excretion, covalent albumin binding, and clinical measurements”) and serum CB of 0.012 mg/dL () yields a leak of 0.14 mg/day (). This represents only 0.056% of the 250 mg CB excreted per day. In contrast, if there is normal OATP hepatic CB function, then the above relation should be replaced by:
(10)
For a serum CB =0.012 mg/dL and an OATP CB clearance of 0.36 L/minute, the leak must be 62.3 mg/day, or 25% of the daily production (). Uptake by OATP has even more dramatic implications for homeostasis in hepatocellular disease. For example, we will use a hypothetical patient with hepatocellular disease who has a modest serum CB elevation to 0.36 mg/dL (about 30 times normal), roughly equal to the normal serum UB concentration (). For the conventional interpretation (), where the CB leak is simply balanced by renal excretion, a leak of just 4.3 mg/day (1.7% of the daily 250 mg/day output) raises the serum CB to 0.36 mg/dL. In contrast (), if OATP CB clearance remains that of the normal liver (0.36 L/minute), the leak predicted using the above modified equation is 1,870 mg/day, or seven times the total daily UB production, which seems highly unlikely. Thus, it seems necessary to postulate that the OAT transport system ceases to function normally early in the course of conditions causing hepatocellular dysfunction. Such dysfunction could reflect OAT damage, saturation, or inability to transport against a gradient resulting from CB accumulation in the hepatocyte secondary to defects in the secretion of CB into the bile or in the canalicular transport of the secreted CB. While the specifics require further study, OAT function appears to be a major, but presently unappreciated, determinant of the serum CB concentration.
If the rates of CB influx and efflux are proportional to concentration, then, at steady state, hepatocyte CB should be directly proportional to the serum CB concentration. Furthermore, if the UB conjugation rate and CB bile export systems are also linear, then, for normal liver function, plasma CB should be proportional to the plasma UB concentration. This relationship provides an explanation for the surprising observation that serum CB tends to be a constant fraction (about 3%) of UB in both healthy and hemolyzing individuals (a fivefold range of UB []).Citation117 Even for the case of bile duct obstruction where most of the plasma CB comes from a leak of canalicular bile (see “Bilirubin enterohepatic circulation”), these influx and efflux transport systems should still establish this same steady-state hepatocyte/plasma concentration relationship.
Cholestasis and bile duct obstruction
outlines the events involved in the formation of bile. Bile salts are either synthesized in the hepatocyte or transported from the plasma to the hepatocyte by the sodium-taurocholate cotransporting polypeptide (NTCP/SLC10A1) and, to a lesser extent, by the sodium-independent OATs.Citation118,Citation119 The bile salts are then pumped into the canalicular space by the ATP-coupled bile salt export pump (BSEP/ABCB11), which is the key protein in bile formation.Citation120 The osmotic load of these bile salts along with a minor contribution from bilirubin and other glucuronides transported by the MRP pumps then draws in water and electrolytes. The relative importance of the cellular versus paracellular pathway (see ) for this osmotic water transport is unclear. In vitro measurements have shown that the hepatocyte cell membrane has a high osmotic water permeability – large enough that the relatively small solute gradients produced by bile salt secretion could account for the observed biliary flow rates.Citation121 The tight junctions between hepatocytes are cation selective, allowing free movement of Na+, and are impermeable to bile salts and glucuronides. However, these junctions allow passage of small nonelectrolytes such as erythritol, mannitol,Citation122 and sucrose,Citation123 suggesting that they are large enough to permit appreciable osmotic water flow during bile fluid formation.
Figure 7 Processes involved in bile formation and bilirubin secretion.
Abbreviations: CB, conjugated bilirubin; UB, unconjugated bilirubin; UGT, uridine diphosphate glycosyltransferase.
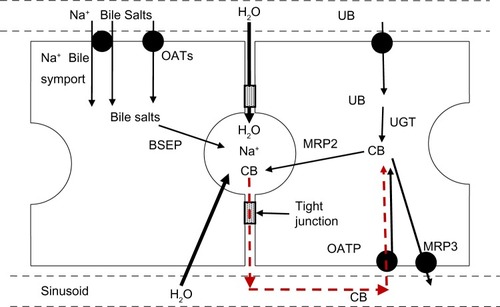
The initial event in mechanical bile duct obstruction is an increase in common duct pressure, which is transmitted back into the canaliculi of the liver. After bile duct ligation in dogs, the bile duct pressure increases from the normal value of 10 cm H2O to 40 cm H2O after 2 days and is then maintained at this value for up to 28 days.Citation124 Since this 40 cm hydrostatic pressure is equivalent to an osmotic pressure of only about 2 mOsm, it should not alter the osmotic bile formation rate. The most probable pathway for the leak of bile back into the systemic circulation is via the intercellular tight junctions (). This is directly supported by bile duct ligation studies showing histological changes in the hepatocyte tight junctions and leakage of horseradish peroxidase into the pericanalicular space.Citation125,Citation126 Since the bilirubin in bile is nearly 100% conjugated (see “Bilirubin transport from hepatocyte to bile”), initially this paracellular leak should increase only serum CB concentration. This is what was observed by Sieg et alCitation127 in 20 patients with acute obstruction due to common duct stones, in whom there was, on average, a 15-fold increase in TB, a 560-fold increase in CB, and no statistically significant increase in UB (see ).
In contrast to the findings in acute obstruction, there is also an increase in unconjugated plasma bilirubin in chronic obstruction, although most (usually >80% of the total) of the increase is in the conjugated form.Citation45,Citation128 This unconjugated increase presumably results, in part, from a loss of liver deconjugation function produced by the dramatic changes in liver histology, biochemistry, and cell death that occur after several days of obstruction.Citation129,Citation130
Hyperbilirubinemia is said to result from “intrahepatic cholestasis” when, in the absence of extrahepatic obstruction, CB comprises a high fraction of the TB, alkaline phosphatase is elevated out of proportion to other measurements of liver function (eg, aminotransferases), and bilirubin accumulations are noted in liver biopsies.Citation131 Unlike extrahepatic mechanical bile duct obstruction, which has a clearly defined pathology and good experimental models, the diverse heterogeneous conditions grouped under intrahepatic cholestasis are rather poorly understood and characterized. Intrahepatic cholestasis has multiple etiologies, including liver infections (viral, bacterial, and fungal), sepsis, autoimmune diseases, sarcoidosis, amyloidosis, lymphoma, heart failure,Citation132 and drug reactions (eg, antibiotics, anti-inflammatories, and oral contraceptives).Citation133 The elevation of CB may result from obstructed bile flow, altered bile ductular integrity, or reduced production of bile due to defective activity of the bile efflux transporters (eg, BSEP, MRPs []). The latter is thought to be the cause of cholestasis of pregnancy, a condition characterized by high serum bile acid concentrations and CB-predominant, mild hyperbilirubinemiaCitation134,Citation135 (). There is suggestive evidence that high estrogen and progesterone metabolite concentrations that develop in late pregnancy inhibit the bile acid transporters.Citation136
Bilirubin enterohepatic circulation
The black dashed line in refers to the enterohepatic circulation of bilirubin that is normally small but which may become important in some clinical situations. In the gut, nonabsorbable CB can be irreversibly degraded by bacteria to relatively impermeable urobilinoids or deconjugated by β-glucuronidase to highly membrane-permeable, absorbable UB (). At least 25% of orally administered 14C-labeled UB is absorbed in humans, while only a small percent of 14C-labeled CB is recycled.Citation137 Thus, under physiological conditions, catabolism to urobilinoids predominates. However, in some circumstances, deconjugation can apparently lead to recirculation of a substantial portion of bilirubin, appreciably increasing the bilirubin load to the liver.
Enterohepatic circulation has been proposed as a contributing factor to the physiologic jaundice of newborns. Vítek et alCitation138 found that fecal UB rose from a value of 169 nmol/g dry weight on day 1 after birth to a peak of 2,204 on day 5 and then, by 6 weeks, fell 15-fold as the colon was colonized by bacteria. In contrast, urobilinoids were not detectable until day 5 and then increased tenfold over the following 6 weeks.Citation138 Thus, the bacterial flora of the newborn favors the deconjugation of CB to UB over urobilinoid production with a resultant increase in the enterohepatic circulation of UB. The origin of this β-glucuronidase activity present in infant feces could be bacterial, intestinal, or the mother’s milk, with the last thought to play a role in breast milk jaundice.Citation139 A study involving feeding of agar to newborns provides direct support for the concept that the intraluminal milieu plays a role in UB homeostasis.Citation140 In untreated infants, the normal “physiologic” serum bilirubin increase was observed, peaking on day 4 at a value 83% higher than on day 1, while, in agar-treated infants, serum bilirubin fell continuously after birth to a value on day 6 that was 45% less than on day 1. Correspondingly, the total fecal bilirubin excretion in the agar-treated infants was about three times greater than that of the untreated over the first 5 days after birth. Presumably, by an unknown mechanism, agar inhibits deconjugation of CB with a resultant decrease in absorption of UB.
Enterohepatic circulation has also been invoked as a possible causative factor for “fasting hyperbilirubinemia”. Serum UB increases 80% from a mean of 0.5 to 0.9 mg/dL in normal subjects after a 48-hour fast (300 kcal provided).Citation141 The increase is more dramatic in Gilbert’s syndrome, increasing from 1.5 to 3.5 mg/dL (130%), and fasting is used as a diagnostic test for this syndrome.Citation141 Despite considerable study, this response to fasting remains a poorly understood phenomenon. Based on CO measurements, it was initially proposed that fasting increases heme catabolism,Citation142 but this observation was not confirmed in a subsequent study.Citation143 A second postulate was that caloric deprivation decreases hepatic glucuronidation activity. However, fasting-induced elevation of serum UB in Gilbert’s subjects was not prevented by an intravenous infusion of either glucose or lipid with the same caloric load (2,400 kcal) as in the standard oral diet.Citation144 The most recent hypothesis is that fasting slows small intestinal transit, allowing more time for the conversion of CB to UB in the small intestine.Citation145–Citation147 The correspondingly larger increase in Gilbert’s subjects could reflect partial saturation of the defective hepatic UB deconjugation system due to the recirculated load. An alternative explanation is that the fraction of monoconjugated bilirubin in the bile of Gilbert’s subjects (94%) is higher than that of normal subjects (37%),Citation57 thus the CB of Gilbert’s is more readily deconjugated in the gut to UB. However, quantitative considerations cast doubt on the concept that increased enterohepatic circulation could account for the entire 80% increase in serum bilirubin observed in fasting normal subjects. Assuming the steady state is reached after 2 days of fasting and hepatic bilirubin secretion is first order, the 80% increase requires that at least 45% of the secreted bilirubin be recirculated. Thus, the hypothesis that fasting hyperbilirubinemia is attributable to an increased enterohepatic circulation requires an enormous alteration in the gut metabolism of CB, with a shift from the normal, near-complete bacterial conversion to urobilinoids to a situation where there is at least 45% deconjugation (and absorption) of CB in the gut. This seems unlikely, since only 25% of ingested 14C-labeled UB was absorbed by healthy subjects.Citation137
Recirculation has also been postulated to explain other observations, such as a nearly twofold increase in total biliary secretion of bilirubin produced by ileal resection in the rat,Citation148 requiring an unlikely scenario in which about 50% of secreted CB was recirculated. Similarly, a statistically significant 30% increase in serum UB observed with oral chenodeoxycholic acid in humans was attributed to a solubilizing effect that allowed increased enterohepatic circulation of UB.Citation149 If increased absorption of bilirubin can truly reach 30%–50% of the secreted bilirubin, this process would have important implications for the interpretation of serum bilirubin measurements.
Summary and clinical implications
The regulation of serum bilirubin concentration is far more complex than that of other serum analytes used to assess organ function. For example, serum creatinine concentration is determined by glomerular filtration rate and serum amino transferases by the rate of hepatocellular release of the enzymes. In contrast, bilirubin homeostasis is a complex process involving multiple organs, enzyme reactions, and membrane transport systems. Total serum bilirubin represents the sum of the concentrations of UB and CB, each of which has its own homeostatic regulation (). The steady-state concentration of each form of bilirubin is established when its plasma concentration reaches a level that permits plasma removal at a rate equal to its delivery to the plasma. A variety of factors limit both the sensitivity and the specificity of bilirubin measurements to detect the abnormalities illustrated in and listed in .
Serum bilirubin is commonly assessed as part of routine physical examinations as well in the evaluation of virtually all sick patients. The primary purpose of these measurements is to determine if: 1) the total serum bilirubin is elevated, which (in the absence of an increased bilirubin load) is indicative of liver malfunction; 2) the bilirubin elevation results from an isolated increase of UB, which is indicative of an increased bilirubin load (hemolysis or increased enterohepatic circulation), or from a genetically acquired conjugating defect; 3) the bilirubin elevation reflects a predominance (>70%) of CB, which suggests cholestatic (as opposed to hepatocellular) liver disease; or 4) the UB and CB are roughly equal, a finding suggestive of hepatocellular disease.
What constitutes a normal diazo total serum bilirubin concentration varies by laboratory, with normal values commonly considered to range from a low of 0.1 mg/dL to a high of 1–1.2 mg/dL (). In the very large Third National Health and Nutrition Examination Survey (NHANES III) study of 16,865 randomly selected US adults, the 2.5 and 97.5 percentile values for TB using the standard diazo assay were 0.2 mg/dL and 1.4 mg/dL, respectively.Citation150 While the modal value was 0.4 mg/dL, there was a marked skewing toward higher values, with the mean value being 0.62 mg/dL. The authors attributed this relatively high normal range to their subjects’ fasting state, a confounding factor known to increase serum UB in both normal subjects and subjects with Gilbert’s syndrome (see “Bilirubin enterohepatic circulation”). While the TB was not fractionated in this study, UB commonly represents the vast majority of the bilirubin of healthy subjects. The tendency of the data to skew toward higher values is commonly attributed to subjects with reduced activity of UGT1A1, ie, subjects with Gilbert’s syndrome. The frequency of Gilbert’s in the healthy population has been variously cited to range from 5% to 15% of the population. However, the possible role of an increased bilirubin load due to decreases in RBC survival, increased cytochrome turnover, or increased UB absorption from the gut has not been excluded as a contributory factor toward the unusually high UB observed in some apparently healthy subjects.
The high frequency of Gilbert’s in the general population appreciably reduces the sensitivity of TB as an indicator of liver malfunction. For example, if a patient with a baseline modal TB value of 0.4 mg/dL developed a cholestatic problem, CB must increase from the true, chromatographic (HPLC) normal value of about 0.012 mg/dL to 1.0 mg/dL simply to reach the TB upper limit of normal of 1.4 mg/dL, roughly an 80-fold increase in CB. While routine HPLC measurement of CB could be a more sensitive indicator of liver dysfunction than the presently employed diazo technique, minor increases in CB might be so nonspecific as to confuse rather than enhance clinical management of patients.
The wide normal variability of UB concentration also limits the value of this measurement as a means of identifying the presence of low-to-moderately severe hemolysis. Roughly 75% of the bilirubin load (about 0.3 mg/dL of the modal 0.4 mg/dL in normal serum) is derived from breakdown of circulating erythrocytes. Thus, in a non-anemic subject, the survival of RBCs (normally 120 days) would have to be reduced by about 3.7-fold, to 32 days, to elevate the CB concentration to 1.4 mg/dL. When employed to identify hemolysis in a subject with anemia, RBC survival has to be even more deranged to elevate CB above the upper limit of normal, eg, in a subject with a hemoglobin of 7 g/dL (50% reduction from the normal 14 g/dL), RBC survival would have to be reduced by roughly 7.4-fold (to 16 days) in order to produce a detectable increase in UB.
Hyperbilirubinemia results from disorders of one or more of the metabolic steps outlined in . Measurements of CB and UB in hyperbilirubinemia provide direction for additional diagnostic tests but almost never provide sufficient information with which to identify the specific disorder(s) causing the problem. A marked predominance (>80%) of UB in hyperbilirubinemia is indicative of a major increase in the bilirubin load (eg, hemolysis), a conjugating defect (eg, Gilbert’s or Crigler–Najjar syndromes), or, possibly, increased enterohepatic circulation of UB. While bilirubin production could be estimated via measurements of CO excretion, such testing is not clinically available. Thus, an increased bilirubin load is commonly imputed from results of indirect indicators of hemolysis (blood smear, haptoglobin, reticulocyte count, and lactate dehydrogenase) in the anemic patient. UB derived from liver enzymes or absorption following deconjugation of CB in the gut remain potential sources of UB that cannot be quantitated using available tests. With an increased bilirubin load (eg, hemolysis), both UB and CB (measured via HPLC) increase in direct proportion to the total load. However, as discussed in the section “CB transport from hepatocyte to blood”, this relatively small CB increase from normal (eg, up to eightfold) is not detectable with the diazo CB assay because of background contaminants. If patients also have an increased CB concentration due to underlying liver disease, then this superimposed increased bilirubin load would produce appreciable increases in CB that are measurable with the diazo reaction. In the absence of hemolysis, UB-predominant hyperbilirubinemia is assumed to reflect decreased CB conjugation (ie UGT1A1 deficiency): Gilbert’s when the UB is <3 mg/dL and Crigler–Najjar when the UB is >3 mg/dL.
A marked predominance (.70%) of CB in hyperbilirubinemia is strongly suggestive of cholestasis secondary to extrahepatic or intrahepatic disease ( [last six entries]). Extrahepatic obstruction to bile flow is usually caused by gallstones, malignancy, or benign strictures. The resultant increased pressure in the biliary system produces reflux of CB into the plasma. Intrahepatic cholestasis can be caused by obstruction to bile flow in the liver (primary biliary cirrhosis or hepatic mass lesions), lack of integrity of the biliary canaliculi, or decreased bulk secretion of bile secondary to drugs or other conditions (possibly sepsis) that diminish the bile acid secretion that drives bile flow. In addition, rare congenital defects that reduce transport of CB into the canaliculus (Dubin–Johnson) or reduce uptake of CB from the blood (Rotor) can produce CB-predominant hyperbilirubinemia. Measurements of bilirubin or other liver function tests seldom identify the etiology of predominant conjugated hyperbilirubinemia, and evaluation with endoscopic, radiographic, serology, or biopsy procedures are required to pinpoint the specific problem.
When there is not a predominance of either UB or CB, hyperbilirubinemia is usually the result of what is termed a “hepatocellular” problem, such as various forms of hepatitis or cirrhosis (). The seemingly simple observation that UB and CB maintain roughly comparable serum concentrations in hepatocellular disease actually requires the interplay of several unusual phenomena that have received little or no attention in the literature. First, CB must rise by about 30-fold simply to reach the normal serum concentration of UB (0.4 mg/dL). What mechanism could be so disordered in relatively mild hepatocellular dysfunction that normal CB clearance is diminished by 30-fold? Such an alteration from normal function is virtually unknown with any other organ system. Second, some linkage between CB and UB clearance would be necessary to maintain these compounds at relatively similar concentrations over wide ranges of bilirubin concentrations in a variety of hepatocellular disease.
As discussed in the section “CB transport from hepatocyte to blood”, the implications of the recent observation of a large OATP-mediated CB recirculation and clearance of about 0.36 L/minute profoundly alters the interpretation of the increased serum CB observed in these diseases. If this OATP clearance remains at its normal value, then just a moderate increase in serum CB (eg, 0.36 mg/dL []) implies that there would have to be an enormous CB leak of 1,870 mg (seven times the total daily UB production). Thus, it is seemingly impossible for CB to rise to the concentrations observed in hepatocellular disease if OATP function remains largely intact. While totally speculative, it seems necessary to postulate that defects in OATP function occur early in the course of hepatocellular disease. Such defects would permit relatively enormous increases in serum CB due simply to the failure to recycle the normal leak of bilirubin from hepatocyte to plasma (which would be aggravated by additional leakage in liver disease). The primary role of bilirubin recycling in the maintenance of serum CB concentration has not been previously recognized and obviously requires further study.
The second “mystery” of serum bilirubin concentrations in hepatocellular disease is the maintenance of roughly similar serum concentrations of CB and UB, despite the fact that these compounds are controlled by very different homeostatic mechanisms. It should be stressed that when CB and UB have similar serum concentrations, there has been a 30-fold increase over normal for CB relative to the increase for UB. Thus, the similar serum levels of the two forms of bilirubin in hepatocellular diseases requires that CB:UB clearances be reduced in a constant ratio of roughly 30:1. It seems highly unlikely that tissue damage would be consistently around 30-fold more injurious to the normal CB excretory mechanism than it is to UB excretion; rather, it seems likely that the clearance of the two types of bilirubin is linked by some factor wherein the rise of one bilirubin species feeds back on the clearance of the other. There is no evidence that an elevated UB concentration inhibits the excretion of CB, since CB remains normal in hemolytic states or Gilbert’s syndrome. In contrast, an elevated CB seems to inhibit UB conjugation, since, in the conjugated hyperbilirubinemias in (last six entries), UB rises, albeit not in proportion to CB. One possible explanation for this CB inhibition of conjugation is competitive inhibition of the UGT1A1 enzyme by increased hepatocyte CB. As discussed in the section “Bilirubin glucuronidation and UB excretion”, both the mono- and diglucuronides of bilirubin are competitive inhibitors of UGT1A1. The hepatocyte influx and efflux transporters should maintain a proportional cell/plasma concentration ratio (see “CB transport from hepatocyte to blood”) and, for example, in Dubin–Johnson syndrome, the 200-fold increase in serum CB would correspond to a 200-fold increase in hepatocyte CB, which could competitively decrease the glucuronidation rate and produce the observed fourfold increase in serum UB.
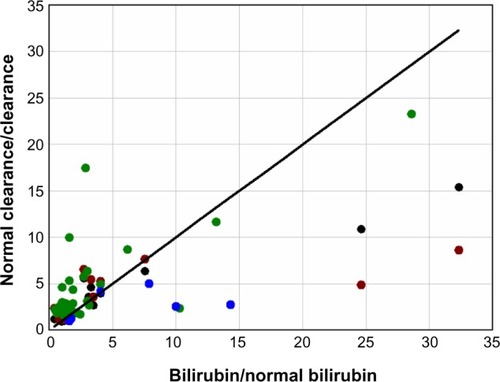
There are two other factors that could contribute to the concomitant elevation of serum UB and CB in hepatocellular diseases. The first is the superimposition of an increased bilirubin load. For example, about one-third of the tenfold UB increase observed in alcoholic cirrhosis () could be explained by the two- to threefold increase in bilirubin load secondary to diminished RBC survival in cirrhosis.Citation151 The second is a reduction in the mass of functioning liver as a result of scarring and cell death. It would be valuable to be able to determine what component of the increase in TB is due simply to a loss of general liver function, since it would provide a quantitative measure of the extent of liver damage (for example, a tenfold increase in TB would indicate a 90% loss of liver function). One approach to quantitating liver function is to measure the hepatic clearance of drugs such as indocyanine green,Citation152 sulfobromophthalein,Citation152 antipyrine,Citation153 or aminopyrine.Citation154 The clearance of all four of these compounds is reduced by an average factor of three or more in alcoholic cirrhosis,Citation152–Citation154 which, if they are an indication of liver cell loss, should produce a threefold increase of TB. To the extent that bilirubin clearance is influenced by the same general lack of functional liver that reduces the clearance of these test compounds, there should be a relatively linear relationship between the fractional increase in TB and the inverse of the fractional decrease in the hepatic drug clearance. shows this plot for the clearance of these four different compounds in patients with chronic alcoholic cirrhosis. Although there is considerable scatter, this relationship is roughly confirmed, with about 50% of the increase in TB explained by a general decrease in liver function, with the other 50% possibly produced by some other liver malfunction that might also account for the 30-fold increase in CB relative to UB.
Figure 8 Plot of the fractional increase in total serum bilirubin (bilirubin/normal bilirubin) versus the inverse of the fractional decrease in the hepatic clearance (normal clearance/clearance) of indocyanine green (black), sulfobromophthalein (red), aminopyrine (green), and antipyrine (blue) in patients with chronic alcoholic cirrhosis.
The precise serum bilirubin concentration is one of the measurements commonly employed for the calculation of “scores” that predict the prognosis and direct therapeutic interventions in patients with liver disease (eg, MELD, Child– Pugh, Maddrey, and FibroTest). The use of and weighting of the TB measurement in these calculations is based on empirical observation that an increase in total serum bilirubin is one of the strongest correlates with poor patient outcome in hepatocellular disease.Citation155 While it seems intuitively obvious that the serum bilirubin level would serve as a marker of the degree of liver dysfunction, several factors not directly related to liver function may have a sizable effect on the serum bilirubin concentration. For example, both UB and CB will vary directly with the bilirubin load. Hence, RBC life span that is frequently, but variably, reduced in severe liver disease could induce several-fold differences in serum bilirubin concentrations of patients with equal abilities to clear bilirubin. Similarly, variations in enterohepatic circulation of bilirubin could influence serum bilirubin concentrations. Lastly, the presence of δ-bilirubin influences the serum concentration of CB by a mechanism independent of liver function. Thus, it seems possible that bilirubin measurements corrected for bilirubin load and δ-bilirubin would serve as a more precise measure of liver function and, possibly, a more accurate indicator of prognosis.
This positive correlation between the degree of hyperbilirubinemia and prognosis of liver disease patients is expected. More surprising are the repeated observations of an inverse correlation between serum bilirubin concentrations and a variety of potentially lethal conditions in subjects who do not have liver disease. Higher bilirubin levels have been associated with a decreased incidence of coronary disease, rectal cancer, and diabetes.Citation150,Citation156 In a large life insurance study of apparently healthy males less than 60 years of age, mortality over a 10- to 14-year period was about 2.6 times higher for subjects with a serum bilirubin of 0.3 mg/dL versus a bilirubin of 1.1–1.3 mg/dL.Citation157
It will be important to determine if lower serum bilirubin concentrations are a cause or an effect of ill health. As discussed in the current review, the serum bilirubin of patients without liver disease is virtually all UB, and the serum level of this compound is a function of the bilirubin load, albumin binding, and the activity of UGT1A1. It seems unlikely that low bilirubin concentrations are a result of decreased UB production, since this would require a substantial increase in RBC life span. As discussed in the section “Bilirubin glucuronidation and UB excretion”, serum UB is inversely proportional to the albumin dissociation constant, as exemplified by patients on hemodialysis who have serum UB concentrations that are 25% of normal because of decreased albumin binding of UB. It seems possible that some yet-to-be-identified factor associated with ill health could decrease the binding of UB to albumin. It is also possible that such an unknown factor might enhance UGT1A1 activity. In these hypothetical cases, low UB would simply be a marker of the propensity to develop disease. More interesting would be the situation in which high serum UB is protective against various diseases, possibly via its antioxidant effect. Such a protective effect would provide a biological rationale for the complicated handling of UB that ensures appreciable (μM) serum concentrations of this compound. Research on bilirubin, a relatively dormant area of investigation at present, would be greatly invigorated if UB could be shown to protect against important diseases and reduce mortality.
Disclosure
The authors report no conflicts of interest in this work.
References
- PapavramidouNFeeEChristopoulou-AletraHJaundice in the Hippocratic CorpusJ Gastrointest Surg200711121728173117896166
- van den BerghAAHMullerPÜber eine direkte und eine indirekte Diazoreaktion auf Bilirubin [About a direct and an indirect diazo reaction to bilirubin]Biochem Z19167790103 German
- BilllingBHColePGLatheGHThe excretion of bilirubin as a diglucuronide giving the direct van den Bergh reactionBiochem J195765477478413426100
- TalafantEProperties and composition of the bile pigment giving a direct diazo reactionNature1956178452831213358729
- BlanckaertNFeveryJPhysiology and pathophysiology of bilirubin metabolismZakimDBoyerTDHepatology: A Textbook of Liver Disease12nd edPhiladelphia, PAWB Saunders1990254302
- Roy-ChowdhuryJRoy-ChowdhuryNBilirubin metabolism and its disordersBoyerTDMannsMPSanyalAJZakimDZakim and Boyer’s Hepatology: A Textbook of Liver Disease6th edPhiladelphia, PASaunders Elsevier201210791109
- MitlyngBLChandrashekharYFurneJKLevittMDUse of breath carbon monoxide to measure the influence of prosthetic heart valves on erythrocyte survivalAm J Cardiol20069791374137616635614
- MitlyngBLSinghJAFurneJKRuddyJLevittMDUse of breath carbon monoxide measurements to assess erythrocyte survival in subjects with chronic diseasesAm J Hematol200681643243816680757
- CalabreseVMancusoCCalvaniMRizzarelliEButterfieldDAStellaAMNitric oxide in the central nervous system: neuroprotection versus neurotoxicityNat Rev Neurosci200781076677517882254
- MancusoCNavarraPPreziosiPRoles of nitric oxide, carbon monoxide, and hydrogen sulfide in the regulation of the hypothalamic-pituitary-adrenal axisJ Neurochem2010113356357520089135
- RochetteLCottinYZellerMVergelyCCarbon monoxide: mechanisms of action and potential clinical implicationsPharmacol Ther2013137213315223026155
- VítekLSchwertnerHAThe heme catabolic pathway and its protective effects on oxidative stress-mediated diseasesAdv Clin Chem20074315717249379
- StockerRYamamotoYMcDonaghAFGlazerANAmesBNBilirubin is an antioxidant of possible physiological importanceScience19872354792104310463029864
- MancusoCBaroneEThe heme oxygenase/biliverdin reductase pathway in drug research and developmentCurr Drug Metab200910657959419702533
- GibbsPETudorCMainesMDBiliverdin reductase: more than a namesake – the reductase, its Peptide fragments, and biliverdin regulate activity of the three classes of protein kinase CFront Pharmacol201233122419908
- BarananoDERaoMFerrisCDSnyderSHBiliverdin reductase: a major physiologic cytoprotectantProc Natl Acad Sci U S A20029925160931609812456881
- MaghzalGJLeckMCCollinsonELiCStockerRLimited role for the bilirubin-biliverdin redox amplification cycle in the cellular antioxidant protection by biliverdin reductaseJ Biol Chem200928443292512925919690164
- McDonaghAFThe biliverdin-bilirubin antioxidant cycle of cellular protection: missing a wheel?Free Radic Biol Med201049581482020547221
- BaroneETrombinoSCassanoRCharacterization of the S-denitrosylating activity of bilirubinJ Cell Mol Med2009138B2365237520141617
- MancusoCBonsignoreACaponeCDi StasioEPaniGAlbumin-bound bilirubin interacts with nitric oxide by a redox mechanismAntioxid Redox Signal200683–448749416677092
- MinettiMMallozziCDi StasiAMPietraforteDBilirubin is an effective antioxidant of peroxynitrite-mediated protein oxidation in human blood plasmaArch Biochem Biophys199835221651749587403
- GhemCSarmento-LeiteREde QuadrosASRossettoSGottschallCASerum bilirubin concentration in patients with an established coronary artery diseaseInt Heart J2010512869120379040
- TellGGustincichSRedox state, oxidative stress, and molecular mechanisms of protective and toxic effects of bilirubin on cellsCurr Pharm Des200915252908291419754367
- TurfanMDuranMPoyrazFInverse relationship between serum total bilirubin levels and severity of disease in patients with stable coronary artery diseaseCoron Artery Dis2013241293223232249
- VítekLJirsaMBrodanováMGilbert syndrome and ischemic heart disease: a protective effect of elevated bilirubin levelsAtherosclerosis2002160244945611849670
- BonnettRDaviesJEHursthouseMBSheldrickGMThe structure of bilirubinProc R Soc Lond B Biol Sci1978202114724926828528
- BrodersenRSternLBinding of bilirubin to albuminCrit Rev Clin Lab Sci1980114305399
- HahmJSOstrowJDMukerjeePCelicLIonization and self-association of unconjugated bilirubin, determined by rapid solvent partition from chloroform, with further studies of bilirubin solubilityJ Lipid Res1992338112311371431594
- WennbergRPThe blood-brain barrier and bilirubin encephalopathyCell Mol Neurobiol20002019710910690504
- ZuckerSDGoesslingWHoppinAGUnconjugated bilirubin exhibits spontaneous diffusion through model lipid bilayers and native hepatocyte membranesJ Biol Chem199927416108521086210196162
- LevittDGThe pharmacokinetics of the interstitial space in humansBMC Clin Pharmacol20033312890292
- SimonsPCJagtDLBilirubin binding to human liver ligandin (glutathione S-transferase)J Biol Chem198025510474047447372607
- ScheidtPCMellitsEDHardyJBDrageJSBoggsTRToxicity to bilirubin in neonates: infant development during first year in relation to maximum neonatal serum bilirubin concentrationJ Pediatr1977912292297874689
- CriglerJFJrNajjarVACongenital familiar nonhemolyltic jaundice with kernicterusPediatrics19521016918012983120
- WatchkoJFKernicterus and the molecular mechanisms of bilirubin-induced CNS injury in newbornsNeuromolecular Med20068451352917028373
- MancusoCCaponeCRanieriSCBilirubin as an endogenous modulator of neurotrophin redox signalingJ Neurosci Res200886102235224918338802
- Kragh-HansenUMolecular aspects of ligand binding to serum albuminPharmacol Rev198133117537027277
- BerkPDHoweRBBloomerJRBerlinNIStudies of bilirubin kinetics in normal adultsJ Clin Invest19694811217621905824077
- LevittDGPKQuest: capillary permeability limitation and plasma protein binding – application to human inulin, dicloxacillin and ceftriaxone pharmacokineticsBMC Clin Pharmacol20022712323078
- LevittDGPKQuest_Java: free, interactive physiologically based pharmacokinetic software package and tutorialBMC Res Notes2009215819656378
- BlanckaertNHeirweghKPMAnalysis and preparation of bilirubins and biliverdinsOstrowJDBile Pigments and JaundiceNew York, NYMarcel Dekker, Inc19863179
- Pieper-BigelowCEckfeldtJLevittMDSensitivity of HPLC and conventional bilirubin measurements in the detection of early cholestasisJ Lab Clin Med199512556546617738430
- DoumasBTWuTWThe measurement of bilirubin fractions in serumCrit Rev Clin Lab Sci1991285–64154451772588
- DuttMKMurphyGMThompsonRPUnconjugated bilirubin in human bile: the nucleating factor in cholesterol cholelithiasis?J Clin Pathol200356859659812890809
- FulopMSandsonJBrazeauPDialyzability, protein binding, and renal excretion of plasma conjugated bilirubinJ Clin Invest19654466668014278182
- CameronJLStaffordESSchnauferLIberFLBilirubin excretion in the dogJ Surg Res19633394214018043
- FulopMBrazeauPImpaired renal function exaggerates hyperbilirubinemia in bile duct-ligated dogsAm J Dig Dis19701512106710725486192
- CameronJLFillerRMIberFLAbeiTRandolphJGMetabolism and excretion of C14-labeled bilirubin in children with biliary atresiaN Engl J Med196627452312365902217
- WeissJSGautamALauffJJThe clinical importance of a protein-bound fraction of serum bilirubin in patients with hyperbilirubinemiaN Engl J Med198330931471506866015
- BeekenWLVolwilerWGoldsworthyPDStudies of I-131-albumin catabolism and distribution in normal young male adultsJ Clin Invest1962411312133313866511
- FeveryJBilirubin in clinical practice: a reviewLiver Int200828559260518433389
- HardmanJGLimbirdLEGoodman and Gilman’s The Pharmacological Basis of Therapeutics10th edNew York, NYMcGraw Hill2001
- GuillemetteCLévesqueEHarveyMBellemareJMenardVUGT genomic diversity: beyond gene duplicationDrug Metab Rev2010421244419857043
- BockKWFunctions and transcriptional regulation of adult human hepatic UDP-glucuronosyl-transferases (UGTs): mechanisms responsible for interindividual variation of UGT levelsBiochem Pharmacol201080677177720457141
- BurchellBBlanckaertNBilirubin mono- and di-glucuronide formation by purified rat liver microsomal bilirubin UDP-glucuronyltransferaseBiochem J198422324614656497857
- SkierkaJMKotzerKELagerstedtSAO’KaneDJBaudhuinLMUGT1A1 genetic analysis as a diagnostic aid for individuals with unconjugated hyperbilirubinemiaJ Pediatr2013162611461152, 1152. e1–e223290513
- FeveryJBlanckaertNHeirweghKPPréauxAMBerthelotPUnconjugated bilirubin and an increased proportion of bilirubin monoconjugates in the bile of patients with Gilbert’s syndrome and Crigler-Najjar diseaseJ Clin Invest1977605970979409736
- McDonaghAFControversies in bilirubin biochemistry and their clinical relevanceSemin Fetal Neonatal Med201015314114719932645
- WangPKimRBChowdhuryJRWolkoffAWThe human organic anion transport protein SLC21A6 is not sufficient for bilirubin transportJ Biol Chem200327823206952069912670950
- WhiteJKGerdinAKKarpNAGenome-wide generation and systematic phenotyping of knockout mice reveals new roles for many genesCell2013154245246423870131
- IgaTEatonDLKlaassenCDUptake of unconjugated bilirubin by isolated rat hepatocytesAm J Physiol19792361C9C14434143
- BlackMBillingBHHepatic bilirubin udp-glucuronyl transferase activity in liver disease and gilbert’s syndromeN Engl J Med196928023126612715770050
- ChowdhuryJRChowdhuryNRWuGShouvalRAriasIMBilirubin mono- and diglucuronide formation by human liver in vitro: assay by high-pressure liquid chromatographyHepatology1981166226276796486
- ZhouJTracyTSRemmelRPBilirubin glucuronidation revisited: proper assay conditions to estimate enzyme kinetics with recombinant UGT1A1Drug Metab Dispos201038111907191120668247
- CroneCThe permeability of capillaries in various organs as determined by use of the ‘indicator diffusion’ methodActa Physiol Scand19635829230514078649
- ZelenkaJLenícekMMuchováLHighly sensitive method for quantitative determination of bilirubin in biological fluids and tissuesJ Chromatogr B Analyt Technol Biomed Life Sci200886713742
- MuchovaLVanovaKZelenkaJBile acids decrease intracellular bilirubin levels in the cholestatic liver: implications for bile acid-mediated oxidative stressJ Cell Mol Med20111551156116520518850
- WolkoffAWKetleyJNWaggonerJGBerkPDJakobyWBHepatic accumulation and intracellular binding of conjugated bilirubinJ Clin Invest1978611142149618909
- WolkoffAWGoreskyCASellinJGatmaitanZAriasIMRole of ligandin in transfer of bilirubin from plasma into liverAm J Physiol19792366E638E648375751
- OieSLevyGEffect of salicylic acid on pharmacokinetics of free and plasma protein-bound bilirubin in experimental unconjugated hyperbilirubinemiaJ Pharm Sci197968116758439
- OieSLevyGEffect of sulfisoxazole on pharmacokinetics of free and plasma protein-bound bilirubin in experimental unconjugated hyperbilirubinemiaJ Pharm Sci197968169758466
- FukuiMTanakaMYamazakiMLow serum bilirubin concentration in haemodialysis patients with Type 2 diabetesDiabet Med2011281969921210542
- TsutsumiYMaruyamaTTakadateAShimadaHOtagiriMDecreased bilirubin-binding capacity in uremic serum caused by an accumulation of furan dicarboxylic acidNephron2000851606410773757
- OieSLowenthalDTLevyGProtein binding of bilirubin in plasma of anephric patientsJ Dial198042–3911007440847
- TsutsumiYMaruyamaTTakadateAGotoMMatsunagaHOtagiriMInteraction between two dicarboxylate endogenous substances, bilirubin and an uremic toxin, 3-carboxy-4-methyl-5-propyl-2-furanpropanoic acid, on human serum albuminPharm Res199916691692310397614
- WeisigerRADissociation from albumin: a potentially rate-limiting step in the clearance of substances by the liverProc Natl Acad Sci U S A1985825156315673856281
- SorichMJSmithPAMcKinnonRAMinersJOPharmacophore and quantitative structure activity relationship modelling of UDP-glucuronosyltransferase 1A1 (UGT1A1) substratesPharmacogenetics200212863564512439224
- KuehlGELampeJWPotterJDBiglerJGlucuronidation of nonsteroidal anti-inflammatory drugs: identifying the enzymes responsible in human liver microsomesDrug Metab Dispos20053371027103515843492
- ZuckerSDQinXRousterSDMechanism of indinavir-induced hyperbilirubinemiaProc Natl Acad Sci U S A20019822126711267611606755
- CrawfordJMRansilBJNarcisoJPGollanJLHepatic microsomal bilirubin UDP-glucuronosyltransferase. The kinetics of bilirubin mono- and diglucuronide synthesisJ Biol Chem19922672416943169501512236
- SchmidRHammakerLMetabolism and disposition of C14-bilirubin in congenital nonhemolytic jaundiceJ Clin Invest1963421720173414083163
- KotalPVan der VeereCNSinaasappelMIntestinal excretion of unconjugated bilirubin in man and rats with inherited unconjugated hyperbilirubinemiaPediatr Res19974221952009262222
- GordonERShafferEASass-KortsakABilirubin secretion and conjujation in the Crigler-Najjar syndrome type IIGastroenterology1976705 PT.17617651261771
- SinaasappelMJansenPLThe differential diagnosis of Crigler-Najjar disease, types 1 and 2, by bile pigment analysisGastroenterology199110037837891993500
- HafkampAMHavingaROstrowJDNovel kinetic insights into treatment of unconjugated hyperbilirubinemia: phototherapy and orlistat treatment in Gunn ratsPediatr Res2006594 Pt 150651216549520
- Van Der VeereCNSchoemakerBBakkerCVan Der MeerRJansenPLElferinkRPInfluence of dietary calcium phosphate on the disposition of bilirubin in rats with unconjugated hyperbilirubinemiaHepatology19962436206268781334
- Van der VeereCNJansenPLSinaasappelMOral calcium phosphate: a new therapy for Crigler-Najjar disease?Gastroenterology199711224554629024299
- LevittDGQuantitation of small intestinal permeability during normal human drug absorptionBMC Pharmacol Toxicol2013143423800230
- IharaHHashizumeNShimizuNAokiTThreshold concentration of unbound bilirubin to induce neurological deficits in a patient with type I Crigler-Najjar syndromeAnn Clin Biochem199936Pt 334735210376077
- BlaschkeTFBerkPDScharschmidtBFGuytherJRVergallaJMWaggonerJGCrigler-Najjar syndrome: an unusual course with development of neurologic damage at age eighteenPediatr Res1974855735904825526
- ChalasaniNChowdhuryNRChowdhuryJRBoyerTDKernicterus in an adult who is heterozygous for Crigler-Najjar syndrome and homozygous for Gilbert-type genetic defectGastroenterology19971126209921039178703
- JansenPLDiagnosis and management of Crigler-Najjar syndromeEur J Pediatr1999158Suppl 2S89S9410603107
- NiesATKepplerDThe apical conjugate efflux pump ABCC2 (MRP2)Pflugers Arch2007453564365916847695
- JemnitzKHeredi-SzaboKJanossyJIojaEVereczkeyLKrajcsiPABCC2/Abcc2: a multispecific transporter with dominant excretory functionsDrug Metab Rev201042340243620082599
- OyabuHTabataMNakayamaFNonbacterial transformation of bilirubin in bileDig Dis Sci19873288098163608728
- DuvaldestinPMahuJLMetreauJMArondelJPreauxAMBerthelotPPossible role of a defect in hepatic bilirubin glucuronidation in the initiation of cholesterol gallstonesGut19802186506556253364
- TrotmanBWOstrowJDSolowayRDPigment vs cholesterol cholelithiasis: comparison of stone and bile compositionAm J Dig Dis19741975855904835328
- PaulusmaCCKoolMBosmaPJA mutation in the human canalicular multispecific organic anion transporter gene causes the Dubin-Johnson syndromeHepatology1997256153915429185779
- ShaniMSeligsohnUGilonESherbaCAdamADubin-Johnson syndrome in Israel. I. Clinical, laboratory, and genetic aspects of 101 casesQ J Med1970395495675532959
- VerkadeHJHavingaRGerdingAVonkRJKuipersFMechanism of bile acid-induced biliary lipid secretion in the rat: effect of conjugated bilirubinAm J Physiol19932643 Pt 1G462G4698460700
- NishidaTGatmaitanZRoy-ChowdhryJAriasIMTwo distinct mechanisms for bilirubin glucuronide transport by rat bile canalicular membrane vesicles. Demonstration of defective ATP-dependent transport in rats (TR-) with inherited conjugated hyperbilirubinemiaJ Clin Invest1992905213021351430236
- van de SteegEWagenaarEvan der KruijssenCMOrganic anion transporting polypeptide 1a/1b-knockout mice provide insights into hepatic handling of bilirubin, bile acids, and drugsJ Clin Invest201012082942295220644253
- IusufDvan de SteegESchinkelAHFunctions of OATP1A and 1B transporters in vivo: insights from mouse modelsTrends Pharmacol Sci201233210010822130008
- RothMObaidatAHagenbuchBOATPs, OATs and OCTs: the organic anion and cation transporters of the SLCO and SLC22A gene superfamiliesBr J Pharmacol201216551260128722013971
- CuiYKonigJLeierIBuchholzUKepplerDHepatic uptake of bilirubin and its conjugates by the human organic anion transporter SLC21A6J Biol Chem2001276139626963011134001
- van de SteegEStráneckýVHartmannováHComplete OATP1B1 and OATP1B3 deficiency causes human Rotor syndrome by interrupting conjugated bilirubin reuptake into the liverJ Clin Invest2012122251952822232210
- AriasIMStudies of chronic familial non-hemolytic jaundice with conjugated bilirubin in the serum with and without an unidentified pigment in the liver cellsAm J Med196131451051814036852
- KawasakiHKimuraNIrisaTHirayamaCDye clearance studies in Rotor’s syndromeAm J Gastroenterol1979714380388453129
- WolpertEPascasioFMWolkoffAWAriasIMAbnormal sulfobromophthalein metabolism in Rotor’s syndrome and obligate heterozygotesN Engl J Med19772961910991101850521
- ButtHRAndersonVEFoulkWTBaggenstossAHSchoenfieldLJDicksonERStudies of chronic idiopathic jaundice (Dubin-Johnson syndrome). II. Evaluation of a large family with the traitGastroenterology19665156196305926936
- ZelcerNvan de WeteringKHillebrandMMice lacking multidrug resistance protein 3 show altered morphine pharmacokinetics and morphine-6-glucuronide antinociceptionProc Natl Acad Sci U S A2005102207274727915886284
- ManautouJEde WaartDRKunneCAltered disposition of acetaminophen in mice with a disruption of the Mrp3 geneHepatology20054251091109816250050
- ChaiJHeYCaiSYElevated hepatic multidrug resistance-associated protein 3/ATP-binding cassette subfamily C 3 expression in human obstructive cholestasis is mediated through tumor necrosis factor alpha and c-Jun NH2-terminal kinase/stress-activated protein kinase-signaling pathwayHepatology20125551485149422105759
- KruhGDBelinskyMGGalloJMLeeKPhysiological and pharmacological functions of Mrp2, Mrp3 and Mrp4 as determined from recent studies on gene-disrupted miceCancer Metastasis Rev200726151417273943
- AriasIMJohnsonLWolfsonSBiliary excretion of injected conjugated and unconjugated bilirubin by normal and Gunn ratsAm J Physiol19612001091109414448368
- ShupeckMWolkoffAWScharschmidtBFWaggonerJGBerkPDStudies of the kinetics of purified conjugated bilirubin-3H in the ratAm J Gastroenterol1978703259264717377
- TisdaleWAKlatskinGKinsellaEDThe significance of the direct-reacting fraction of serum bilirubin in hemolytic jaundiceAm J Med195926221422713617278
- DawsonPALanTRaoABile acid transportersJ Lipid Res200950122340235719498215
- StiegerBRole of the bile salt export pump, BSEP, in acquired forms of cholestasisDrug Metab Rev201042343744520028269
- HayashiHSugiyamaYBile salt export pump (BSEP/ABCB11): trafficking and sorting disturbancesCurr Mol Pharmacol2013629510323876151
- JessnerWZsemberyAGrafJTranscellular water transport in hepatobiliary secretion and role of aquaporins in liverWien Med Wochenschr200815819–2056556918998074
- BarnhartJLCombesBErythritol and mannitol clearances with taurocholate and secretin-induced choleresesAm J Physiol19782342E146E156623290
- JaeschkeHKrellHPfaffEQuantitative estimation of transcellular and paracellular pathways of biliary sucrose in isolated perfused rat liverBiochem J198724136356403593212
- CarlsonEZukoskiCFCampbellJChvapilMMorphologic, biophysical, and biochemical consequences of ligation of the common biliary duct in the dogAm J Pathol1977862301320836674
- De VosRDesmetVJMorphologic changes of the junctional complex of the hepatocytes in rat liver after bile duct ligationBr J Exp Pathol1978592220227656322
- MetzJAokiAMerloMForssmannWGMorphological alterations and functional changes of interhepatocellular junctions induced by bile duct ligationCell Tissue Res19771823299310922807
- SiegAKonigRUllrichDFeveryJSubfractionation of serum bilirubins by alkaline methanolysis and thin-layer chromatography. An aid in the differential diagnosis of icteric diseasesJ Hepatol19901121591642254626
- BassoDFabrisCPlebaniMAlterations in bilirubin metabolism during extra- and intrahepatic cholestasisClin Investig19927014954
- GeorgievPJochumWHeinrichSCharacterization of time-related changes after experimental bile duct ligationBr J Surg200895564665618196571
- MiyoshiHRustCRobertsPJBurgartLJGoresGJHepatocyte apoptosis after bile duct ligation in the mouse involves FasGastroenterology1999117366967710464144
- BénichouCCriteria of drug-induced liver disorders. Report of an international consensus meetingJ Hepatol19901122722762254635
- DelemosASFriedmanLSSystemic causes of cholestasisClin Liver Dis201317230131723540504
- BjhornssonESJonassonJGDrug-induced cholestasisClin Liver Dis201317219120923540497
- BritesDRodriguesCMvan-ZellerHBritoASilvaRRelevance of serum bile acid profile in the diagnosis of intrahepatic cholestasis of pregnancy in an high incidence area: PortugalEur J Obstet Gynecol Reprod Biol199880131389758256
- CastañoGLucangioliSSookoianSBile acid profiles by capillary electrophoresis in intrahepatic cholestasis of pregnancyClin Sci (Lond)2006110445946516356162
- Abu-HayyehSPapacleovoulouGLövgren-SandblomAIntrahepatic cholestasis of pregnancy levels of sulfated progesterone metabolites inhibit farnesoid X receptor resulting in a cholestatic phenotypeHepatology201357271672622961653
- LesterRSchmidRIntestinal absorption of bile pigments. II. Bilirubin absorption in manN Engl J Med196326917818213929921
- VítekLKotalPJirsaMIntestinal colonization leading to fecal urobilinoid excretion may play a role in the pathogenesis of neonatal jaundiceJ Pediatr Gastroenterol Nutr200030329429810749414
- GourleyGRArendRAbeta-Glucuronidase and hyperbilirubinaemia in breast-fed and formula-fed babiesLancet1986184826446462869347
- PolandRLOdellGBPhysiologic jaundice: the enterohepatic circulation of bilirubinN Engl J Med19712841164922346
- FelsherBFCarpioNMCaloric intake and unconjugated hyperbilirubinemiaGastroenterology19756914247807500
- LundhBJohanssonMBMerckeCCavallin-StahlEEnhancement of heme catabolism by caloric restriction in manScand J Clin Lab Invest19723044214274639647
- BensingerTAMaiselsMJCarlsonDEConradMEEffect of low caloric diet on endogenous carbon monoxide production: normal adults and Gilbert’s syndromeProc Soc Exp Biol Med197314424174194746911
- GollanJLBatemanCBillingBHEffect of dietary composition on the unconjugated hyperbilirubinaemia of Gilbert’s syndromeGut19761753353401278716
- GärtnerUGoeserTWolkoffAWEffect of fasting on the uptake of bilirubin and sulfobromophthalein by the isolated perfused rat liverGastroenterology19971135170717139352876
- KotalPVítekLFeveryJFasting-related hyperbilirubinemia in rats: the effect of decreased intestinal motilityGastroenterology199611112172238698202
- FeveryJFasting hyperbilirubinemia: unraveling the mechanism involvedGastroenterology19971135179818009352889
- BrinkMAMendez-SanchezNCareyMCBilirubin cycles enterohepatically after ileal resection in the ratGastroenterology19961106194519578964422
- ThistleJLHofmannAFEfficacy and specificity of chenodeoxycholic acid therapy for dissolving gallstonesN Engl J Med1973289136556594580472
- ZuckerSDHornPSShermanKESerum bilirubin levels in the US population: gender effect and inverse correlation with colorectal cancerHepatology200440482783515382174
- RaedschRStiehlAGundert-RemyUHepatic secretion of bilirubin and biliary lipids in patients with alcoholic cirrhosis of the liverDigestion198326280886840409
- CherrickGRSteinSWLeevyCMDavidsonCSIndocyanine green: observations on its physical properties, plasma decay, and hepatic extractionJ Clin Invest19603959260013809697
- BranchRAJamesJAReadAEThe clearance of antipyrine and indocyanine green in normal subjects and in patients with chronic lever diseaseClin Pharmacol Ther197620181891277728
- HepnerGWVesellESQuantitative assessment of hepatic function by breath analysis after oral administration of (14C)aminopyrineAnn Intern Med19758356326381200495
- D’AmicoGGarcia-TsaoGPagliaroLNatural history and prognostic indicators of survival in cirrhosis: a systematic review of 118 studiesJ Hepatol200644121723116298014
- VítekLThe role of bilirubin in diabetes, metabolic syndrome, and cardiovascular diseasesFront Pharmacol201235522493581
- FulksMStoutRLDolanVFMortality associated with bilirubin levels in insurance applicantsJ Insur Med2009411495319518005