
 ?Mathematical formulae have been encoded as MathML and are displayed in this HTML version using MathJax in order to improve their display. Uncheck the box to turn MathJax off. This feature requires Javascript. Click on a formula to zoom.
Abstract
Objectives
The aim of this study was to investigate the relationship between aquaporin (AQP) water channel expression and the pathological features of early untreated inflammatory bowel disease (IBD) in humans.
Methods
Patients suspected to have IBD on the basis of predefined symptoms, including abdominal pain, diarrhea, and/or blood in stool for more than 10 days, were examined at the local hospital. Colonoscopy with biopsies was performed and blood samples were taken. Patients who did not meet the diagnostic criteria for IBD and who displayed no evidence of infection or other pathology in the gut were included as symptomatic non-IBD controls. AQP1, 3, 4, 5, 7, 8, and 9 messenger RNA (mRNA) levels were quantified in biopsies from the distal ileum and colon by quantitative real-time polymerase chain reaction. Protein expression of selected AQPs was assessed by confocal microscopy. Through multiple alignments of the deduced amino acid sequences, the putative three-dimensional structures of AQP1, 3, 7, and 8 were modeled.
Results
AQP1, 3, 7, and 8 mRNAs were detected in all parts of the intestinal mucosa. Notably, AQP1 and AQP3 mRNA levels were reduced in the ileum of patients with Crohn’s disease, and AQP7 and AQP8 mRNA levels were reduced in the ileum and the colon of patients with ulcerative colitis. Immunofluorescence confocal microscopy showed localization of AQP3, 7, and 8 at the mucosal epithelium, whereas the expression of AQP1 was mainly confined to the endothelial cells and erythrocytes. The reduction in the level of AQP3, 7, and 8 mRNA was confirmed by immunofluorescence, which also indicated a reduction of apical immunolabeling for AQP8 in the colonic surface epithelium and crypts of the IBD samples. This could indicate loss of epithelial polarity in IBD, leading to disrupted barrier function.
Conclusion
AQPs 1 and 8 and the aquaglyceroporins AQPs 3 and 7 are the AQPs predominantly expressed in the lower intestinal tract of humans. Their expression is significantly reduced in patients with IBD, and they are differentially expressed in specific bowel segments in patients with Crohn’s disease and ulcerative colitis. The data present a link between gut inflammation and water/solute homeostasis, suggesting that AQPs may play a significant role in IBD pathophysiology.
Introduction
Inflammatory bowel disease (IBD) is a chronic, relapsing disease of the gastrointestinal (GI) tract, with frequent onset during adolescence or early adulthood. IBD is characterized by chronic activation of the immune system with inflammation of the intestinal tract and leakage of fluid, solutes, and lipids in the bowel mucosa. Patients present with one of two clinical entities, namely Crohn’s disease (CD) or ulcerative colitis (UC). CD is a transmural disease that is often localized to one or more segments of the small and large bowels, but can affect all parts of the intestine. UC is a mucosal disease that affects the large bowel and occasionally the distal part of the ileum.Citation1 Chronic diarrhea, as well as the social discomfort associated with it, is a major symptom in both CD and UC.
Water and solutes move across the single layer of intestinal epithelial cells in a transcellular or paracellular manner. In IBD patients, chronic diarrhea can be caused by impaired ion transport and dysfunctional tight junctions, leading to a “leaky” intestinal epithelium; this “leakiness” may be a primary or secondary mechanism underlying the etiology of IBD. High levels of circulating tumor necrosis factor-α (TNF-α) and several other cytokines can increase intestinal permeability and cause edema.Citation2
Aquaporins (AQPs) are a family of pore-forming proteins that efficiently and selectively transport water and/or other small uncharged solutes across biological membranes.Citation3,Citation4 AQPs belong to a distinct family of membrane-transport proteins that are selective for water molecules, and water levels are regulated across the hydrophobic plasma membrane. Studies of AQPs have provided important insight into mechanisms that mediate water homeostasis in human health and disease.Citation5 Based on comparative genomics, 13 AQPs (AQP0–AQP12) have been characterized to date. The AQP superfamily has been divided into three subgroups: AQPs 0, 1, 2, 4, 5, 6, and 8; aquaglyceroporins (AQPs 3, 7, 9, 10);Citation5 and the largely uncharacterized subgroup, which includes AQPs 11 and 12.Citation6 All AQPs are permeable to water, but AQP6 has been reported to function not only as a water channel but also as an anion channel with halide permeability when treated with Hg2+.Citation7 AQP3 and AQP8 also allow transport of hydrogen peroxide (H2O2)Citation8–Citation10 and show a preference for ammonia over water while excluding the ammonium cation (NH4+).Citation11 AQP8 is phylogenetically different from all other human AQP isoforms, possessing a unique constriction region resulting in its substrate specificity.Citation12 The aquaglyceroporins 3, 7, and 10 exhibit permeability to both water and glycerol, while aquaglyceroporin 9, in addition to water, transports glycerol and small solutes, such as urea.Citation13 The aquaglyceroporins contain two additional peptide spans required for the transport of glycerol, urea, and even larger solutes.Citation14,Citation15 AQP6 and AQP8 are localized to intracellular membranes, while all other AQPs facilitate transport across the plasma membrane.Citation16 AQPs 11 and 12 share common motifs in the primary structure that are unique to the AQP superfamily; however, they have not been shown to be permeable to water or other solutesCitation13,Citation17–Citation19 and their function is not fully understood.
AQPs are widely expressed in many human tissues and cell types, including secretory and absorptive epithelial cells.Citation4 Recent studies suggest that several AQPs could play (previously unanticipated) physiological or pathophysiological roles.Citation20 AQPs 1, 3, 4, 5, 7, 8, and 9 are expressed in the human GI tract and associated tissues.Citation21,Citation22 The broad distribution of AQPs in the human bowel suggests that they are likely to play an important role in channel-mediated water transport, intestinal permeability, and fluid secretion/absorption, and is consistent with a potential role for AQPs in the pathophysiology of the GI system. AQP3 and AQP8 expression has been found to be abnormal in human UC patients in remission.Citation23 The potential role of AQPs in early IBD or other types of GI dysfunction in humans has not yet been investigated in a systematic manner.
In this work, we test the hypothesis that AQPs contribute to dysfunctional water and solute transport in individuals with untreated IBD. The tissue-specific messenger RNA (mRNA) levels from selected AQP genes were monitored by quantitative real-time polymerase chain reaction (qRT-PCR) in biopsy samples from the distal ileum and proximal and distal colon of patients with CD or UC. The tissue distribution of selected AQPs was also assessed by using confocal microscopy with immunofluorescence (IF). The mRNA levels of selected inflammatory markers were also quantified.
Materials and methods
Patients
Patients were recruited from the prospective Inflammatory Bowel Disease South-Eastern Norway (IBSEN) II study (2005–2007) investigating the genetic, immunologic, and environmental factors that contribute to IBD etiology. Patients suspected to have IBD on the basis of predefined symptoms, including abdominal pain, diarrhea, and/or blood in stool for more than 10 days, were examined at the local hospital. Colonoscopy with biopsies was performed, and blood samples were taken. Patients who did not meet the diagnostic criteria for IBDCitation24 and who displayed no evidence of infection or other pathology in the gut were included as symptomatic non-IBD controls. Forty-three newly diagnosed patients and controls from the IBSEN II studyCitation25 were included in this cross-sectional study. Twenty-two of the patients had CD, ten had UC, and eleven were non-IBD controls, as described in . Four CD patients had ileitis, eight had colitis, and ten had ileocolitis (L1, L2, and L3, respectively, according to the Montreal classification).Citation24 All ten UC patients had pancolitis. The eleven non-IBD patients were randomly chosen as symptomatic controls with normal endoscopic and histologic findings, five with diarrhea at inclusion and the others with different symptoms that had led to inclusion in the study, as, for instance, abdominal pain, and/or blood in stool. describes the clinical and endoscopic indices as well as C-reactive protein and fecal calprotectin values in detail for each patient.
Table 1 Characterization of the study subjects
Table 2 Disease location, clinical and endoscopic activity indices, CRP, and fecal calprotectin values for patients with Crohn’s disease and those with ucerative colitis
Clinical specimens and processing of bowel biopsies
Two doses of sodium phosphate (Phosphoral®; Casen-Fleet, Madrid, Spain) were used for bowel cleansing. Colonoscopy was performed and mucosal biopsies were retrieved from the terminal ileum and the ascending and descending colon. The biopsies were taken from inflamed mucosal regions with biopsy forceps and immediately snap-frozen in liquid nitrogen or fixed in 4% formaldehyde. Inflammation was ubiquitous in UC patients, who presented with pancolitis, while the intestinal tract in CD patients was characterized by patchy inflamed regions.
Three-dimensional homology modeling
To model human AQP1, 3, and 7, Protein Data Bank (PDB) ID entry 1J4N (bovine AQP1)Citation26 was used as template, and to model AQP8, PDB ID entry 3D9S (human AQP5)Citation27 was employed. Initial multiple alignments with 20–25 orthologous sequences of AQP1, 3, 7, and 8 from various species were assembled, and sequences with sequence identity >90% were left out. The alignments were based on the template structures and used to model the AQPs in the comparative protein structure modeling program, MODELLER.Citation28 For each template, a total of 100 models were generated, and the one with the lowest discrete optimized protein energy scoreCitation29 was used for further analysis. Water molecules in the channel region were kept during the modeling, and complete tetrameric models were generated to allow analysis of the biologically active unit.
Gene expression analyses
RNA extraction and qRT-PCR of total RNA
The biopsies were homogenized using the MagNA Lyser instrument and MagNa Lyser Green Beads tubes (Roche Applied Science, Mannheim, Germany). Total RNA was extracted from 10 mg of human fresh-frozen intestinal biopsies using the MagNA Pure LC RNA Isolation Kit III (Tissue) and the MagNA Pure LC instrument (Roche), and eluted into RNAse-free water. To generate complementary DNA (cDNA), 2 μg total RNA was subjected to reverse transcriptase-PCR.
qRT-PCR for mRNA levels in gut tissue
qRT-PCR was performed by target amplification, using cDNA as template, TaqMan Gene Expression Master Mix (Applied Biosystems, Foster City, CA, USA), and the Taqman Gene Expression Assays Kit (Applied Biosystems). The sequences of the primers employed are listed in Table S1. Transcripts of the genes encoding AQP1, 3, 4, 5, 7, 8, and 9 were assessed, as they were expected to be expressed in the gut.Citation30 All values were normalized to an endogenous control (reference gene), human glyceraldehyde 3-phosphate dehydrogenase (GAPDH), 6-carboxyfluorescein (FAM)/minor groove binder(MGB) Probe; Thermo Fisher Scientific, Waltham, MA, USA), to account for variability in the concentration and quality of the total RNA and in the conversion efficiency of the reverse transcription reaction. A number of housekeeping genes were tested as the endogenous control, and all gave similar values as GAPDH. Three replicates of a 20-μL qRT-PCR reaction (TaqMan® Gene Expression Master Mix Protocol; Applied Biosystems) were performed. A 7900HT Real-Time PCR System (Applied Biosystems) and standard-mode thermal cycling conditions were used: 50°C for 2 minutes (holding stage, required for optimal uracil-N glycosylase [UNG] activity), 95°C for 10 minutes (holding stage), then 40 cycles with 95°C for 15 seconds, and 60°C for 1 minute.
qRT-PCR data analysis
For qRT-PCR data analysis, the comparative CT method was employed (the ∆∆CT method).Citation31 This method makes use of the CT value, ie, the number of cycles at which the fluorescence exceeds the threshold, for the genes of interest, relative to the corresponding CT value for a control gene (GAPDH in our application). Gene expression was measured by the quantitation of cDNA relative to a calibrator sample (reference sample), which served as a physiological reference and was the cDNA from a non-IBD patient, although not one of the non-IBD patients included in the study. Results were thus normalized to an endogenous control (GAPDH) and the relative expression was obtained, thereby providing indirect information on target mRNA levels.
Statistical analysis of qRT-PCR data
Differences in gene expression between groups were assessed using one-sampled (ileum versus right colon versus left colon) and two-sampled (CD versus UC versus non-IBD) and (ileitis versus colitis versus ileocolitis in CD) t-tests on the ∆∆CT values. For each comparison, multiple testing (testing ten genes at the same time) was corrected for by calculating Benjamini–Hochberg q-values.Citation32 Tests with q-values <10% were considered significant, corresponding to false discovery rates of <10%. Gene expression ratios between two groups A and B were calculated by using
, where mA and mB were the mean ∆∆CT values for the two groups. The analyses were performed using the statistical programming language R.Citation33
Histological analysis
Tissue preparation
Biopsies were immersion-fixed in 10% formaldehyde phosphate-buffered saline solution (PBS), embedded in paraffin, and cut into 4-μm sections on a Vibratome (VT1000S, Leica Microsystems, Wetzlar, Germany).
Confocal microscopy and IF
After washing and blocking with 2% bovine serum albumin (BSA) in PBS, gut biopsy sections were incubated overnight with primary antibodies anti-AQP1 (1:1000, polyclonal anti-rabbit; Alpha Diagnostics, San Antonio, TX, USA), AQP3 (1:100, polyclonal anti-rabbit; Sigma-Aldrich Co., St Louis, MO, USA), anti-AQP4 (1:1000, polyclonal anti-rabbit, Chemicon Millipore, Temecula, CA, USA), anti-AQP5 (1:100, polyclonal anti-rabbit, Calbiochem, EMD Chemicals Inc., Darmstadt, Germany), anti-AQP7 (1:50, polyclonal anti-rabbit; Santa Cruz Biotechnology, Inc., Santa Cruz, CA, USA), anti-AQP8 (1:50, polyclonal anti-goat; Santa Cruz Biotechnology, Inc.), and anti-AQP9 (1:100, polyclonal anti-rabbit; Alpha Diagnostics). After washing, the gut biopsy sections were incubated with Cy3 donkey anti-rabbit or Cy3 donkey anti-goat secondary antibodies (Jackson ImmunoResearch Europe Ltd, Suffolk, UK) diluted in 2% BSA 1:1,000 in PBS for 1 hour. After washing, the gut sections were mounted on glass and photographed in a Zeiss LSM510 confocal microscope (Oberkochen, Germany).
Specificity controls
For the positive controls, sections from human organs known to express each AQP were incubated along with the gut sections as shown in Figure S1, while for the negative controls, sections were incubated in the absence of the primary antibody.
Ethical considerations
All patients provided informed written consent to be involved in this study, and ethical approval of the protocol for the study was given by the Regional Ethics Committee (http://www.etikkom.no/REK/regionSorOst, reference number S-04209).
Results
Novel three-dimensional models reveal distinct AQP signatures
AQP models based on the deduced amino acid sequences were generated to visualize the three-dimensional (3D) water channel entrance and facilitate future work. The models are structurally biased toward the selected template structure; however, they do allow an impression of the structural differences that must be present between the models of the different AQPs. The human AQP1 shares >90% sequence identity with the bovine AQP1, and the model will thus resemble the actual human structure to a high degree. The sequence differences are mostly mapped to the loop regions, but for a few exceptions, they are present in the transmembrane region, as shown in –. The models for AQP3, 7, and 8 are highly conserved in the water channel region, while the remainder of the molecular landscape is divergent. The structural interaction between Arg195 and Phe56 in AQP1 is conserved in AQP1, 3, and 7, while in AQP8 the phenylalanine equivalent to Phe56 in AQP1 is replaced by histidine (His72), thus retaining the chemical moiety of an aromatic residue.
Figure 1 AQP1 expression is reduced in the ileum of CD patients.
Abbreviations: 3D, three-dimensional; AQP, aquaporin; CD, Crohn’s disease; DAPI, 4′,6-diamidino-2-phenylindole; GAPDH, glyceraldehyde 3-phosphate dehydrogenase; ID, identification number; mRNA, messenger RNA; PDB, Protein Data Bank; UC, ulcerative colitis.
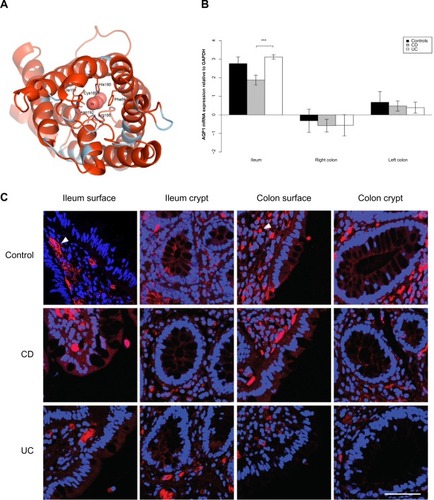
Figure 2 AQP3 expression is reduced in the ileum of CD patients.
Abbreviations: 3D, three-dimensional; AQP, aquaporin; CD, Crohn’s disease; DAPI, 4′,6-diamidino-2-phenylindole; GAPDH, glyceraldehyde 3-phosphate dehydrogenase; ID, identification number; mRNA, messenger RNA; PDB, Protein Data Bank; UC, ulcerative colitis.
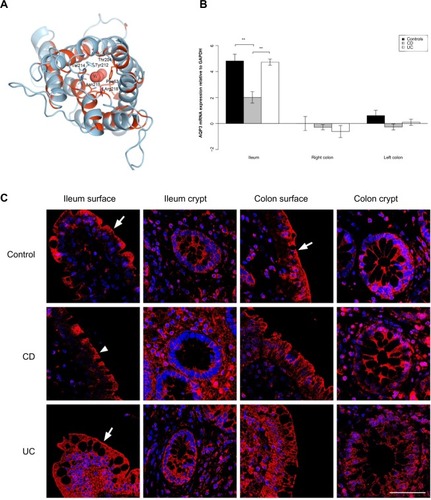
Figure 3 AQP7 expression is reduced in the ileum and colon of UC patients.
Abbreviations: 3D, three-dimensional; AQP, aquaporin; CD, Crohn’s disease; DAPI, 4′,6-diamidino-2-phenylindole; GAPDH, glyceraldehyde 3-phosphate dehydrogenase; ID, identification number; mRNA, messenger RNA; PDB, Protein Data Bank; UC, ulcerative colitis.
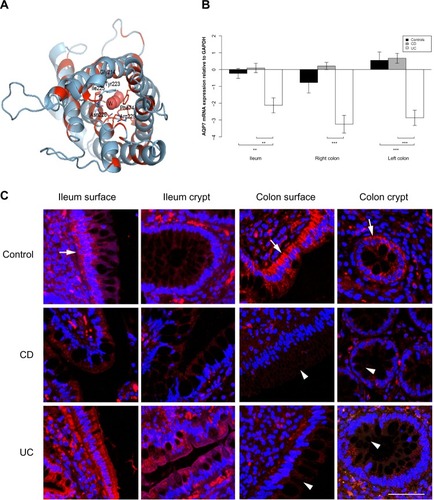
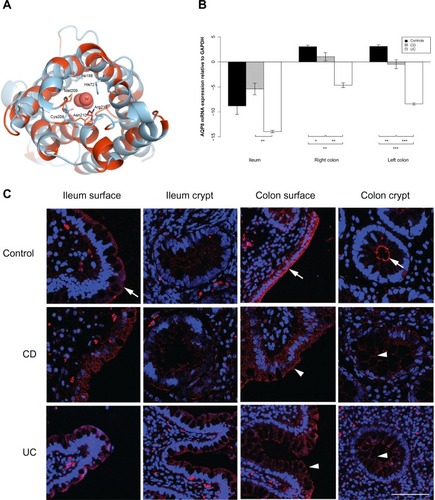
Figure 4 AQP8 expression is reduced in the ileum and colon of UC patients.
Abbreviations: 3D, three-dimensional; AQP, aquaporin; CD, Crohn’s disease; DAPI, 4′,6-diamidino-2-phenylindole; GAPDH, glyceraldehyde 3-phosphate dehydrogenase; ID, identification number; mRNA, messenger RNA; PDB, Protein Data Bank; UC, ulcerative colitis.
AQPs 1, 3, 7, and 8 are predominantly expressed in human intestinal mucosa
AQP gene expression was quantified by qRT-PCR, as demonstrated in – and , S2, and S3. mRNAs encoding AQPs 1, 3, 7, and 8 were consistently expressed at a moderate to high level (). In contrast, expression of AQPs 4, 5, and 9 was below the threshold for detection by qRT-PCR (Table S2). The remaining experiments therefore focused on expression of AQPs 1, 3, 7, and 8. A summary of the general trends in AQP expression detected by mRNA levels is provided in .
Table 3 Comparison of aquaporin mRNA levels in the small and large bowel biopsies from CD and UC patients and non-IBD patients controls
Table 4 Summary of the general trends in AQP expression detected by mRNA levels
Differential expression of AQPs in small and large bowel
AQP1 and AQP3 mRNA levels were present in higher levels in the small bowel than in the large bowel, while the opposite was observed for AQP8, as presented in . AQP7 mRNA levels were higher in the left colon than those in the right colon in non-IBD controls, and higher in the ileum than in the right colon in UC patients.
Differential expression of AQPs 1, 3, 7, and 8 in intestinal mucosa of CD and UC patients
AQP 1 and 3 mRNA levels were lower in the ileum of CD patients than in the ileum of UC patients (P<0.001); AQP3 mRNA levels were lower in CD patients than in non-IBD controls (P<0.001), whereas AQP1 mRNA levels were not significantly different in CD patients and non-IBD controls (P=0.07) (Table S3).
AQP7 and AQP8 mRNA levels were lower in both ileum and colon biopsies from UC patients than from CD patients. AQP7 mRNA levels were lower in ileum as well as right and left colon biopsies from UC patients than from CD patients (P=0.002, P<0.001, P<0.001, respectively). Similar results were obtained when ileum and left colon from UC patients were compared to those of non-IBD controls (P=0.003, P<0.001, respectively). AQP8 mRNA was less abundant in ileum as well as right and left colon biopsies from UC patients than from CD patients (P=0.005, P=0.008, P<0.001, respectively) and less abundant in right and left colon in UC patients than in non-IBD controls (P=0.001, P<0.001, respectively).
AQPs detected by IF confocal microscopy
Expression of AQPs 1, 3, 7, and 8 was confirmed at the protein level using IF confocal microscopy, as presented in –. In agreement with the qRT-PCR results, AQPs 3, 7, and 8 were readily detected by IF in all bowel segments, and AQP1 was expressed at a moderate level in all samples, while AQPs 4, 5, and 9 were not detected in any samples tested.
AQP1 was mainly located in the capillary endothelial cells and erythrocytes, but was not detected in the mucosal epithelium. It is not clear whether it is in the plasma membrane, in the cytosol, or nonspecific labeling.
The immunoreactivity of AQP3 was generally strong. In the ileal biopsy from the non-IBD control and the UC patient, as well as the in the sample from the colon of the non-IBD control, there was a distinct staining along the apical parts of the surface epithelium. The apical staining was reduced in the surface epithelium of the ileum biopsy from the CD patient ().
AQP7 staining was mainly present in the basolateral parts of surface epithelia in the ileum and colon, and also in the basolateral parts of colonic crypts. Especially in CD, but also in UC, the staining was weaker in both crypt and surface epithelia of the colon (). For AQP8, there was a distinct staining of the apical parts of the ileal and colonic surface epithelium, as well as the apical parts of colonic crypts. The signal was significantly decreased in intensity in the colonic samples of CD and UC. The distinct apical AQP8 labeling in the colonic crypt and surface epithelium was lost in the CD and UC samples and was replaced with faint basolateral labeling, as shown in .
Elevated TNF-α and interleukin-23A expression in CD
TNF-α mRNA levels in biopsies from CD patients were higher in the ileum than in the colon (P<0.001), as presented in ; and interleukin-23A (IL-23A) mRNA levels were higher in the ileum than in the left colon (P=0.04). Furthermore, TNF-α mRNA levels were higher in the ileum and left colon biopsies from CD patients than in UC patients (P=0.001, P=0.003). IL-23 was expressed at a higher level in ileal biopsies from CD patients than from UC patients (P=0.01) or non-IBD controls (P=0.03) (Table S3 and ).
Figure 5 Elevated COX-2 expression in UC and TNF-α and IL-23 expression in CD.
Abbreviations: CD, Crohn’s disease; UC, ulcerative colitis; GAPDH, glyceraldehyde 3-phosphate dehydrogenase; IL, interleukin; mRNA, messenger RNA; COX-2, cyclooxygenase 2; TNF-α, tumor necrosis factor-α.
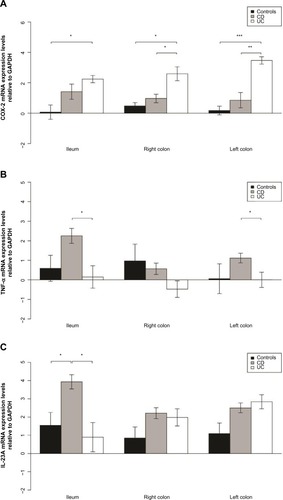
Elevated cyclooxygenase 2 expression in UC
Cyclooxygenase 2 (COX-2) was expressed at a higher level in the colon of UC patients than in the colon of CD or non-IBD controls (P=0.02 and P=0.003 for right colon and P=0.003 and P<0.001 for left colon, respectively) as shown in Table S3 and . COX-2 was also expressed at a higher level in the ileum of UC patients than in the ileum of non-IBD patients (P=0.014).
Discussion
This is the first description of concurrent AQP expression and inflammation patterns in human gut biopsy samples from well-characterized IBD patients and controls. The results clearly demonstrate reduced and differential expression of AQPs in CD and UC as compared to controls, providing insight into the potential role of AQPs in the pathology and/or inflammation associated with IBD. The present study is a systematic cross-sectional analysis of AQP expression in nontreated early IBD patients whose subgroup status is well characterized. Notably, AQP expression profiles were statistically different in CD and UC patients relative to non-IBD controls, suggesting differential gene expression associated with these diseases.
The main conclusions from the study are as follows: 1) AQP1, AQP3, AQP7, and AQP8 are the predominant AQPs in the human distal ileum and colon; 2) AQP1 and AQP3 mRNA levels are reduced in the ileum of CD patients; 3) AQP7 and AQP8 mRNA levels are reduced in the ileum and colon of UC patients; and 4) there is a reduction of apical AQP8 immunolabeling in the colonic surface epithelium and crypts of the IBD samples.
Very few studies have analyzed expression of AQPs in human tissues in vivo. A summary of key properties of AQPs is provided in . Silberstein et al demonstrated that AQP3 is expressed apically in the surface epithelium of the normal human colon,Citation34 which is consistent with our observation that AQP3 is abundant in the epithelia of the mucosal surface and the crypts of the normal human colon. Planell et al detected abnormal AQP3 and AQP8 levels in UC patients in remission;Citation23 however, that study addressed lasting epithelial cell alterations and the effect of treatment on UC but did not include CD patients.
Table 5 Summary of key properties of AQPs
Our study is the first to demonstrate high AQP3 mRNA levels in the human ileum and to show that AQP3 mRNA levels and protein levels are significantly reduced in patients with CD. Reduced AQP 1, 3, 7, and 8 expressions might be due to a negative feedback regulation during inflammation, to protect against excessive water loss. Furthermore, reduced AQP3 and AQP8 mRNA levels in IBD colon might alleviate oxidative stress in the diseased colon, because both AQP3 and AQP8 transport H2O2Citation10, which is increased in the inflamed mucosa in CD and UC patients, possibly due to increased bacterial load.Citation35,Citation36 In general, the AQP 3D structures depicted elucidate the AQP structural motifs and signatures and highlight the remarkable evolutionary conservation of the different AQPs expressed in the gut. The 3D AQP isoform models may also indicate how future studies should be focused.
Although a differential expression of AQPs 7 and 8 was noted in UC samples, evidence for differential expression of these AQPs in CD colitis samples was not demonstrated. When data were stratified according to subgroups (ileitis, colitis, ileocolitis) of CD, differences in expression of AQPs did not reach statistical significance. Future studies should involve a larger number of CD patients, and AQP expression should be compared in patients with specific CD subtypes, namely, CD with colitis and CD with ileitis with or without colitis.
AQPs 4, 5, and 9 were expressed below the limit of detection by qRT-PCR and IF in all the human patient groups investigated. In contrast, expression of these AQPs has been readily detected in the rodent gut.Citation13,Citation37 Because only a few studies have analyzed AQP expression in the human gut, it is possible that these AQPs might be expressed in segments of the human bowel not studied here or in deeper layers of the intestinal wall. Moreover, lack of detection of AQP9 mRNA was surprising because AQP9 has been previously shown to be expressed in leukocytes and upregulated in inflammatory disease.Citation38,Citation39 This discrepancy should be addressed in future studies. Matsuzaki et al have shown the expression of AQP3 in absorptive ileum cells as well as in epithelial cells in the distal colon and rectum of rats.Citation40
In humans, AQP3 is thought to facilitate absorption of water by colonic surface cellsCitation34 and promote enterocyte proliferation.Citation41 In our study, we observed a distinct expression of AQP3 in the apical lining of the surface epithelium in both ileum and colon in the control samples. However, the distinct apical labeling observed in the control samples was reduced in the surface epithelium of CD samples from the ileum. Loss of distinct apical immunolabeling was also observed for AQP8 in the colonic crypts and surface epithelium of the samples with UC and CD. These observations might indicate a possible disruption of the cellular polarity as a result of IBD.
Interestingly, in a murine model of Citrobacter rodentium-induced colitis, Guttman et al demonstrated that AQP2 and AQP3 migrate from the membrane to the cytoplasm.Citation42 Tsujikawa et al have demonstrated that rat AQPs 1, 3, 7, and 8, but not AQP4, are upregulated in the residual ileum and colon following small bowel resection.Citation43 Assuming bidirectional osmotically driven flow through AQPs, upregulation of these AQPs might directly compensate for the lack of proximal water absorption due to small bowel resection. Fischer et al postulated that AQP8 is a marker of normal proliferating colonic epithelial cells and suggested that these cells transport fluid in the colon.Citation44 Te Velde et al have reported that AQP8 is downregulated in three colitis mouse models and suggested that downregulation of AQPs in this context could protect against oxidative stress.Citation36
Data presented here corroborate with previous human studies showing that AQP7 and AQP8 are downregulated in UC. Hardin et al have shown that AQP7 and AQP8 are downregulated in CD, UC, and infectious colitis, and reported very weak expression of AQP4 in the human colon.Citation45 Notably, Zahn et al detected a decreased AQP8 expression in ileum, but increased AQP8 expression in colon in mucosal biopsies from noninflamed regions.Citation46 The authors speculated that there could be a downregulation of AQP8 expression at the very beginning of inflammation, as in Hardin’s study, followed by a compensatory increase in expression. Wang and Hou reported the downregulation of AQP8 in patients with diarrhea-dominated IBS.Citation47
The mucosal expression of the aquaglyceroporins AQP3 and AQP7 could reflect the requirement for and organ-specific functionality of water and solute transport in the gut; furthermore, if glycerol is in fact transported via these channels in the human gut, it might at least in part explain extreme weight loss in some IBD patients. In a cellular model, Zhang et al have demonstrated that knockdown of AQP3 might lead to bacterial translocation as a result of increased paracellular permeability leading to a defective intestinal barrier function.Citation48 Given that AQP3 is expressed at relatively low levels in the terminal ileum of the CD patients studied here, it is conceivable that CD pathology is exacerbated because of increased paracellular permeability, combined with a defect in bacterial sensing. In this regard, it is noteworthy that Tanaka et al have shown that AQP3 expression was induced by corticosteroids in a human airway epithelial cell line,Citation49 consistent with the fact that oral budesonide is an effective treatment of CD in the terminal ileum.
In inflamed tissue from patients with colitis, AQP 7 and AQP 8 expression decreased and the location of AQP8 in the colonic crypt and surface epithelium seemed to shift from apical to basolateral (). If high levels of AQP 7 (and AQP 8) normally promote secretion of mucus, this could explain the characteristic lack of mucus in the UC colon. Loss of the distinct apical localization of AQP3 and AQP8 in the colonic surface epithelium and crypts of the UC and CD samples might indicate disruption of the epithelial polarity, which can lead to intestinal barrier dysfunction.Citation50
CD and UC have traditionally been identified as T helper (Th) cell 1-driven and Th2-driven diseases, respectively, but recent studies demonstrate that IL-23- and Th17-dependent inflammation play a role in both diseases.Citation51 TNF-α is also a well-established marker of inflammation in IBD, and anti-TNF-α therapy is used as treatment for both disease entities.Citation52 Previous studies have demonstrated conflicting results regarding a higher expression of TNF-α in CD than UC.Citation53,Citation54 As for the IL-23 expression patterns, little is known in IBD.Citation55 The increased expression of these proinflammatory markers may suggest a direct or indirect relationship between inflammation and the patterns of AQP expression detected in the present study. We were not able to show a correlation between the expression of the inflammatory markers and clinical or endoscopic disease activity, most probably due to the small number of patients in each disease group.
We hypothesize that changes in AQP expression are linked to specific IBD subtypes. Reduced AQP1 and AQP3 mRNA levels in the ileum of CD could be a primary event leading to reduced absorption of water and glycerol in the small bowel, and this could cause diarrhea and poor nutritional status. Reduced AQP mRNA levels might be a consequence of inflammation or rather a defense mechanism against oxidative stress. It is also possible that inflammation-related cell death and loss of surface epithelial cells, especially in UC, indirectly leads to apparent reduction in levels of AQP mRNA.
Conclusion
This study has demonstrated that human AQPs are differentially expressed in the small and large bowel mucosal epithelia of untreated CD and UC patients, suggesting a potential, distinct role for these membrane channels in transporting water and solutes in the human intestinal tract, and that their dysregulation might play a role in IBD. These findings link gut inflammation and water/solute homeostasis and also challenge the traditional concept of gut permeability and bidirectional water/glycerol transit. The results have clear implications for understanding CD and UC pathogenesis and future IBD diagnostics and therapeutics.
Author contributions
PR and TT conceived the study; PR, TT, and MAM were involved in study concept and design; PR, LKL, MS, AR, MHV, and MAM acquired the data; JPM performed the 3D structural modeling of AQPs; PR, LKL, SAF, MS, SN, AR, MHV, MAM, and TT contributed to experimental analysis and/or interpretation of data; SN was responsible for statistical analysis; and PR, AR, MHV, MAM, JPM, and TT drafted the manuscript. All authors were involved in critical revision of the manuscript for important intellectual content.
Acknowledgments
We thank professor Solveig Norheim Andersen, Department of Pathology, Akershus University Hospital, for providing the histological samples used in this study; professor Torleiv Rognum, Department of Forensic Medicine and Toxicology, Oslo University Hospital, for providing human samples for control experiments; Karin Helmersen, EpiGen Institute, Akershus University Hospital, for expert technical assistance; and Carina Knudsen, Institute of Basic Medical Sciences, University of Oslo, for the artwork. This work was supported by grants from HelseSør RHF (the IBSEN II study), an Akershus University Hospital grant for strategic research, Oslo University Hospital (Rikshospitalet), and the Research Council of Norway by Centre of Excellence grant #145977 (Centre for Molecular Biology and Neuroscience [CMBN]) to TT and MAM as well as Research Council of Norway FRIMEDBIO projects #204747 to TT and #486454 to JPM.
Supplementary material
Figure S1 AQP expression in healthy human tissues.
Notes: The left panel (positive controls) shows micrographs with immunofluorescence labeling of human samples with AQP1, AQP3, and AQP7 antibodies. The tubular lumina are marked L. AQP1 is localized at the brush border and basolateral membranes of the renal proximal tubule (arrow, upper panel), AQP3 is localized at the basolateral membranes of the collecting ducts (arrowheads, middle panel) and AQP7 is localized at the plasma membrane of dipocytes (arrow, lower panel). The right panel (negative controls) shows sections from the same tissue as in the left panel, treated the same way, in absence of the primary antibody. No labeling is observed, excluding nonspecific labeling with the secondary antibodies. Scale bar: 50 μm.
Abbreviation: AQP, aquaporin.
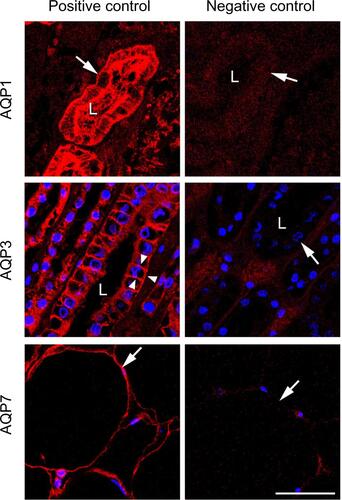
Table S1 TaqMan gene expression assays employed to monitor aquaporin expression
Table S2 Comparison of aquaporin mRNA levels in the small and large bowel biopsies from CD and UC patients and non-IBD patient controls
Table S3 Comparison of aquaporin mRNA levels from CD and UC patients and non-IBD patient controls in the small and large bowel biopsies
Disclosure
The authors report no conflict of interest in this work.
References
- HaskellHAndrewsCWJrReddySIPathologic features and clinical significance of “backwash” ileitis in ulcerative colitisAm J Surg Pathol2005291472148116224214
- HeFPengJDengXLMechanisms of tumor necrosis factor-alpha-induced leaks in intestine epithelial barrierCytokine20125926427222583690
- VerkmanASAquaporins in clinical medicineAnnu Rev Med20126330331622248325
- NielsenSAgrePThe aquaporin family of water channels in kidneyKidney Int199548105710688569067
- AgrePKingLSYasuiMAquaporin water channels – from atomic structure to clinical medicineJ Physiol200254231612096044
- IshibashiKNew members of mammalian aquaporins: AQP10-AQP12Handb Exp Pharmacol200919025126219096782
- YasuiMHazamaAKwonTHNielsenSGugginoWBAgrePRapid gating and anion permeability of an intracellular aquaporinNature199940218418710647010
- JahnTPMøllerALZeuthenTAquaporin homologues in plants and mammals transport ammoniaFEBS Lett2004574313615358535
- BienertGPMollerALKristiansenKASpecific aquaporins facilitate the diffusion of hydrogen peroxide across membranesJ Biol Chem20072821183119217105724
- MillerEWDickinsonBCChangCJAquaporin-3 mediates hydrogen peroxide uptake to regulate downstream intracellular signalingProc Natl Acad Sci U S A2010107156811568620724658
- SaparovSMLiuKAgrePPohlPFast and selective ammonia transport by aquaporin-8J Biol Chem20072825296530117189259
- AgemarkMKowalJKukulskiWReconstitution of water channel function and 2D-crystallization of human aquaporin 8Biochim Biophys Acta2012181883985022192778
- IshibashiKHaraSKondoSAquaporin water channels in mammalsClin Exp Nephrol20091310711719085041
- KraneCMFortnerCNHandARAquaporin 5-deficient mouse lungs are hyperresponsive to cholinergic stimulationProc Natl Acad Sci U S A200198141141411911707570
- KingLSYasuiMAgrePAquaporins in health and diseaseMol Med Today20006606510652478
- FerriDMazzoneALiquoriGECassanoGSveltoMCalamitaGOntogeny, distribution, and possible functional implications of an unusual aquaporin, AQP8, in mouse liverHepatology20033894795714512882
- IshibashiKTanakaYMorishitaYThe role of mammalian superaquaporins inside the cellBiochim Biophys Acta2014184051507151224189537
- EngelAStahlbergHAquaglyceroporins: channel proteins with a conserved core, multiple functions, and variable surfacesInt Rev Cytol20022157510411952238
- MagniFChinelloCRaimondoFMocarelliPKienleMGPittoMAQP1 expression analysis in human diseases: implications for proteomic characterizationExpert Rev Proteomics20085294318282122
- HachezCChaumontFAquaporins: a family of highly regulated multifunctional channelsAdv Exp Med Biol201067911720666220
- MaTVerkmanASAquaporin water channels in gastrointestinal physiologyJ Physiol1999517pt 231732610332084
- VerkmanASAquaporins: translating bench research to human diseaseJ Exp Biol20092121707171519448080
- PlanellNLozanoJJMora-BuchRTranscriptional analysis of the intestinal mucosa of patients with ulcerative colitis in remission reveals lasting epithelial cell alterationsGut20136296797623135761
- Lennard-JonesJEClassification of inflammatory bowel diseaseScand J Gastroenterol Suppl1989170262617184
- RicanekPBrackmannSPerminowGIBSEN II Study GroupEvaluation of disease activity in IBD at the time of diagnosis by the use of clinical, biochemical, and fecal markersScand J Gastroenterol2011461081109121619483
- SuiHHanBGLeeJKWalianPJapBKStructural basis of water-specific transport through the AQP1 water channelNature200141487287811780053
- HorsefieldRNordénKFellertMHigh-resolution x-ray structure of human aquaporin 5Proc Natl Acad Sci U S A2008105133271333218768791
- SaliABlundellTLComparative protein modelling by satisfaction of spatial restraintsJ Mol Biol19932347798158254673
- EswarNWebbBMarti-RenomMAComparative protein structure modeling using ModellerCurr Protoc Bioinformatics2006 Chapter 5: Unit 5.6
- MatsuzakiTTajikaYAblimitAAokiTHagiwaraHTakataKAquaporins in the digestive systemMed Electron Microsc200437718015221647
- SchmittgenTDLivakKJAnalyzing real-time PCR data by the comparative C(T) methodNat Protoc200831101110818546601
- BenjaminiYHochbergYControlling the false discovery rate: a practical and powerful approach to multiple testingJ R Stat Soc B199557289300
- Development Core TeamR: A Language and Environment for Statistical ComputingVienna, AustriaR Foundation for Statistical Computing3-900051-07-02011
- SilbersteinCKierbelAAmodeoGFunctional characterization and localization of AQP3 in the human colonBraz J Med Biol Res1999321303131310510269
- StrusMJanczykAGonet-SurowkaAEffect of hydrogen peroxide of bacterial origin on apoptosis and necrosis of gut mucosa epithelial cells as a possible pathomechanism of inflammatory bowel disease and cancerJ Physiol Pharmacol200960Suppl 6556020224152
- Te VeldeAAPronkIde KortFStokkersPCGlutathione peroxidase 2 and aquaporin 8 as new markers for colonic inflammation in experimental colitis and inflammatory bowel diseases: an important role for H2O2?Eur J Gastroenterol Hepatol20082055556018467915
- ThiMMSprayDCHananiMAquaporin-4 water channels in enteric neuronsJ Neurosci Res20088644845617893913
- MeskoBPoliskaSSzegediAPeripheral blood gene expression patterns discriminate among chronic inflammatory diseases and healthy controls and identify novel targetsBMC Med Genomics201031520444268
- IshibashiKKuwaharaMGuYTanakaYMarumoFSasakiSCloning and functional expression of a new aquaporin (AQP9) abundantly expressed in the peripheral leukocytes permeable to water and urea, but not to glycerolBiochem Biophys Res Commun199824412682749514918
- MatsuzakiTSuzukiTKoyamaHTanakaSTakataKWater channel protein AQP3 is present in epithelia exposed to the environment of possible water lossJ Histochem Cytochem1999471275128610490456
- ThiagarajahJRZhaoDVerkmanASImpaired enterocyte proliferation in aquaporin-3 deficiency in mouse models of colitisGut2007561529153517573386
- GuttmanJASamjiFNLiYDengWLinAFinlayBBAquaporins contribute to diarrhoea caused by attaching and effacing bacterial pathogensCell Microbiol2007913114116889624
- TsujikawaTItohAFukunagaTSatohJYasuokaTFujiyamaYAlteration of aquaporin mRNA expression after small bowel resection in the rat residual ileum and colonJ Gastroenterol Hepatol20031880380812795752
- FischerHStenlingRRubioCLindblomADifferential expression of aquaporin 8 in human colonic epithelial cells and colorectal tumorsBMC Physiol20011111231887
- HardinJAWallaceLEWongJFAquaporin expression is downregulated in a murine model of colitis and in patients with ulcerative colitis, Crohn’s disease and infectious colitisCell Tissue Res200431831332315338270
- ZahnAMoehleCLangmannTAquaporin-8 expression is reduced in ileum and induced in colon of patients with ulcerative colitisWorld J Gastroenterol2007131687169517461471
- WangJPHouXHExpression of aquaporin 8 in colonic epithelium with diarrhoea-predominant irritable bowel syndromeChin Med J (Engl)200712031331617374283
- ZhangWXuYChenZXuZXuHKnockdown of aquaporin 3 is involved in intestinal barrier integrity impairmentFEBS Lett20115853113311921907710
- TanakaMInaseNFushimiKInduction of aquaporin 3 by corticosteroid in a human airway epithelial cell lineAm J Physiol1997273L1090L10959374739
- KoyamaYYamamotoTTaniTExpression and localization of aquaporins in rat gastrointestinal tractAm J Physiol1999276C621C62710069989
- McGovernDPowrieFThe IL23 axis plays a key role in the pathogenesis of IBDGut2007561333133617872562
- SandbornWJHanauerSBAntitumor necrosis factor therapy for inflammatory bowel disease: a review of agents, pharmacology, clinical results, and safetyInflamm Bowel Dis1999511913310338381
- OlsenTGollRCuiGTissue levels of tumor necrosis factor-alpha correlates with grade of inflammation in untreated ulcerative colitisScand J Gastroenterol2007421312132017852866
- DionneSHiscottJD’AgataIDuhaimeASeidmanEGQuantitative PCR analysis of TNF-alpha and IL-1 beta mRNA levels in pediatric IBD mucosal biopsiesDig Dis Sci199742155715669246063
- DuvalletESemeranoLAssierEFalgaroneGBoissierMCInterleukin-23: a key cytokine in inflammatory diseasesAnn Med20114350351121585245
- FroslieKFJahnsenJMoumBAVatnMHMucosal healing in inflammatory bowel disease: results from a Norwegian population-based cohortGastroenterology200713341242217681162
- FitzgeraldPGBokDHorwitzJImmunocytochemical localization of the main intrinsic polypeptide (MIP) in ultrathin frozen sections of rat lensJ Cell Biol1983975 Pt 1149114996355119
- GorinMBYanceySBClineJRevelJPHorwitzJThe major intrinsic protein (MIP) of the bovine lens fiber membrane: characterization and structure based on cDNA cloningCell198439149596207938
- RenGReddyVSChengAMelnykPMitraAKVisualization of a water-selective pore by electron crystallography in vitreous iceProc Natl Acad Sci USA20019841398140311171962
- DenkerBMSmithBLKuhajdaFPAgrePIdentification, purification, and partial characterization of a novel Mr 28,000 integral membrane protein from erythrocytes and renal tubulesJ Biol Chem19882633015634156423049610
- FushimiKUchidaSHaraYHirataYMarumoFSasakiSCloning and expression of apical membrane water channel of rat kidney collecting tubuleNature199336164125495528429910
- AgrePSasakiSChrispeelsMJAquaporins: a family of water channel proteinsAm J Physiol19932653 Pt 2F4617692747
- IshibashiKSasakiSFushimiKMolecular cloning and expression of a member of the aquaporin family with permeability to glycerol and urea in addition to water expressed at the basolateral membrane of kidney collecting duct cellsProc Natl Acad Sci USA19949114626962737517548
- FrigeriAGropperMATurckCWVerkmanASImmunolocalization of the mercurial-insensitive water channel and glycerol intrinsic protein in epithelial cell plasma membranesProc Natl Acad Sci USA19959210432843317538665
- HoJDYehRSandstromACrystal structure of human aquaporin 4 at 1.8 A and its mechanism of conductanceProc Natl Acad Sci USA2009106187437744219383790
- NielsenSNagelhusEAAmiry-MoghaddamMBourqueCAgrePOttersenOPSpecialized membrane domains for water transport in glial cells: high-resolution immunogold cytochemistry of aquaporin-4 in rat brainJ Neurosci19971711711808987746
- NielsenSKingLSChristensenBMAgrePAquaporins in complex tissues. II. Subcellular distribution in respiratory and glandular tissues of ratAm J Physiol19972735 Pt 1C154915619374640
- MatsuzakiTSuzukiTKoyamaHTanakaSTakataKAquaporin-5 (AQP5), a water channel protein, in the rat salivary and lacrimal glands: immunolocalization and effect of secretory stimulationCell Tissue Res1999295351352110022971
- IshibashiKKuwaharaMGuYCloning and functional expression of a new water channel abundantly expressed in the testis permeable to water, glycerol, and ureaJ Biol Chem19972723320782207869252401
- IshibashiKKuwaharaMKageyamaYTohsakaAMarumoFSasakiSCloning and functional expression of a second new aquaporin abundantly expressed in testisBiochem Biophys Res Commun199723737147189299432
- TsukaguchiHShayakulCBergerUVMackenzieBDevidasSGugginoWBvan HoekANHedigerMAMolecular characterization of a broad selectivity neutral solute channelJ Biol Chem19982733824737247439733774
- HatakeyamaSYoshidaYTaniTCloning of a new aquaporin (AQP10) abundantly expressed in duodenum and jejunumBiochem Biophys Res Commun2001287481481911573934
- GorelickDAPraetoriusJTsunenariTNielsenSAgrePAquaporin-11: a channel protein lacking apparent transport function expressed in brainBMC Biochem200671416650285
- ItohTRaiTKuwaharaMIdentification of a novel aquaporin, AQP12, expressed in pancreatic acinar cellsBiochem Biophys Res Commun2005330383283815809071
- CalamitaGBishaiWRPrestonGMGugginoWBAgrePMolecular cloning and characterization of AqpZ, a water channel from Escherichia coliJ Biol Chem19952704929063290667493926
- FuDLibsonAMierckeLJStructure of a glycerol-conducting channel and the basis for its selectivityScience2000290549148148611039922
- BonhiversMCarbreyJMGouldSJAgrePAquaporins in Saccharomyces. Genetic and functional distinctions between laboratory and wild-type strainsJ Biol Chem19982734227565275729765289
- LaizéVGobinRRousseletGMolecular and functional study of AQY1 from Saccharomyces cerevisiae: role of the C-terminal domainBiochem Biophys Res Commun1999257113914410092523
- KarlgrenSFilipssonCMullinsJGBillRMTamásMJHohmannSIdentification of residues controlling transport through the yeast aquaglyceroporin Fps1 using a genetic screenEur J Biochem2004271477177914764093
- DynowskiMSchaafGLoqueDMoranOLudewigUPlant plasma membrane water channels conduct the signalling molecule H2O2Biochem J20084141536118462192
- DynowskiMMayerMMoranOLudewigUMolecular determinants of ammonia and urea conductance in plant aquaporin homologsFEBS Lett2008582162458246218565332
- NielsenSDiGiovanniSRChristensenEIKnepperMAHarrisHWCellular and subcellular immunolocalization of vasopressin-regulated water channel in rat kidneyProc Natl Acad Sci USA1993902411663116678265605