
Abstract
Background
painDETECT is a screening measure for neuropathic pain. The nine-item version consists of seven sensory items (burning, tingling/prickling, light touching, sudden pain attacks/electric shock-type pain, cold/heat, numbness, and slight pressure), a pain course pattern item, and a pain radiation item. The seven-item version consists only of the sensory items. Total scores of both versions discriminate average pain-severity levels (mild, moderate, and severe), but their ability to discriminate individual item severity has not been evaluated.
Methods
Data were from a cross-sectional, observational study of six neuropathic pain conditions (N=624). Average pain severity was evaluated using the Brief Pain Inventory-Short Form, with severity levels defined using established cut points for distinguishing mild, moderate, and severe pain. The Wilcoxon rank sum test was followed by ridit analysis to represent the probability that a randomly selected subject from one average pain-severity level had a more favorable outcome on the specific painDETECT item relative to a randomly selected subject from a comparator severity level.
Results
A probability >50% for a better outcome (less severe pain) was significantly observed for each pain symptom item. The lowest probability was 56.3% (on numbness for mild vs moderate pain) and highest probability was 76.4% (on cold/heat for mild vs severe pain). The pain radiation item was significant (P<0.05) and consistent with pain symptoms, as well as with total scores for both painDETECT versions; only the pain course item did not differ.
Conclusion
painDETECT differentiates severity such that the ability to discriminate average pain also distinguishes individual pain item severity in an interpretable manner. Pain-severity levels can serve as proxies to determine treatment effects, thus indicating probabilities for more favorable outcomes on pain symptoms.
Introduction
In contrast to nociceptive pain, which arises from actual or potential tissue injury when nociceptors are activated within the peripheral somatosensory nervous system, neuropathic pain (NeP) results from a lesion or disease of the peripheral or central somatosensory nervous systems.Citation1 Since NeP does not respond to pharmacologic interventions generally considered effective for nociceptive pain, NeP is more challenging to treat.Citation2,Citation3 Adding to this challenge is the heterogeneity of NeP, arising from the multiplicity of conditions that may result not only in such pain but also in the phenotypic presentation of sensory symptoms,Citation4–Citation7 which may result from differences in the underlying pathophysiologic mechanisms.Citation8,Citation9 Thus, accurate identification of NeP has become a key clinical goal for appropriate management, and several screening measures have been developed to facilitate differentiation of patients likely to have NeP from those with pain of nociceptive origin.Citation10,Citation11
painDETECT is a nine-item, patient-completed NeP screening questionnaire that has been psychometrically validated for assessing the likelihood of NeP.Citation12 It consists of seven pain sensory symptom items (burning, tingling/prickling, light touching, sudden pain attacks/electric shock-type pain, cold/heat, numbness, slight pressure), one pain course pattern item, and one pain radiation item.Citation12 The score range is −1 to 38, and pain is classified based on the total score: ≥19 indicates NeP with a 90% probability, ≤12 indicates presence of nociceptive pain, and scores of 13–18 are considered transitional where an NeP component may be present. painDETECT can also be used as a seven-item version consisting only of the sensory symptoms (score range 1–35), since principal component analysis identified these items as driving the data structure of the questionnaire.Citation12
Additional psychometric evaluations of painDETECT have shown that it can identify NeP across a range of conditions,Citation13 enhance the ability to characterize NeP by mapping the relationship between NeP and health status,Citation14 discriminate among the sensory symptoms to define a pain profile based on total score,Citation15 and distinguish levels of average NeP pain severity.Citation16 Long-term test–retest stability of the individual sensory symptoms, as well as for total score, has also been demonstrated.Citation17
While the total scores of both the nine- and seven-item versions discriminate average pain-severity levels (mild, moderate, and severe),Citation16 the ability to discriminate individual item severity has not been evaluated. Therefore, to further expand on the measurement properties of painDETECT, the current analysis evaluated the ability of painDETECT to discriminate and quantify individual item severity.
Methods
Data source and population
This was a post hoc analysis using data derived from a previously published cross-sectional, observational study of the burden of NeP in adults with confirmed NeP resulting from painful diabetic peripheral neuropathy (n=112), human immunodeficiency virus–related peripheral NeP (n=103), post-trauma/postsurgical NeP (n=100), spinal cord injury–related NeP (n=103), chronic low back pain–associated NeP (n=106), and small fiber neuropathy (n=100).Citation18–Citation25 Patients in the burden of illness study were identified during routine office visits at 33 community-based physician practices representing a variety of clinical specialties (eg, general practitioners, neurologists, pain specialists, endocrinologists, and other specialists) across the US between September 2011 and June 2012. For inclusion, subjects were required to have had the diagnosis for at least 6 months prior to enrollment, be managed by the physician’s practice for at least 6 months, and experienced NeP symptoms for at least 3 months prior to enrollment. The inability to distinguish between their NeP and other pain that may potentially confound the assessment was the reason for exclusion. Patients were included in the study regardless of NeP-related medication utilization; ~90% were prescribed at least one medication for NeP management during the previous 6 months.Citation25 This study was approved by a central institutional review board, Concordia Clinical Research (Cedar Knolls, NJ, USA), in accordance with the ethical principles originating from the Declaration of Helsinki and in compliance with the International Conference on Harmonization guidance on Good Clinical Practice.
Outcomes and analyses
painDETECT was included as part of the battery of questionnaires that was administered at a single time point to participants in the burden of illness study. However, since a confirmed diagnosis of NeP was an inclusion criterion, painDETECT was not used as a screening measure.
Average pain severity within the past 24 hours was evaluated using the Brief Pain Inventory-Short Form (BPI-SF),Citation26 which consists of an eleven-point numeric rating scale (from 0= no pain to 10= pain as bad as you can imagine). Pain-severity levels were defined using previously established cut points of 0–3 for mild pain, 4–6 for moderate pain, and 7–10 for severe pain.Citation27
In the current analysis, which was performed based on completed painDETECT assessment without imputation for missing data, the difference between pairs of average pain-severity levels on each painDETECT item was evaluated with a Wilcoxon rank sum test using ridit analysis.Citation28,Citation29 Ridit analysis is a non-parametric procedure that enables transformation of ordinal data to a probability scale and can be applied to assess pain treatment.Citation30 Ridit analysis can be a more sensitive alternative to the chi-square statistic for comparing two independent samples when the outcome of interest is ordered, and has the benefit of enriching interpretation by providing a simple probability or likelihood of a more favorable outcome in one group vs another.
Specifically, like ridit analysis, the Wilcoxon rank sum test is a nonparametric procedure to compare two independent samples at a time. In fact, ridit analysis and the Wilcoxon rank sum test are essentially the same. The probability or ridit associated with the ith group (ri) and the sum of the ranks associated with that group (Wi) bear a direct relation: ri = Wi – 0.5Ni(Ni+1)/(NoNi), where i=1, 2, …, k, No is the number of observations in the reference group (eg, the higher severity group) and N1 is the number of observations in the comparison group (eg, the lower severity group).Citation28
For each painDETECT item, the Mann–Whitney U statistic from the Wilcoxon rank sum test was converted using ridit analysis, allowing estimation of a straightforward metric for interpreting differences between groups – namely, the probability that a randomly selected subject from one of the average pain-severity levels (mild, moderate, severe) had a more favorable outcome on the specific painDETECT item than a randomly selected subject from another pain-severity level.
Results
A total of 624 subjects were enrolled, primarily white (71.8%), with a slightly higher proportion of males (55.4%) and a mean age of 55.5 years ().Citation18 Among the 611 subjects who provided BPI-SF pain-severity scores, mild, moderate, and severe pain were reported by 17.5%, 48.6%, and 33.9% of subjects, respectively ().
Table 1 Demographic and clinical characteristicsCitation18
On each of the seven pain symptom items, the probability of a better outcome was consistently and significantly greater than 50% (P<0.05), favoring the less-severe average pain level in all pairwise comparisons of severity levels – mild vs moderate (), mild vs severe (), and moderate vs severe (). The lowest probability was 56.3% (on numbness for mild vs moderate pain; ) and the highest probability was 76.4% (on cold/heat for mild vs severe pain; ). In each pain-severity comparison, the less-severe average pain level was significantly associated with >50% probability of a more favorable (ie, lower) total score on both the nine- and seven-item painDETECT versions (P<0.0001 for all pairwise comparisons).
Figure 1 Wilcoxon probability of better nine-item painDETECT scores on individual items and total score for the comparison of mild vs moderate average pain severity.
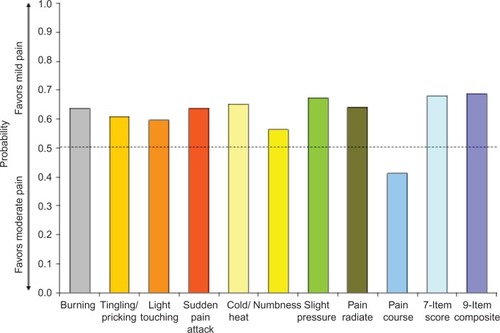
Figure 2 Wilcoxon probability of better nine-item painDETECT scores on individual items and total score for the comparison of mild vs severe average pain severity.
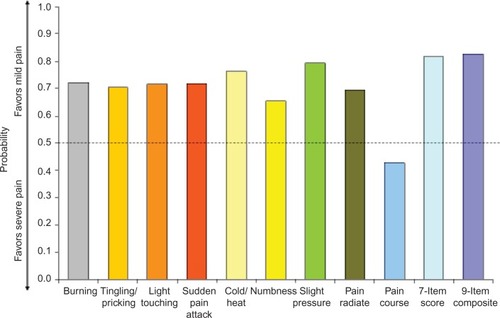
Figure 3 Wilcoxon probability of better nine-item painDETECT scores on individual items and total score for the comparison of moderate vs severe average pain severity.
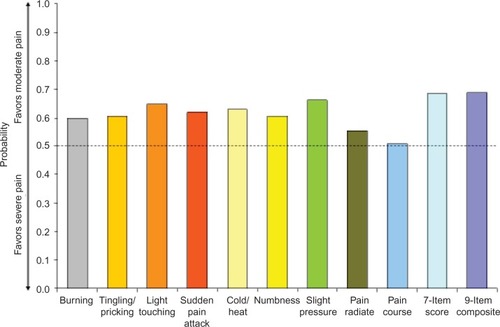
Results for the pain radiation item were significant (P<0.05) and consistent with the individual sensory symptoms as well as the seven-item total and the nine-item composite scores for all severity comparisons (–). However, the pain course item did not significantly differ between moderate and severe average pain severity (50.9% probability; P=0.712).
Discussion
This analysis shows that the previously reported property of painDETECT to discriminate average NeP pain-severity levels of mild, moderate, and severeCitation16 also extends to severity of the individual pain sensory items in an interpretable manner. These results suggest that painDETECT has the ability to measure meaningful improvements at the item-specific level, such that pain-severity levels may also serve as proxies to determine potential treatment effects. In this manner, differences or changes in painDETECT scores that distinguish severity levels also indicate the probabilities for more favorable outcomes on individual pain symptoms. Combined with the results from another study showing test–retest stability over time, these properties provide support for painDETECT as a useful measure for the longitudinal assessment of NeP in clinical trials and clinical practice.
Estimating the probability of an individual sensory response is of additional clinical relevance since painDETECT also distinguishes among the symptoms in a manner that characterizes sensory symptom profiles.Citation15 These profiles may reflect the underlying pain-generating mechanisms, as NeP sensory symptoms may arise from different pathways,Citation31 and it is thus important to be able to recognize differences in sensory profiles and outcome probabilities associated with patterns of persistence and fluctuations of the NeP as well as treatment responses.
With regard to the patterns of pain persistence and fluctuations, the painDETECT pain course item appeared to be sufficiently different from the other items: it did not additionally provide an interpretable measure of severity discrimination. The difference between the pain course item and other painDETECT items has previously been noted by its lower test–retest stability relative to the individual sensory symptoms and pain radiation, suggesting its limited use as an independent item.Citation17 Nevertheless, in the present analysis, its inclusion in the nine-item composite score did not alter the discriminative ability of painDETECT for any of the severity comparisons. While total score may be a useful metric for screening and characterizing NeP, accumulating evidence, from this study and others,Citation15,Citation17 suggests that analysis of individual sensory items provides information complementary to total painDETECT scores and may be a more clinically relevant assessment for longitudinal monitoring of NeP.
A potential limitation of the current analysis is that the population included different NeP conditions, since various etiologies can be considered to result in differences in NeP presentation among the conditions. However, in this regard, it should be noted that the psychometric validity of painDETECT across NeP conditions has previously been determined.Citation13 Furthermore, differences in symptom profiles are likely to have greater clinical relevance than the individual conditions causing NeP,Citation5,Citation6 and painDETECT distinguishes sensory symptom profiles across the conditions of the study population.Citation15 An additional limitation is that the study from which the data were derived was cross-sectional rather than longitudinal, precluding evaluation of the relationship between changes in individual item severity and changes in overall pain severity.
Conclusion
painDETECT differentiates average pain severity and this ability also distinguishes among severity levels of the individual pain sensory items in an interpretable manner. Pain-severity levels can serve as proxies to determine treatment effects, thus indicating the probabilities for more favorable outcomes on the pain symptoms.
Disclosure
This study was funded by Pfizer Inc. Joseph C Cappelleri and Alesia Sadosky are employees and stockholders of Pfizer; Vijaya Koduru is an employee of the Eliassen Group and a paid consultant to Pfizer in the conduct of the analysis, not the development of the manuscript; E Jay Bienen is an independent scientific consultant who was funded by Pfizer for manuscript development, not conduct of the analysis. The authors report no other conflict of interests in this work.
References
- International Association for the Study of PainIASP Taxonomy Available from: https://www.iasp-pain.org/Education/Content.aspx?ItemNumber=1698Accessed July 8, 2015
- AttalNCruccuGBaronREFNS guidelines on the pharmacological treatment of neuropathic pain: 2010 revisionEur J Neurol20101791113112320402746
- DworkinRHO’ConnorABAudetteJRecommendations for the pharmacological management of neuropathic pain: an overview and literature updateMayo Clin Proc201085Suppl 3S3S1420194146
- BaronRTölleTRGockelUBroszMFreynhagenRA cross-sectional cohort survey in 2100 patients with painful diabetic neuropathy and postherpetic neuralgia: differences in demographic data and sensory symptomsPain20091461–2344019592166
- BaronRFörsterMBinderASubgrouping of patients with neuropathic pain according to pain-related sensory abnormalities: a first step to a stratified treatment approachLancet Neurol20121111999100523079556
- FreemanRBaronRBouhassiraDCabreraJEmirBSensory profiles of patients with neuropathic pain based on the neuropathic pain symptoms and signsPain2014155236737624472518
- BouhassiraDWilhelmSSchachtANeuropathic pain phenotyping as a predictor of treatment response in painful diabetic neuropathy: data from the randomized, double-blind, COMBO-DN studyPain2014155102171217925168665
- RolkeRBaronRMaierCQuantitative sensory testing in the German Research Network on Neuropathic Pain (DFNS): standardized protocol and reference valuesPain2006123323124316697110
- ArningKBaronREvaluation of symptom heterogeneity in neuropathic pain using assessments of sensory functionsNeurotherapeutics20096473874819789076
- BennettMIAttalNBackonjaMMUsing screening tools to identify neuropathic painPain2007127319920317182186
- MulveyMRBennettMILiwowskyIFreynhagenRThe role of screening tools in diagnosing neuropathic painPain Manag20144323324324953075
- FreynhagenRBaronRGockelUTölleTRpainDETECT: a new screening questionnaire to identify neuropathic components in patients with back painCurr Med Res Opin200622101911192017022849
- CappelleriJCKoduruVBienenEJSadoskyAA cross-sectional study examining the psychometric properties of the painDETECT measure in neuropathic painJ Pain Res2015815916725926754
- CappelleriJCKoduruVBienenEJSadoskyAMapping painDETECT Classifications to EuroQol Health StatusPoster presented at: American Academy of Pain Management Annual Clinical MeetingSeptember 18–21, 2014Phoenix, AZ
- CappelleriJCKoduruVBienenEJSadoskyACharacterizing neuropathic pain profiles: enriching interpretation of painDETECTPatient Relat Outcome Meas2016
- CappelleriJCBienenEJKoduruVSadoskyAMeasurement properties of painDETECT by average pain severityClinicoecon Outcomes Res2014649750425395867
- KellerTFreynhagenRTölleTRA retrospective analysis of the long-term test-retest stability of pain descriptors of the painDETECT questionnaireCurr Med Res Opin201632234334926636376
- SchaeferCMannRSadoskyABurden of illness associated with peripheral and central neuropathic pain among adults seeking treatment in the United States: a patient-centered evaluationPain Med201415122105211925039856
- SadoskyASchaeferCMannRBurden of illness associated with painful diabetic peripheral neuropathy among adults seeking treatment in the US: results from a retrospective chart review and cross-sectional surveyDiabetes Metab Syndr Obes20136799223403729
- MannRBergstromFSchaeferCCharacteristics of subjects with human immunodeficiency virus-related neuropathic pain in the United States: BEAT Neuropathic Pain Observational StudyPoster presented at: American Society of Regional Anesthesia and Pain Medicine 11th Annual Pain Medicine MeetingNovember 15–18, 2012Miami, FL
- ParsonsBSchaeferCMannREconomic and humanistic burden of post-trauma and post-surgical neuropathic pain among adults in the United StatesJ Pain Res2013645946923825931
- MannRSchaeferCSadoskyABurden of spinal cord injury-related neuropathic pain in the United States: retrospective chart review and cross-sectional surveySpinal Cord201351756457023588572
- SadoskyASchaeferCParsonsBCharacteristics of subjects with chronic low back pain-related neuropathic pain (CLBP-NeP) in the US: BEAT Neuropathic pain observational study [abstract]Ann Neurol201272Suppl117
- SchaeferCMannRSadoskyAHealth status, function, productivity, and costs among individuals with idiopathic painful peripheral neuropathy with small fiber involvement in the United States: results from a retrospective chart review and cross-sectional surveyJ Med Econ201417639440724673364
- SchaeferCSadoskyAMannRPain severity and the economic burden of neuropathic pain in the United States: BEAT Neuropathic Pain Observational StudyClinicoecon Outcomes Res2014648349625378940
- CleelandCSRyanKMPain assessment: global use of the Brief Pain InventoryAnn Acad Med Singapore19942321291388080219
- ZelmanDDukesEBrandenburgNBostromAGoreMIdentification of cut-points for mild, moderate and severe pain due to diabetic peripheral neuropathyPain20051151–2293615836967
- SelvinSA further note on the interpretation of ridit analysisAm J Epidemiol197710511620831461
- MosesLEEmersonJDHosseiniHAnalyzing data from ordered categoriesN Engl J Med198431174424486749191
- DonaldsonGWRidit scores for analysis and interpretation of ordinal pain dataEur J Pain19982322122715102382
- von HehnCABaronRWoolfCJDeconstructing the neuropathic pain phenotype to reveal neural mechanismsNeuron201273463865222365541