Abstract
Umbilical cord blood (CB) has become, since its first successful use more than two decades ago, an increasingly important source of blood stem cells. In this light, an overview of current usage of CB in the field of unrelated hematopoietic blood stem cell transplantation (HSCT) is given. The three main sources of hematopoietic stem cells: bone marrow (BM), peripheral blood stem cells (PBSC), and cord blood (CB) are compared as regards their current quantitative usage in HSCT. A cost analysis of the named three hematopoietic blood stem cell (HSC) sources, taking into account various factors, is undertaken. The health economical comparison shows significant differences between CB on the one side, and BM and PBSC on the other. The consequences for the public health side and propositions for a possible health care policy, especially regarding future resource allocation towards the different choices for HSCT products, are discussed. An outlook on the possible future usage of BM, PBSC, and CB and its implications on health systems, donor registries, and CB banks is given.
Introduction
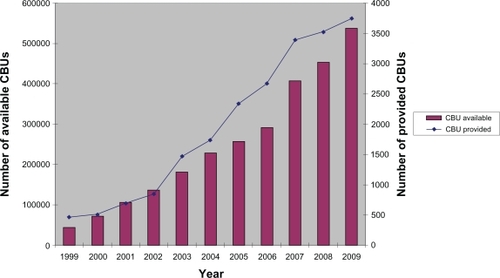
Umbilical cord blood (CB) has become, since its first successful use more than two decades ago, an increasingly important source of blood stem cells. Especially for rare Human Leukocyte Antigen (HLA) types (which are often found in non-Caucasian patients), it has frequently become the “last resource” because of the possibility of a higher mismatch due to the relative immaturity of its blood stem cells, compared to those from adult donors derived from bone marrow or apheresis. Today, some 25% of all hematopoietic blood stem cell (HSC) donations worldwide are performed with umbilical cord blood. Worldwide, there are at present over half a million cord blood units (CBUs) stored in public cord blood banks (CBBs). Nearly 4000 CBUs are provided annually and over 21000 CBUs have been provided to date.Citation1
At first sight, the widespread use of CB seems to be a complete success story. This might be at least partially the case from a medical point of view, in particular regarding the use of CB in cases where no matching adult stem cell donor is available, as is frequently the case with racial or ethnic minorities or with children coming from a multi-racial background. However, as the statistics in show, up to now only a small fraction of all stored CBUs have been used. Does this fact have an impact on the long-term financing of cord blood banking? Have resources been allocated efficiently in the past years? To give an objective answer to these questions, the author has tried to calculate the costs of worldwide cord blood banking, as well as to compare the latter with the costs of unrelated adult blood stem cell transplantation, with the two stem cell sources: bone marrow (BM) and peripheral blood stem cells (PBSC).
Table 1 Worldwide development of cord blood banking
Material and methods
For this paper, information available to the public and own organizational data were compiled by the author. A health economic analysis was undertaken through the combination of general statistical data and past product and process-specific cost analyses performed by other authors.
Specificities of cord blood as a stem cell source
The qualities of CB show quite a number of medical as well as logistical advantages, with its rapid availability being one of the most crucial. Due to the relative immaturity of CB stem cells, a higher degree of mismatching is tolerable in transplantation compared to HSC derived from adult donation.
On the other hand, the limited number of cells a CBU contains is one of the most important factors limiting its use with infants and adults with a body weight of below 50 kg. The technique of double cord transplantation is currently the prevailing method to overcome this limitation.
One factor which has escaped notion, probably because the transplant community is not aware of it, is the fact that a large portion of CB transplantations are performed urgently. The advantage of the rapid availability of CBUs is in fact a burden for the coordination centers (ie, donor registries), insofar as the usual, easier to schedule work of coordination of an unrelated adult stem cell donation has to be put back in favor of the urgent organization of a CB donation. This fact, known to the author from personal experience as well as through discussions with colleagues, has not yet been objectified to our knowledge and remains to be quantitatively analyzed in the future.
Recent research has shown that in reality, the most often demanded CBUs are those with a popular HLA type and a high cell count.Citation2 The resulting depletion of a CBB’s inventory can only be overcome by a disproportionately high addition of new CBUs to such a CBB, to maintain its attractiveness. The long-term effects of this phenomenon remain equally to be analyzed.
Political environment and international development of cord blood banking
In the year 2005, cord blood gained increased attention as public bodies worldwide decided to support cord blood banking financially, in order to increase the relevant national CB inventories. Two examples illustrate this vividly: in the United States, the “Stem Cell Therapeutic and Research Act of 2005” came into effect in December 2005. The US Congress granted 79 million US dollars (USD) for the development of a US public CB banking system. The goal was “…to assist in the collection and maintenance of 150,000 new units of high-quality cord blood to be made available for transplantation…” ().Citation3
Figure 1 Development of public cord blood banking from 1999–2009.Citation1
In Switzerland, the Swiss Foundation Blood stem cells (SBSC) decided at the same time to expand the size of the national public CBB system, from 1000 to a target inventory of 4000 CBUs. The majority of costs (500,000 to 900,000 Swiss Francs per year) were to be covered by the Foundation.Citation4
In other countries, similar efforts had been undertaken to expand the relevant sizes of national public CB inventories, due to the rising demand for HSC, especially for ethnic minorities. This demand was perceived not to be adequately covered by the then existing adult unrelated donor registries. In certain countries, the results of such programs have been impressive, as shows.
Table 2 Worldwide comparison of public cord blood banking, relative to country population
Comparison of cord blood against unrelated adult stem cell donation
At a time when previously formulated goals regarding inventory size are about to be reached, and with a possible new worldwide financial crisis looming, an objective cost-benefit analysis seems to be needed.
Before such a comparison is performed, it is necessary to look at the development of unrelated adult stem cell donation, which has shown an equally impressive growth in the past decade: By the end of 2009, more than 16 million donors have been registered worldwide, with an annual rate of donations exceeding 11,000 and almost 90,000 donations having been performed since 1997 (). The exact numbers are shown in .
Figure 2 Development of unrelated adult stem cell donation from 1997–2009.Citation1
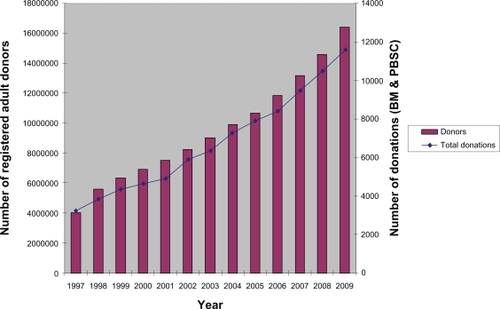
Table 3 Worldwide development of unrelated adult stem cell donation
The comparison shows amongst others that in the year 2009, roughly one quarter of HSC procurements (3,749 out of 15,356) were being realized with cord blood as the stem cell source. Regarding the “Return of inventory” (ROI) in 2009, cord blood was, with 3,749 (0.7%) CBUs provided out of 537,000 banked, ten times more effective as unrelated adult stem cell donation (11,607 donations (0.07%) out of a worldwide donor population of 16.4 million donors). This is probably due to the fact that matching criteria are not as strict with cord blood as they are with adult stem cell donors; in addition, with CB often used as a rescue treatment of second choice, transplant physicians seem to be willing to accept more incompatibilities out of the available stock of CBUs in such a situation.
In 13 years (1997–2009), 88,422 donations (45,673 PBSC plus 42,749 BM) have been performed, with PBSC recently becoming clearly the major form of donation (PBSC: 8,162/70.3% in 2009 versus 3,445/29.7% for BM). From 1999–2009, a total of 21,387 CBUs have been procured, which makes up for a cumulated ROI of nearly 4%. The worldwide CBU ROI in 2009 was 0.7% (4,739 out of a total of 537,000 CBUs).
Prima vista, these figures seem encouraging. Before a health economic comparison can be performed, it is necessary to have a general overview of the costs of production and maintenance of the different stem cell sources.
Available product-specific cost calculations
Health economic data on the costs of different stem cell sources are scarce and heterogeneous, like in many other areas of health economy. In our analysis, we used organizational data from the World Marrow Donor Association (WMDA), Bone Marrow Donors Worldwide (BMDW), and the Swiss Foundation Blood stem cells (SBSC), as well as three scientific publications: for cord blood, the works of Sirchia and colleaguesCitation7 and Howard and colleagues;Citation8 and for adult stem cell donors, information from the publication of Kollman and colleagues.Citation9
Sirchia et alCitation7 calculate, in their models (comparing different CBB types, ranging from 1,500 to 10,000 CBUs inventory size), costs of between 11,602 and 15,061 USD per released CBU, with the lowest price reached by the model of one big CBB with an inventory of 10,000 CBUs. Their pricing is based on an assumption of an ROI of 2.8%, which is four times higher than that actually achieved.
Howard et alCitation8 compared different scenarios based upon different target sizes of a national public CB inventory. Their calculations varied also according to total inventory size and ranged between a 15,336 USD (50,000 CBU inventory) and a 92,675 USD (300,000 CBU inventory) break-even fee per CBU. The details of their calculations, including a modifica-tion (in italics) which will be later explained in this paper, can be seen in .
Table 4 Price calculation of cord blood related to inventory size
Kollman et alCitation9 used for their cost estimations, the data of the US National Marrow Donor Program (NMDP). They came to total costs for the recruitment of a new donor of between 113 USD for white persons, and 141 USD for non-Caucasian volunteers, based on different recruitment fees for donor centers.
Prices (fees) per stem cell product
The above organizational data are fees incurred on the procurement of different stem cell products, and vary between those products as well as internationally, between different national registries and donor organizations.
(cord blood) and (unrelated adult stem cell donation) show the individual prices per procured stem cell product. For the sake of simplicity, a rounded average price, comprising the procurement fees of the most important donor registries, was calculated per world region. In multiplying the individual product prices by the actually delivered products (2009 data), total costs have been calculated, which were then converted to a weighted average price-per-unit (PPU). The calculation shows a difference between the mean prices of cord blood and adult stem cell products of 21,486 USD (adult) and 27,579 USD (cord blood), or 28.4%. Compared to the overall costs of a HSTC transplantation of 200,000 USD,Citation10 this price differential seems to be acceptable.
Table 5 Price calculation of provided cord blood products
Table 6 Price calculation of procured adult stem cell products
Results
Calculation of health care system related costs
We undertook the attempt to make a calculation of the costs of stem cell products on a global scale. The goal of this approach was to have an overall image of worldwide costs of stem cell products, as well as comparing CB as well as BM and PBSC against each other. The method used was the multiplication of available products (CBUs banked vs Registered adult donors) by the average costs per product, along with the costs of provided products (provided CBUs vs BM/PBSC) multiplied by the cumulated total number. This resulted in a price-per-product (PPP) which was calculated by the division of total costs by the number of delivered products. In contrast to this system-based approach (all costs incurred by the same health system,) a theoretical institution-based approach was used, in which the costs for delivered products were regarded as profits, which were subtracted from the total inventory build-up costs. The resulting individual price was named PPP2.
Four models were used to determine the total prices incurred by the health systems for the use of cord blood, using the publications of Sirchia et al and Howard et al.Citation7,Citation8 For each publication, an optimistic (“A”) and a realistic (“B”) approach was defined, resulting in different prices-per-product. In the case of Sirchia et alCitation7 the optimistic approaches consisted of using Sirchia’s model of one single CBB (10,000 CBU’s), together with the original assumption of a ROI of 2.8%. This approach came to a price of 11,602 USD/CBU. In using a different model, we applied the actual worldwide annual CBU ROI of 0.7% to the original calculation, which resulted in a four-fold increase of the original price, leading to costs of 46,408 USD/CBU.
With regard to the calculations of Howard et alCitation8 we used on the one hand Howard’s model closest to the actual ROI (inventory of 100,000 CBUs, yearly usage of 643 CBUs), which had the original calculation of 31,107 USD/CBU. Our alternative approach consisted of a modification of the Howard et al model with the biggest inventory size (300,000 CBU) which we deemed to be close to the actual worldwide number (537,000 CBU). We modified it by using a yearly usage rate of 2,100 CBUs (0.7% of 300,000), with the respective correction of price (“CB fee”) being 29,568 USD/CBU.
The same method was applied for adult stem cell donors, using the data from Kollman et al.Citation9 Under the assumption that other international registries would have higher registration costs than the NMDP data used by Kollman,Citation9 we applied the higher price (141 USD, for non-Caucasians), even knowing that the majority of registered stem cell donors would be Caucasians. In the second model (“B”), we added maintenance costs of 3 USD per donor per year, assuming that the average donor would remain in a registry for 20 years; which lead to a rounded overall price of 200 USD per unrelated adult stem cell donor. In a third model, a “production price” for HSC (USD 7100 per donation) was added to the medium donation fee calculated above (USD 21,486), using data from Smith et al,Citation11 with the calculation of a weighted medium price of USD 7100 accounting for the repartition of the two different adult stem cell sources to date (45,673 PBSC against 42,749 BM donations). In the system-based approach, all costs were added, whereas in the institution-based approach, fees were subtracted from registration plus production costs.
Table 7 Health system-wide cost calculation (cord blood) using various approaches
The multiplication of registration and procurement costs over the time period 1999–2009, lead to total costs for cord blood of between 6.8 and 25.5 billion USD in the health system-based approach. When divided per provided product, unit costs of 318,890 and 1.19 million USD per product (CBU) result. The total costs for adult stem cell donation incurred over the time period 1997–2009 amounted to sums of between 4.2 and 5.8 billion USD in the health-system-based approach. Prices per procured product (division by cumulated donations) led to a unit price of between 47,638 and 65,681 USD per product (for BM and PBSC respectively). Although we regard the institution-based approach (“PPP2”) as less relevant than the health system-based approach, the price differential between cord blood and adult stem cell product remained in roughly the same range.
Table 8 Health system-wide cost calculation (unrelated adult stem cell products) using various approaches
Discussion
It was clear to the author that there had to be significant differences in cost between CB and BM/PBSC, due to the fact that the vast majority of stored CBUs has not been used for purposes of transplantation. Nevertheless, the extent of these differences has been unexpected. In each of the models on which the different comparisons have been based, the price differential of CB to PM/PBSC was a multiple between the former and the latter. Taking into account the global health systemwide cost totals, differences amounting to a height of 1–2 × 10¹⁰ USD can be postulated. These are magnitudes which should justify further regard and discussion at a policy level.
Conclusion
We are aware that further calculations have to be made in order to arrive at more precise unit costs. Yet we do think that the striking differences of true (health system-related) unit costs between cord blood and adult stem cell products merit further analysis. With regard to cord blood, a further increase of worldwide inventories should be thoroughly weighed against alternative approaches (eg, further increase of adult donor registries respectively enhancing qualitative performance of adult registries through improved availabilities). Notwithstanding these points, serious efforts should be undertaken in order to reduce costs in the entire business process of cord blood banking (harvesting, processing, storage). The consequences of a continuation of the current system could otherwise be regarded as being prohibitively expensive to deciders in our health systems.
Disclosure
The author reports no conflicts of interest in this work.
References
- World Marrow Donor AssociationStem Cell Donor Registries Annual Report 200913th edLeiden, NetherlandsWMDA2010
- GragertLMaiersMWilliamsEConferDKlitzWPopulation-based models because of depletion of high nucleated cell count (TNC) units with common HLAAbstract # 114, presented at the 8th Annual International Cord Blood Transplantation Symposium2010 Jun 3–5San Francisco, California
- GovTrack.US: a civic project to track Congress. Dec 19, 2005. Text of H.R. 2520 [109th]: Stem Cell Therapeutic and Research Act of 2005. Available from: http://www.govtrack.us/congress/billtext.xpd?bill=h109-2520. Accessed Sept 13, 2010
- Swiss Foundation Blood stem cellsThe role of SBSC in the context of cord blood donations [updated Sep 2008]. Available from: http://www.bloodstemcells.ch/blood-stem-cells/cord-blood/the-role-of-sbsc/the-role-of-sbsc?set_language=en. Accessed Jun 13, 2010.
- Bone Marrow Donors Worldwide Number of donors/CBU’s per registry in BMDW. Available from: http://www.bmdw.org/index.php?id=statistics. Accessed May 16, 2010.
- US Census BureauInternational Data Base Available from: http://www.census.gov/ipc/www/idb/informationGateway.php. Accessed May 16, 2010.
- SirchiaGRebullaPTibaldiSLecchiLCost of umbilical cord blood units released for transplantationTransfusion199939664565010378846
- HowardDHMaiersMKollmanCLoganBGragertLSetterholmMA cost-benefit analysis of increasing cord blood inventory levelsMeyerEAHannaKGebbieKCord Blood: Establishing a National Hematopoietic Stem Cell Bank ProgramWashington DCNational Academy of Sciences, National Academies Press2005221241
- KollmanCAbellaEBaittyRLAssessment of optimal size and composition of the US national registry of hematopoietic stem cell donorsTransplantation2004781899515257044
- WelchHGLarsonEBCost effectiveness of bone marrow transplantation in acute nonlymphocytic leukemiaN Engl J Med1989321128078122505077
- SmithTJHillnerBESchmitzNEconomic analysis of a randomized clinical trial to compare filgrastim-mobilized peripheral-blood progenitor-cell transplantation and autologous bone marrow transplantation in patients with Hodgkin’s and non-Hodgkin’s lymphomaJ Clin Oncol19971515108996118