Abstract
Background
Type 2 diabetes mellitus (T2DM) is a major global health problem. An estimated 20%–50% of diabetic subjects in Canada are currently undiagnosed, and around 20%–30% have already developed complications. Screening for high blood glucose levels can identify people with prediabetic conditions and permit introduction of timely and effective prevention. This study examines the benefit of screening for impaired fasting glucose (IFG) and T2DM. If intervention is introduced at this prediabetic stage, it can be most effective in delaying the onset and complications of T2DM.
Methods
Using a Markov model simulation, we compare the cost-effectiveness of screening for prediabetes (IFG) and T2DM with the strategy of no screening. An initial cohort of normoglycemic, prediabetic, or undiagnosed diabetic adults with one or more T2DM risk factors was used to model the strategies mentioned over a 10-year period. Subjects without known prediabetes or diabetes are screened every 3 years and persons with prediabetes were tested for diabetes on an annual basis. The model weighs the increase in quality-adjusted life-years (QALYs) associated with early detection of prediabetes and earlier diagnosis of T2DM due to lifestyle intervention and early treatment in asymptomatic subjects.
Results
Costs for each QALY gained were $2281 for conventional screening compared with $2890 for no screening. Thus, in this base-case analysis, conventional screening with a frequency of once every 3 years was favored over no screening. Furthermore, conventional screening was more favorable compared with no screening over a wide range of willingness-to-pay thresholds. Changing the frequency of screening did not affect the overall results. Screening persons without diabetes or prediabetes on an annual basis had small effects on the cost-effectiveness ratios. Screening with a frequency of once every 5 years resulted in the lowest cost per QALY ($2117). Lack of screening costs the health care system $4812 more than the cost of screening once every 5 years.
Conclusion
The increased cost per QALY of not screening is due to the costs of complications caused downstream of T2DM. By ensuring that IFG screening occurs every 3 years for those without prediabetes and every year for those with prediabetes, the health and financial benefits related to T2DM are improved in Canada.
Introduction
Type 2 diabetes mellitus (T2DM) is a major health problem, not only in North America but globally. According to the World Health Organization, 343 million people worldwide have diabetes, 90% of whom have T2DM.Citation1 This has prompted health care workers to recognize diabetes as a significant public health problem. In Canada, there are 2.9 million people with diabetes.Citation2 An estimated 20%–50% of diabetic subjects in Canada are currently undiagnosed, and around 20%–30% have already developed complications.Citation3 Unless treated, the disease may lead to serious complications including chronic kidney disease, neuropathy, retinopathy, and cardiovascular diseases, leading to major economic impacts.Citation1 The prevalence of T2DM is also expected to rise further due to the increased rates of risk factors associated with the disease, such as obesity, physical inactivity, and consumption of dietary fat.
Screening for high blood glucose levels can identify people with prediabetic conditions and permit introduction of timely and effective prevention. Although targeted screening for T2DM is widely performed among different patient and “at-risk” groups in Canada, currently there is no systematic screening policy for the disease. According to the recommendations of the Canadian Task Force on Preventive Health Care, screening involves only individuals who are asymptomatic and is most effective if conducted twice.Citation4 Those who exhibit symptoms or signs of T2DM, and those who have potential disease-related complications are recommended to undergo diagnostic testing.Citation4 According to the Canadian Diabetes Association, a fasting plasma glucose is recommended to be performed every 3 years in individuals 40 years of age and older.Citation5
One approach for T2DM screening would be to focus screening on the disease only. Although this approach will allow for early diagnosis and treatment, it will not permit possible delay in the disease onset. However, an alternative approach is to screen for T2DM as well as prediabetic status via impaired glucose tolerance or impaired fasting glucose. If intervention is introduced at the prediabetic stage, it can be most effective in delaying the onset and complications of T2DM. Intervention strategies may encompass both lifestyle and nutritional factors, and are known to reduce the risk of T2DM complications markedly.Citation6
Numerous mathematical simulation studies have been employed to determine the effectiveness of screening for T2DM or prediabetic status.Citation7–Citation11 Previous models of screening for T2DM alone have generally assessed the impact of a single screening and early treatment of cardiovascular events, whereas other models included microvascular events, such as retinopathy.Citation3 Overall, these models produced favorable economic outcomes for T2DM screening, although cost-effectiveness varied according to the age groups, the environmental risk factors associated with the disease, and the population targeted.Citation3 To our knowledge, no study has reported cost-effectiveness of T2DM screening for the entire Canadian population. According to the Canadian Diabetes Association, testing for T2DM in prediabetic subjects is likely to achieve an overall saving in health care costs.Citation5 Therefore, the present study was undertaken in an attempt to assess the health benefits and health care cost reduction associated with early screening strategies for prediabetic conditions and T2DM in Canada, using a Markov model simulation.
Materials and methods
Model structure
Using a Markov model simulation, we compared the cost-effectiveness of no screening with conventional screening for prediabetes (impaired fasting glucose) and T2DM. The model was developed using TreeAge software (TreeAge Inc, Williamstown, MA) and consisted of a Markov state-transition model, as shown in and a Markov simulation model, as shown in . The model tracks a cohort of individuals who are at risk for T2DM, with at least one risk factor from those shown in . Each adult individual may be normoglycemic, prediabetic, or have undiagnosed diabetes. Therefore, each person entering the model may start the first cycle in any of the three states, ie, normal glucose, impaired fasting glucose undetected, or T2DM undetected. The prevalence of undetected impaired fasting glucose and undiagnosed T2DM in the population is used to estimate how many individuals start in each of the three states.Citation12 Patients who have already been identified as having T2DM are excluded from the screening process. Patients can be identified through either a screening program or symptom-based case finding.
Figure 1 Markov state-transition model with the seven proposed health states and possible transitions to be performed once for each screening method.
Abbreviation: IFG, impaired fasting glucose; T2D, type 2 diabetes mellitus.
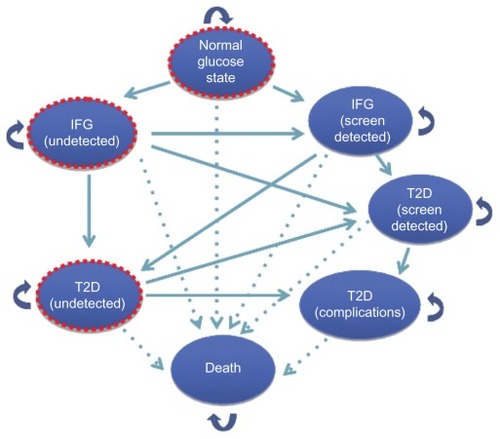
Figure 2 Markov model simulation for the impact of screening and early detection of impaired fasting glucose tolerance and type 2 diabetes in Canada.
Abbreviations: IFG, impaired fasting glucose; TP, true positive test result; TN, true negative; FN, false negative; FP, false positive; T2DM, type 2 diabetes mellitus.
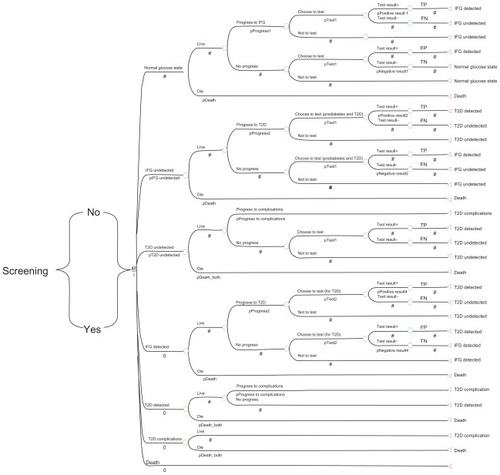
Table 1 Risk factors for type 2 diabetesTable Footnote1
A patient’s health is characterized by distinct health states, and the natural history is summarized by the possible transitions between these states. Health states are defined based on the following components: the health condition (ie, alive or dead), blood glucose level (normal, diabetic or prediabetic), and whether the patients’ status is known (as a result of either screening or symptom-based case finding) or unknown. These components result in the following seven states: normal glucose level, impaired fasting glucose states (undetected impaired fasting glucose and detected); T2DM states (undetected, screen detected, and diagnosed with complications); and death. The transitions between these seven states are illustrated in . Based on the diagnosis of T2DM and impaired fasting glucose, the patients would receive relevant treatment or intervention regimen.
Health-state transition assumptions
Transition between the health states described above occur on a one-year cycle. Subjects who start at normal glucose state may stay in this state or progress to either impaired fasting glucose screen-detected or screen-undetected during the year ahead. If they progress to one of the two impaired fasting glucose conditions, they will move to the corresponding state in the next cycle based on their test result. For example, a true positive test places the individual in the state of “impaired fasting glucose detected”. However, a false negative test places the patient in “impaired fasting glucose undetected state” because they have already developed impaired fasting glucose. If they do not progress to impaired fasting glucose, and their test result is negative (true negative), they remain in the normal glucose state, otherwise they will be falsely labeled as “impaired fasting glucose detected” and will move to the “impaired fasting glucose detected” state in the next cycle and receive relevant intervention/treatment. Those who start at “impaired fasting glucose undetected” may progress to T2DM. If their test result is positive, they are truly diagnosed with T2DM and move to “T2DM detected” state in the next cycle. If their result is negative, it is a false negative condition because they have developed T2DM and move to “T2DM undetected”. Those who do not progress to T2DM will move to “impaired glucose tolerance detected” state or remain at the state of “impaired fasting glucose undetected” according to their test result (see for transition among other states).
Model assumptions
A one-year cycle over a time period of 10 years was used for the simulation. The model allows for annual screening for prediabetes and diabetes, as well as screening performed within longer intervals. For the base-case analysis, subjects without known prediabetes or diabetes are screened every 3 years and persons with prediabetes are tested for diabetes on an annual basis. The Canadian Diabetes Association recommends a screening frequency of 3 years for subjects without known prediabetes or diabetes, and a higher frequency for persons with higher risk of diabetes.Citation5 Moving from the normal glucose state to T2DM in the model occurs through impaired fasting glucose states. Subsequently, individuals with prediabetes reside in this state for at least one year before they develop T2DM. Indeed, developing T2DM within one year of having normal glucose level is relatively rare. There is no transition in this model from T2DM back to impaired fasting glucose or from impaired fasting glucose to a normal glucose state. This is clinically sound because once an individual has a diagnosis of T2DM, even if the glucose levels improve, it can still be clinically defined as having the disease. Also, once an individual has impaired fasting glucose, even if the fasting glucose decreases, the future risk of T2DM is probably more similar to that of an individual with impaired fasting glucose rather than an individual who has always had normal fasting glucose levels. Another assumption employed here proposes that once an individual develops T2DM (undetected) or is diagnosed with the disease by screening (T2DM detected), he or she will spend at least one cycle in the respective states before developing T2DM complications.
Model input
The inputs into the Markov model consisted of the prevalence of undiagnosed T2DM and impaired fasting glucose, probabilities of moving from one state to the next,Citation2,Citation12,Citation13 sensitivity and specificity of tests,Citation12–Citation15 and the effectiveness of lifestyle modification programs for people with impaired glucose tolerance in the Diabetes Prevention Program.Citation14 In comparisons with placebo, lifestyle and metformin interventions reduce the incidence of T2DM by 58% and 31%, respectively. The lifestyle modification program has goals of 7% weight loss and 150 minutes of weekly physical activity.Citation8,Citation14
The standard quality-of-life values (evaluated from the EQ-5D) were used to populate quality-adjusted life-years (QALYs) for each of the health states previously mentioned. Costs such as those for screening and confirmatory diagnostic tests were taken from the report prepared for the Ontario Ministry of Health and Long-term Care and applied for all Canadians.Citation16 Costs of pharmacological interventions for impaired glucose tolerance were based on metformin 250 mg three times per day, the standard dose used by most intervention studies.Citation16,Citation17 For the costs of pharmacological interventions in people with diagnosed T2DM, the average annual costs of antidiabetic treatment for Canada were used.Citation16 Furthermore, for subjects with T2DM detected at screening, in whom we would expect costs of complications to be lower, we used the costs estimated from the intensively treated patients.Citation16 For those with clinically diagnosed diabetes, we used the reported costs for the conventionally treated patients.Citation16 All costs were reported in Canadian dollars from year 2010 and were standardized by inflation indices ().
Table 2 Base-case input values for the Markov modelTable Footnote1
Results and discussion
Several studies have evaluated the cost effectiveness of screening for T2DM.Citation7,Citation8,Citation12,Citation25,Citation26 However, few studies have compared the cost benefits of screening in both prediabetic and diabetic subjectsCitation3,Citation27 and, to our knowledge, no study has targeted the Canadian population. The United Kingdom Prospective Diabetes study model was adopted to develop a cost-benefit analysis of diabetes management in Ontario.Citation28 In the present study of cost-effectiveness of screening for impaired fasting glucose and T2DM, we observed the cost and health benefits of early detection of prediabetes and previously unrecognized T2DM. Our results demonstrate that screening is most favorable for those over 40 years of age (or in subjects with at least one risk factor) when performed on prediabetic subjects every 5 years. For this outcome to be substantiated, it is critical that screening be followed by intervention protocols targeted at delaying the onset of T2DM.
The Markov model was applied to assess a 10-year/lifetime progression of T2DM, costs, QALYs, and incremental cost-effectiveness ratios. We adopted a health system perspective that considers only direct medical costs, discounting costs and QALYs at 3% per year. The outcomes for the model over a 10-year period, with discounting of both costs and benefits at 3% a year and testing persons with prediabetic conditions for T2DM annually, is shown in . The cost for each QALY gained is $2281 for conventional screening, compared with $2890 for no screening. These base-case results are shown on the cost-effectiveness plane in . Therefore, in the base-case, the conventional screening strategy of using a screening frequency of once every 3 years dominated the no screening strategy.
Figure 3 Cost-effectiveness comparison between conventional screening for type 2 diabetes mellitus and no screening.
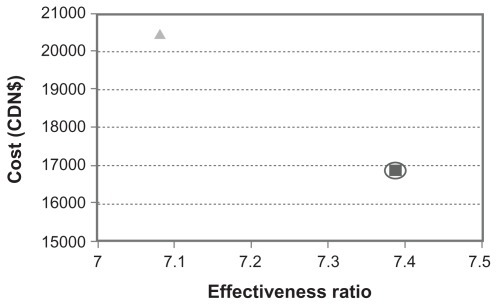
Table 3 Sensitivity analysis and variation in frequency of screening
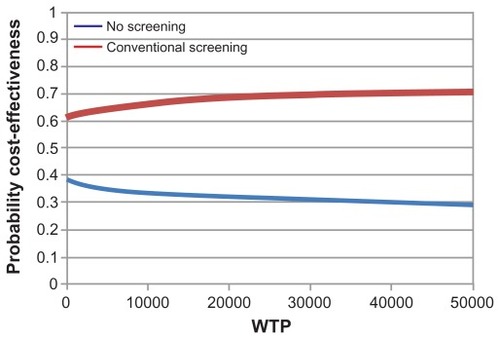
A sensitivity analysis was conducted on the frequency of screening () to understand the most effective screening interval period. Screening persons without known diabetes or prediabetes on an annual basis had small effects on the cost-effectiveness ratios, and screening with the frequency of once every 5 years resulted in the lowest cost per QALY, ie, $2117. It costs the health care system $4812 more to not screen patients rather than screen every 5 years (). This is due to the costs of complications caused downstream of diabetes. The cost-effectiveness acceptability curve () illustrates the probability of cost-effectiveness of each strategy over a range of willingness-to-pay thresholds and indicates the overall level of uncertainty in the model. Conventional screening tends to be favorable compared with no screening over a wide range of willingness-to-pay thresholds. Changing the frequency of screening did not affect the overall results.
Figure 4 Cost-effectiveness acceptability curve for conventional screening for type 2 diabetes compared with “no screening” strategy.
The results support conventional screening every 3 years, with a wide variation in the cost of screening for prediabetes and diabetes. It should be noted that the model only takes into account the health care costs from the perspective of the health care system. There are further sensitivity data points that can be examined in the model. Prevalence rates for diabetes could be graphed from 1% to 100% to understand the threshold of screening frequency and the health and financial implications over time for decision-makers. Also, a more concise average of provincial health care costs could be incorporated into the study to model better the implications for each province. Another area for further research would be to expand the chosen time horizon of 10 years for the model. This could be expanded to a lifetime horizon to simulate better the slow natural progression of the disease, as was carried out by Schaufler and Wolff Citation29 who developed a similar model over a lifetime horizon for the German health care system.
In conclusion, our study demonstrates that early screening for prediabetes and T2DM to prevent or delay onset of the disease has positive public health and economic impacts in Canada. Through prevention and early treatment of T2DM, the time spent in the more severe and costly states can be markedly reduced. Therefore, by ensuring impaired fasting glucose screening occurs every 3 years for those without prediabetes and every year for those with prediabetes, the health and financial benefits related to T2DM can be improved in Canada.
Acknowledgment
This work received support from the Public Health Agency of Canada.
Disclosure
The authors report no conflicts of interest in this work.
References
- World Health OrganizationDiabetes. Fact sheet Number 31282011 Available at: http://www.who.int/mediacentre/factsheets/fs312/en/index.htmlAccessed January 15, 2012
- ShawJESicreeRAZimmetPZGlobal estimates of the prevalence of diabetes for 2010 and 2030Diabetes Res Clin Pract201087141419896746
- GilliesCLLambertPCAbramsKRDifferent strategies for screening and prevention of type 2 diabetes in adults: cost effectiveness analysisBr Med J200833676541180118518426840
- FeigDSPaldaVALipscombeLCanadian Task Force on Preventive Health CareScreening for type 2 diabetes mellitus to prevent vascular complications: updated recommendations from the Canadian Task Force on Preventive Health CareCMAJ2005172217718015655234
- Canadian Diabetes Association2008 Clinical Practice Guidelines for the Prevention and Management of Diabetes in CanadaCanad J Diab200832 Suppl 1S14S17
- BadawiAKlipAHaddadPType 2 diabetes mellitus and inflammation: prospects for biomarkers of risk and nutritional interventionDiabetes Metab Synd Obes20103173186
- HoergerTJHarrisRHicksKADonahueKSorensenSEngelgauMScreening for type 2 diabetes mellitus: a cost-effectiveness analysisAnn Intern Med2004140968969915126252
- GoyderECIrwigLMScreening for type 2 diabetes mellitus: a decision analytic approachDiabet Med200017646947710975217
- LiRZhangPBarkerLEChowdhuryFMZhangXCost-effectiveness of interventions to prevent and control diabetes mellitus: a systematic reviewDiabetes Care20103381872189420668156
- RaikouMMcGuireAThe economics of screening and treatment in type 2 diabetes mellitusPharmacoeconomics200321854356412751913
- HoergerTJHicksKASorensenSWCost-effectiveness of screening for pre-diabetes among overweight and obeseDiabetes Res2007301128752879
- WilsonSERosellaLCLipscombeLLManuelDGThe effectiveness and efficiency of diabetes screening in Ontario, Canada: a population-based cohort studyBMC Public Health201010150620727141
- HuxJEIvisFFlintoftVBicaADiabetes in Ontario: Determination of prevalence and incidence using a validated administrative data algorithmDiabetes Care200125351251611874939
- PalmerAJRozeSValentineWJSpinasGAShawJEZimmetPZIntensive lifestyle changes or metformin in patients with impaired glucose tolerance: modeling the long-term health economic implications of the diabetes prevention program in Australia, France, Germany, Switzerland, and the United KingdomClin Ther200426230432115038953
- RasmussenSGlumerCSandbaekALauritzenTBorch-JohnsenKProgression from impaired fasting glucose and impaired glucose tolerance to diabetes in a high-risk screening programme in general practice: the ADDITION study, DenmarkDiabetologia200650229329717143605
- O’ReillyDHopkinsRBlackhouseGHuxJDolovichLDevelopment of an Ontario Diabetes Economic Model (ODEM) and Application to a Multidisciplinary Primary Care Diabetes Management ProgramReport Prepared for the Ontario Ministry of Health and Long-term Care2006
- HernanWHHoergerTJBrandleMDiabetes Prevention Program Research Group The cost-effectiveness of lifestyle modification or metformin in preventing type 2 diabetes in adults with impaired glucose toleranceAnn Intern Med2005142532333215738451
- MeigsJMullerDNathanDBlakeDAndresRBaltimore Longitudinal StudyThe natural history of progression from normal glucose tolerance to type 2 diabetes in the Baltimore longitudinal study of agingDiabetes20035261475148412765960
- BonoraEKiechlSWilleitJOberhollenzerFEggerGPopulation-based incidence rates and risk factors for type 2 diabetes in white individuals: the Bruneck studyDiabetes20045371782178915220202
- DaviesMTringhamJJarvisJSkinnerTCFarooqiAMKhuntiKSystematic screening for type 2 diabetes mellitus: results of a large population based study targeting those with conventional risk factorsDiabet Med200522 Suppl 299
- ZhangYEngelgoanMValdezREfficient cutoff points for three screening tests for detecting undiagnosed diabetes and pre-diabetesDiabetes Care20052861321132515920046
- AvenellABroomJBrownTSystematic review of the long-term effects and economic consequences of treatments for obesity and implications for health improvementHealth Technol Assess2004821iiiiv1182
- HernanWHBrandleMZhangPDiabetes Prevention Program Research GroupCosts associated with the primary prevention of type 2 diabetes mellitus in the diabetes prevention programDiabetes Care2003261364712502656
- ClarkePGrayAHolmanREstimating utility values for health states of type 2 diabetic patients using the EQ-5D (UKPDS 62)Med Decis Making200222434034912150599
- WaughNScotlandGMcNameePScreening for type 2 diabetes: literature review and economic modellingHealth Technol Assess20071117iiiivixxi1125
- TarrideJ-EHopkinsRBlackhouseGA review of methods used in long-term cost-effectiveness models of diabetes mellitus treatmentPharmacoeconomics201028425527720222752
- ChatterjeeRNarayanKMVLipscombJPhillipsLSScreening adults for pre-diabetes and diabetes may be cost-savingDiabetes Care20103371484149020587721
- American Diabetes AssociationImplications of the United Kingdom Prospective Diabetes StudyDiabetes Care200326 Suppl 1S28S3212502617
- SchauflerTMWolffMCost effectiveness of preventive screening for type-2-diabetes mellitus in GermanyAppl Health Econ Health Policy20108319120220408603