 ?Mathematical formulae have been encoded as MathML and are displayed in this HTML version using MathJax in order to improve their display. Uncheck the box to turn MathJax off. This feature requires Javascript. Click on a formula to zoom.
Abstract
Objectives
Hypertension is suboptimally treated in primary care settings. We evaluated the cost-effectiveness of the Heart and Stroke Foundation of Ontario’s Hypertension Management Initiative (HMI), an interdisciplinary, evidence-informed chronic disease management model for primary care that focuses on improving blood pressure management and control by primary care providers and patients according to clinical best practice guidelines.
Methods
The perspective of our analysis was that of the Ontario Ministry of Health and Long-Term Care with a lifetime horizon and 5% annual discount rate. Using data from a prospective cohort study from the HMI, we created two matched groups: pre-HMI (standard care), and post-HMI (n = 1720). For each patient, we estimated the 10-year risk of cardiovascular disease (CVD) using the Framingham risk equation and life expectancy from life tables. Long-term health care costs incurred with physician visits, acute and chronic care hospitalizations, emergency department visits, same-day surgeries, and medication use were determined through linkage to administrative databases, using a bottom-up approach.
Results
The HMI intervention was associated with significant reductions in systolic blood pressure (126 mmHg vs 134 mmHg with standard care; P-value < 0.001). These improvements were associated with a reduction in the 10-year risk of CVD (9.5% risk vs 10.7% in standard care; P-value < 0.001) and a statistically significant improvement in discounted life expectancy (9.536 years vs 9.516 in standard care; P-value < 0.001). The HMI cohort had a discounted mean lifetime cost of $22,884 CAD vs $22,786 CAD for standard care, with an incremental cost-effectiveness ratio of $4939 CAD per life-year gained.
Conclusion
We found that the HMI is a cost-effective means of providing evidence-informed, chronic disease management in primary care to patients with hypertension.
Introduction
Hypertension is a major risk factor for cardiovascular disease (CVD).Citation1 There is extensive literature on the importance of blood pressure (BP) control in reducing cardiovascular morbidity and mortality.Citation2–Citation4 Unfortunately, many patients in ambulatory settings are either unaware of their hypertensionCitation1 and/or receive suboptimal treatment.Citation5 Potential explanations include inconsistent application of evidence-based guidelines related to diagnosis or treatment, poor patient adherence, and physicians lacking the time or skill to provide necessary lifestyle recommendations. Therefore, a cost-effective, guidelines-based, chronic disease management model for primary care to reduce BP in high-risk CVD populations is of interest to policy makers.
The most common treatment strategies to manage hypertension are lifestyle modifications and drug therapy.Citation6 Effective lifestyle modifications include weight loss in overweight individuals, physical activity, moderate consumption of alcohol, increased consumption of fresh fruit and vegetables, reduced saturated fat content, reduced dietary sodium intake, and increased dietary potassium intake.Citation6 Regarding drug therapy, the use of diuretics, β-blockers, calcium channel blockers, angiotensin converting enzyme inhibitors, and angiotensin receptor blockers have been shown to reduce both mortality and morbidity among hypertensive patients.Citation6 Increasingly, it is apparent that alongside lifestyle modifications and drug therapy, additional complementary strategies are key in achieving BP targets.Citation7 Adherence strategies, such as coaching by a nurse or pharmacist (phone call or visit) and home titration to achieve BP control using physician-approved treatment protocols, have been advocated.Citation7
The Heart and Stroke Foundation of Ontario’s (HSFO) Hypertension Management Initiative (HMI) is an evidence-informed, primary care, interprofessional chronic disease management program designed to enhance the diagnosis, management, and control of hypertension by health care providers and patients according to clinical best practice guidelines.Citation6,Citation8 Evaluation of a 3-year demonstration project delivered in eleven primary care sites across Ontario, involving roughly 200 providers and 3600 patients, showed that the HMI improved provider practices and management of hypertension, provider–patient interactions, and patient self-management of hypertension, resulting in significant BP reduction in those patients with uncontrolled hypertension and more patients with BP controlled to target.Citation9
Nonetheless, there remains uncertainty about whether an improvement in overall BP in the high normal range translates into an improvement in life expectancy. Moreover, the economic impact of this initiative is unknown. Thus, the aim of this analysis is to evaluate the cost-effectiveness of the HMI in Ontario, Canada.
Methods
We performed a cost-effectiveness analysis to model health outcomes and costs in a cohort of patients with high BP, comparing two treatment strategies: (1) the HMI, designed to improve provider practices and management of essential hypertension, provider–patient interactions, and patient self-management of hypertension (cohort 2) versus (2) standard care (cohort 1). The perspective of this analysis was that of the Ontario Ministry of Health and Long-Term Care, the single third-party payer for health services in the province; the time horizon of our analysis was the patient’s lifetime. Only direct health care costs were incorporated. Costs were adjusted for inflation to 2010 Canadian dollars using the Bank of Canada Consumer Price Index.Citation10 Health outcomes and costs were discounted at 5% per year.Citation11 This study was approved by the Institutional Research Ethics Board at Sunnybrook Health Sciences Centre, Toronto, Ontario.
Intervention and Study Population
The main objectives of the HMI were to improve provider practices and the management of essential hypertension, patient–provider interactions, and patient self-management of hypertension, with the primary outcome being a sustainable reduction in patients’ BPs. This intervention was designed to achieve these objectives by incorporating inter-professional education, practice outreach and facilitation, an evidence-informed toolkit for health care providers, and self-management resources for patients in participating primary care practice teams.
The inter-professional education component consisted of a 2-day workshop held in Toronto, Ontario. Key discussion topics included implementing BP management recommendations through an introduction to systems approaches to health care change; motivational interviewing; a review of the program’s tools supporting patient self-management and the development of an interdisciplinary team-based practice plan.
Eleven primary care sites (ten Family Health Teams and one community health center) were identified and agreed to participate in this study. There was a total of 52 physicians and 17 nurse practitioners, each of whom was asked to recruit 100 to 200 patients at each site. Although all sites ultimately received the intervention, five sites were assigned to receive the intervention earlier (the “immediate intervention group”), while the remaining six sites received the intervention 9 months later (the “delayed intervention group”) and served to control for the effect of confounders that might have an impact on practice, independent of the study over that time periodCitation9 (see ). The immediate intervention sites enrolled patients from January 2007 to May 2007, while the delayed intervention sites enrolled patients from October 2007 to February 2008. The sites were contacted prior to the enrollment period and health care practitioners were informed they would be involved in the HMI, and thus expected to measure and record patients’ BPs.
Figure 1 HMI beta phase evaluation timeline.
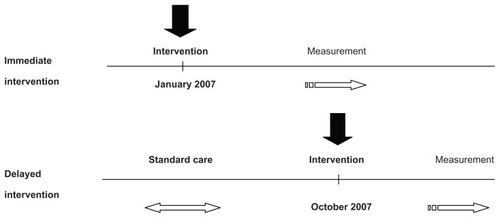
Potential study participants were identified from each clinic just before the intervention. Participating patients provided written consent when they were next seen in-clinic during the enrollment period. During the initial study visit, patients were also provided with information about the HMI and a baseline assessment was performed and documented. In the immediate group, BP measurements were taken following enrollment and then up to February 2008 as the follow-up BP readings. The delayed sites received their intervention in October of 2007 and baseline readings were taken during the enrollment period from October 1, 2007 to February 1, 2008.
Each team was asked to designate interdisciplinary clinical coaches from each of the three professions (physicians, nurses/nurse practitioners, and pharmacists) to promote inter-professional collaboration and to provide a link between the sites and the HSFO. Coaches attended an additional orientation session for this role and, during the course of the intervention, were in regular communication with the investigators at the HSFO. Practice facilitation was provided to support teams in integrating the program into their practices. The practice support specialists engaged regularly with teams using a variety of methods, including face-to-face meetings, teleconferences, and email, to answer questions, assist with identifying potential solutions for any identified concerns, and to review and assist teams with interpreting the practice reports.
Each site was provided with automated office BP monitors (BpTRU 300 device, BpTRU Medical Devices Ltd, Coquitlam, British Columbia, Canada) based on the number of physician and nurse practitioner full-time equivalents. The BpTRU monitors were installed and staff members were appropriately trained on proper technique before the monitors were used to measure patients’ BPs. Sites were also provided with evidence-informed hypertension flowsheets that incorporated the Canadian Education Hypertension Program Recommendations and the “5 As” model of behavior changeCitation12 to provide a sequence of evidence-based clinician and office practice behaviors (Assess, Advise, Agree, Assist, Arrange). The flowsheet functioned as a clinical documentation tool as well as a form for data collection and submission into the web-based data repository. The flowsheet was available in both paper and electronic format; the electronic format included both electronic medical record and direct web entry documentation. With patient consent, a copy of the patient’s information was securely exported from the practitioner’s electronic medical record into the project’s central, securely housed web-based clinical data repository. At paper-based sites, the paper forms were faxed by toll-free number to the data center and the data were optically scanned and aggregated into the web-based data repository. Confidential, comparative practice reports that included key clinical process and outcome measures were generated from the web-based clinical data repository and emailed to the key contacts at each site.
Patients involved in the study were asked to select a lifestyle area of focus and received booklets with information on BP self-management, a healthy eating fact sheet, and a personal health tracker logbook from their health care providers to help them track BP, blood glucose, cholesterol, and the progress of their selected lifestyle goals. They were also provided with instructions on how to access the HSFO website (http://www.heartandstroke.ca/bp/) to help them achieve their BP management goals, with the prime objective of changing patients’ lifestyle and health behaviors.
Further details on site selection and assignment, the components of the intervention, the prospective delayed evaluation design, the tools utilized, and visit-specific assessments are described elsewhere.Citation9
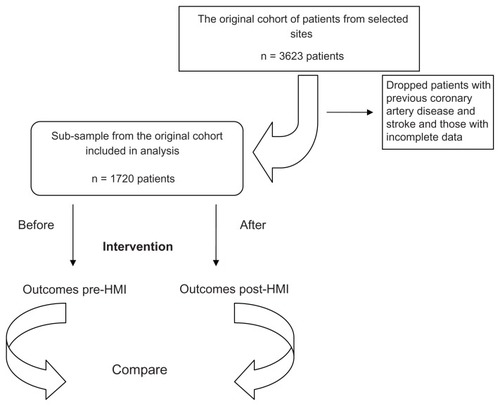
Data for this study were obtained from the 11 primary care sites across Ontario from the original cohort of the HMI patients with hypertension who were followed from 2007 to 2010 (n = 3623).Citation9 Given that the focus of our analysis was on primary prevention, patients with previous coronary artery disease (11%) and stroke (5%) were excluded from our analysis, leaving us with 2343 patients. Because the study design was not randomized, and to ensure that our analysis was between evenly matched groups, we used a pre- and post-intervention design, creating two hypothetical cohorts from the same group of patients: (1) a standard care cohort and (2) an intervention cohort. The standard care cohort consisted of all patients in the study based on cardiac risk profile immediately prior to intervention. This cohort was then compared to an intervention cohort, defined as all patients in the study based on their cardiac risk profile at last follow-up (after the intervention). By creating these two cohorts, we obtained two balanced groups that differed only in their risk factor profiles. We assumed that the differences in risk factors were due to the HMI intervention only. We restricted the analysis to patients with complete data at both time points, producing a final sample of 1720 patients (see ). We found that the initial sample of patients (n = 2343) did not differ from our final sample (n = 1720) in terms of sex composition, age, systolic and diastolic blood pressure levels, cholesterol (low-density lipoprotein [LDL] and high-density lipoprotein [HDL]) levels, percentage of smokers, and the percentage of patients with diabetes.
Figure 2 Study population.
Outcomes
Outcomes of interest were of two types: health and economic/cost outcomes. Health outcomes included the 10-year risk of CVD, defined as the composite of coronary death, myocardial infarction, coronary insufficiency and angina, cerebrovascular events, peripheral vascular disease, and heart failure; the 10-year risk of coronary heart disease (CHD), defined as the composite of coronary death, myocardial infarction, coronary insufficiency, and angina; the 10-year risk of cerebrovascular disease, including ischemic stroke, hemorrhagic stroke, and transient ischemic events; the 10-year risks of heart failure (HF), peripheral vascular disease (PVD), and end-stage renal disease (ESRD); and life expectancy measured in years. Economic outcomes included lifetime costs, and the incremental cost-effectiveness ratio (ICER) calculated as the incremental cost per life-year gained from the HMI relative to usual care.
Health outcomes
10-year CVD and component risks
We used the Framingham risk equation framework and results from a study by D’Agostino et alCitation13 to compute the 10-year risk of CVD for our sample of patients. D’Agostino et al used a Cox proportional hazards regression model to estimate the risk of developing CVD events, controlling for major risk factors such as age, sex, high BP, smoking, dyslipidemia, and diabetes (see Supplementary materials 1). We also calculated the 10-year risk of other cardiovascular outcomes such as CHD, stroke, HF, and PVD by applying calibration factors from the D’Agostino et al study. The relative risk (RR) associated with HMI for each of these outcomes was calculated as the ratio of the 10-year risk with HMI to the 10-year risk with standard care. ESRD risk could not be calculated from the Framingham risk equation. Instead, an estimate for the RR of ESRD was obtained from a meta-analysis of the literature, based on the mean BP reduction associated with HMI.Citation14
Life expectancy
To calculate the life expectancy of each patient, we employed a method that builds on the Framingham life tables available for patients based on gender, 10-year age band, and CVD risk.Citation15 We used linear interpolation to estimate life expectancy for each patient before and after the HMI. To estimate the discounted life expectancy for each patient, we assumed that life expectancy for each estimate using the Framingham life tables, as detailed above, represents the area under a parametric, exponential survival function S(t), where
Assuming a simple approximation of life expectancy (the “DEALE” methodCitation16) for each patient, we calculated an age-, sex-, and disease-specific mortality rate equivalent to the reciprocal of the life expectancy. Using these values, and applying a continous discounting rate of 5%, we estimated the discounted life expectancy for each patient, which reduces to:
(see Supplementary materials 2 for details and proof). We then calculated both the mean life expectancy and mean discounted life expectancy for both cohorts along with their respective 95% confidence intervals.
Costs
HMI costs
Costs of delivering the 3-year demonstration phase of the HMI program were obtained from the HSFO (namely the pilot sites where the interventions were implemented). These included costs associated with: (1) personnel; (2) supplies and services, such as IT development and maintenance costs associated with health records stored in a web-based data repository, market research, evaluation, legal fees, office supplies, and telecommunications; (3) equipment and program resources; (4) knowledge transfer and exchange activities; and (5) travel costs associated with outreach and practice support site visits (for staff and volunteers).
Personnel included a team of seven facilitators, one manager, and one director; staffing costs were based on annual salaries including benefits. Personnel costs also included expenses incurred for IT and clinical consultants. Equipment was comprised mainly of office BP monitors (BpTRUs) and home BP monitors (BpTRU 300 device, BpTRU Medical Devices Ltd). The mean set-up cost for each HMI site was $2260 CAD. Program resources consisted mainly of fact sheets and other promotional materials. Knowledge transfer and exchange activities included program orientation/training and the Hypertension Collaborative, a 2-day event organized and held by the HSFO. Categories of costs were inputted as the average cost per 30 patient-days for treatment, which we assumed was constant over the model’s time horizon.
Health-related costs
Standard care
We selected a “costing cohort” based on a sample of individuals from Statistics Canada’s Canadian Community Health Survey, Cycle 1.1 (2000–01).Citation17 Akin to our intervention cohort, these individuals were 25 years of age and older, had hypertension but no heart disease, and were living in Ontario at the time of the survey.
Long-term health-related costs for the standard care costing cohort were determined by linkage to population-based administrative databases at the Institute for Clinical Evaluative Sciences using encrypted unique patient identifiers.Citation18 For each patient, we determined the total utilization of health resources and costs during the observation window. Administrative records were available up to March 31, 2008, allowing cost estimates for a maximum follow-up period of 120 months. We identified all health-related resources utilized by patients within the study period and paid for by the Ontario Ministry of Health and Long-Term Care. The categories of costs included were physician visits, acute and chronic care hospitalizations, emergency department visits, same-day surgeries, and medication use.
Costs associated with physician visits and laboratory tests were obtained from the claims history in the Ontario Health Insurance Plan database, which includes fee-for-service claims submitted by physicians and other licensed health professionals in Ontario.Citation18 It also includes shadow billings from providers of organizations covered by other payment arrangements.
The Canadian Institute for Health Information Discharge Abstract Database contains records on the frequency and type of all acute and chronic care hospitalizations of patients. The Canadian Institute for Health Information discharge record includes a “most responsible” diagnosis and up to 15 additional diagnosis codes that can be used to estimate comorbidity, and procedure codes, length of stay and in-hospital mortality data.Citation18 The cost of hospitalization was estimated using the Resource Intensity Weights methodology.Citation18 We multiplied the Resource Intensity Weights associated with the case-mix group for each hospitalization by the average provincial cost per weighted case for all Ontario acute and chronic care hospitals.Citation18 This method provided a mean cost per hospitalization for cases assigned to a particular case-mix group category.
The National Ambulatory Care Reporting System database contains administrative, clinical, financial, and demographic data for hospital-based ambulatory care, including emergency department visits, outpatient surgical procedures, medical day/night care, and high-cost ambulatory clinics such as dialysis, cardiac catheterization, and oncology.Citation18 A similar Resource Intensity Weight methodology was used to determine the costs for emergency department visits and same-day surgeries, both using the National Ambulatory Care Reporting System.Citation18
Finally, data on medication costs were obtained from the Ontario Drug Database, which includes comprehensive drug utilization information on patients over 64 years, for whom full drug coverage is provided by the Ontario Ministry of Health and Long-Term Care.Citation18 Given our systems perspective, we did not include medication costs for patients under the age of 65 (these are usually not covered by the provincial government).
We used the phase-of-care method to estimate lifetime costs. In this approach, the cost trajectory over time is broken into distinct phases, characterized by different patterns of resource use, and thus, cost. Cost data are then combined with survival data to estimate costs over a fixed interval or lifetime.Citation19 Based on previous work in the cancer field, researchers have found that long-term health care costs are not constant over an individual’s lifetime. Rather, these costs vary according to the phase of treatment.Citation20 Most cancer applications employ three distinct costing phases: the initial care phase (after diagnosis); the terminal care phase (prior to death), and the continuing care phase (all the time in between the other two phases). For hypertension, we expected only two distinct phases since there does not appear to be a period of high resource utilization for hypertension around the index date. Thus, we assume one phase of relatively constant costs before death and another of high costs just prior to death.
Furthermore, we performed exploratory analyses of the trajectory of costs for our linked cohort, which confirmed our hypothesis that aggregate cost per unit time was characterized by two discrete costing phases. Through graphical analysis, we estimated the inflection point between the stable (Phase I) and pre-death (Phase II) phases occurred 6 months prior to death. Thus, individual patient costs were calculated for two phases and assigned to each one in a hierarchical fashion – if death occurred, the 180 patient-days preceding death were allocated to Phase II; any and all other remaining time was allocated to Phase I. Using this methodology, we were able to calculate the mean cost per 30 patient-days for both phases.
Interventional group cost
As the HMI reduced the 10-year risk of CVD and its components, we assumed the ongoing health care costs associated with the HMI would similarly be reduced. To determine the health care costs for the HMI cohort, we first partitioned phase 1 and 2 costs estimated for the standard care cohort, as detailed above, into costs associated with CHD, stroke, PVD, ESRD, and HF, using International Classification of Disease (ICD)-10 codes (see Supplementary materials, Table S1; CVD codes were taken from the Ontario IMPACT model;Citation21 renal codes were vetted by content experts). Each of the mean 30 patient-day costs for each category was multiplied by the RR associated with the HMI for that category.
We assumed that health care costs related to other diseases would be constant in both the standard and HMI cohorts. To determine the mean health care costs for the HMI cohort in both phases, we summed the category costs for CHD, stroke, PVD, ESRD, and HF, as calculated above, to the cost of the HMI intervention itself, and then finally to the constant health care costs related to other diseases. The HMI intervention cost was assumed to be constant over the entire time horizon of the analysis.
To estimate costs for each patient, the mean costs for each phase were applied to individual patient’s life expectancies in both the HMI and standard care cohorts. To do so, again we assumed that the life expectancy estimated for each patient was based on an exponential survival function. We partitioned this function into the stable phase and the 6-month period prior to death, and accordingly, applied the appropriate exponential survival function. Using this method, we were also able to obtain discounted lifetime costs (see Supplementary materials 3 for details and proof).
Cost-effectiveness analysis
The ICER was calculated as the difference in discounted mean costs between the intervention and standard care groups divided by the difference in mean discounted life expectancy. A 95% confidence interval around this estimate was estimated non-parametrically using 1000 bootstrap replications.
We imputed missing values for patients that did not have data on total and HDL cholesterol. Our imputation method filled in missing values for continuous variables using multivariate normal regression. This accommodated arbitrary missing value patterns and employed an iterative Markov chain Monte Carlo method to impute missing values.Citation22
One-way deterministic sensitivity analyses were performed to evaluate the robustness of our results. The ranges for the sensitivity analysis were obtained from 95% confidence intervals. We also performed a probabilistic sensitivity analysis using a second-order Monte Carlo simulation with 1000 iterations. Using a net-benefit frame-work, Citation23 a cost-effectiveness acceptability curve (CEAC) was produced using varying willingness-to-pay thresholds. A CEAC provides the probability that an intervention is cost-effective, compared with the alternative, for a range of maximum monetary values that a decision-maker may be willing to pay for a particular unit change in the outcome analyzed. We derived the CEAC from the joint distribution of incremental costs and incremental effects; we used non-parametric bootstrapping of the observed data to estimate these joint distributions.
The health outcomes and cost-effectiveness analyses were undertaken using Stata/IC 11 (StataCorp LP, College Station, TX). Long-term health-related costs were estimated using SAS v 9.1 (SAS Institute, Cary, NC). All P-values reported are for two-way-paired comparisons, with a P-value of <0.05 considered to be statistically significant.
Results
Baseline characteristics
The baseline characteristics of the patients included in our analysis are shown in . For our sample of 1720 patients, the HMI was associated with a statistically significant decrease in patients’ mean systolic BP from 134.4 mmHg to 126.6 mmHg (P < 0.001). In addition, there was a decrease in total cholesterol from 4.26 mmol/L to 3.95 mmol/L (P = 0.03).
Table 1 Cardiovascular risk factors among hypertension patients before and after the HMI
Health outcomes
The HMI was associated with a significant improvement in the predicted 10-year risk of all outcomes (). There was an 11% decrease in the 10-year risk of CVD (P < 0.001), with similar reductions in the risk of CHD, stroke, HF, and PVD. We found an 18% reduction in the risk of ESRD associated with the HMI. These reductions in risk for CVD translated to an improvement in mean undiscounted life expectancy of roughly 3.5 weeks (P < 0.001) (). When discounted at 5% per annum, mean life expectancy in the standard care cohort was 9.52 years versus 9.54 years in the HMI cohort (P < 0.001).
Table 2 10-year cardiovascular disease and component risks
Table 3 Life expectancy
Costs
The estimated mean 30 patient-day costs of the HMI and its components are found in . The estimated cost of the intervention per 30 patient-days was $29.22 CAD. The majority of this cost was attributed to staff and consultants and to the development and maintenance of the web-based data repository.
Table 4 Costs associated with the HMI
The major components that contributed to overall future health-related costs for both the stable and pre-death phases can be found in for both cohorts. For both standard care and the HMI patients, hospitalizations and physician services represented the bulk of costs. In the stable phase, hospitalizations and physician services accounted for the majority of health care expenses (37.5% and 33.8%, respectively). Medication accounted for 19%. In the 6-month pre-death phase, hospitalization accounted for most of the cost (78.6%), while physician services accounted for only 13.1%. In modeling the costs for the intervention cohort, we found that a relatively small proportion of overall costs were due to CHD, stroke, HF, PVD, or ESRD. For example, CHD accounted for only 6% for the stable phase and stroke only 7.1% for the 6-month pre-death phase.
Table 5 Long-term costs per 30 days, by costing phase
We found that the mean 30 patient-day costs in the stable phase were $251.31 CAD and $247.31 CAD for the standard and the HMI cohorts, respectively (). The corresponding costs for the pre-death phase were $4091.92 CAD and $3999.79 CAD, respectively. As expected, the HMI resulted in fewer hospitalizations, physician visits, ER visits, medical procedures, and medications for CVD and ESRD. If we exclude intervention costs, and focus solely on costs associated with health outcomes, we obtain a discounted net savings of $430.21 CAD per patient over their lifetime.
Incorporating the intervention costs of the HMI, the cumulative discounted lifetime cost associated with standard care was $22,785 CAD compared to $22,884 CAD for patients in the intervention group. The cost of the HMI was $4939 CAD per additional life-year gained (95% CI: [−$128,288 to $79,416]). The corresponding ICER value when costs and health effects were not discounted was $1729 CAD (see ).
Table 6 Life expectancy, cumulative costs, and incremental costeffectiveness of HMI and standard care
Sensitivity analysis
Deterministic (one-way) sensitivity analyses demonstrate that our results were sensitive to the cost of the intervention (see ); if the intervention cost fell from $29 CAD to $24 CAD per 30 patient-days, the intervention would be cost-neutral, with no difference in cost between the two groups (ICER = 0). For HMI costs greater than or equal to $79 CAD per 30 patient-days, the intervention would not be cost-effective as these values would lead to an ICER of $50,000 CAD or more. When we varied long-term health-related costs for both stable and pre-death phases by a range of 50%, the HMI remained cost-effective, with an ICER range of −$3499 CAD to $18,011 CAD (see ). We also calculated the value of the ICER for the case in which the discount rate was 0% (see ). When we imputed missing values for total and HDL cholesterol, we found qualitatively similar results for the relative risk (RR) of all outcomes and life expectancy for the original sample (n = 2343) (see Supplementary materials, Table S2).
Table 7 One-way sensitivity analysis
Finally, we estimated the probability that a given intervention will meet the CEA decision criterion, and hence, will be the optimal intervention, by calculating the CEAC. We found that the HMI was cost-effective in 60.9% of 1000 simulations of the PSA analysis, at a willingness-to-pay threshold of $50,000 CAD.
Discussion
Hypertension, often referred to as the “silent killer,” is a chronic health condition, affecting one in five adult Canadians,Citation24 yet many people with hypertension are unaware of their condition and one-third of Canadians with hypertension have not achieved treatment targets.Citation25 The HMI represents a multifaceted systems approach to treating hypertension in a primary care setting. The intervention’s effectiveness has been determined elsewhere.Citation9
In this paper, we performed a cost-effectiveness analysis of this guidelines-based, chronic disease management model for primary care for patients diagnosed with hypertension. We found that the HMI was associated with reductions in the 10-year risks of CVD, ESRD, and an improvement in estimated life expectancy. This survival benefit was compared to the overall health care costs associated with the implementation of the intervention. Our analysis suggests that the HMI is a cost-effective means of providing primary care to patients with hypertension.
We predicted improvement in CVD, CHK, stroke, HF, PVD, and ESRD with the HSFO’s HMI. These results were robust to changes in age and imputation of missing data. Moreover, these improvements translated into a longer life expectancy.
Patients managed with the HMI had fewer predicted hospitalizations for CVD and ESRD, which translated into lower costs incurred by the health care system. We estimated the savings to the health care system for hospitalizations, diagnostic tests, physician services, and medications to be approximately $430 CAD per patient over their lifetime. The cost of the HMI itself was estimated at $29 CAD per 30 patient-days, based on total expenses incurred during this research study. Importantly, we suspect that this is an overestimate, as many of the included costs, such as consulting fees, IT development, and research-associated costs, are fixed and therefore become less significant when we extend the program to larger patient groups. If extended to the entire population, economies of scale would certainly result in lower costs per patient. We estimated that if the HMI costs $23.76 CAD per patient, this intervention would in fact be cost-neutral.
In our base case analysis, the HMI was cost-effective at an ICER of $4939 CAD for life-year gained, substantially below the traditional willingness-to-pay threshold of $50,000 CAD per life-year gained.Citation26,Citation27 This compares favorably with similar hypertension-targeted interventions, namely a nurse-administered telemedicine program (which delivered a series of educational and problem-solving modules to hypertension patients) at the Durham Veterans Affairs Medical Center primary care clinic (ICER $42,457 US to $87,300 US per life-year saved).Citation28 Moreover, it compares favorably to other recently adopted cardiac technologies, such as an implantable cardioverter-defibrillatorCitation29 (ICER $213,543 CAD per quality-adjusted life-year gained) and drug-eluting stentsCitation30 (ICER $419,202 to $1,569,875 CAD per quality-adjusted life-year gained).
This intervention was targeted towards hypertension alone; however, as a benefit to more closely managed care, total cholesterol was also reduced. This phenomenon reinforces the potential applicability of this model to improving the management and outcomes of other chronic conditions and the importance of a comprehensive approach to primary and secondary prevention, targeting all risk factors.
This study must be interpreted within the context of several limitations. First, our estimates for the benefits of the HMI are based on 10-year risk from the Framingham population and extrapolations of life-tables from this dataset. These are not necessarily generalizable to real world effectiveness in Ontario. Second, we assumed that this reduction in the relative risk would translate directly to a decrease in hospitalizations for CVD and ESRD. The validity of these assumptions has not been empirically tested. Third, we found that the HMI led to a drop in blood pressure as well as in total cholesterol; however, given that the HMI is a behavioral intervention, we have no way to ascertain whether the effect of the intervention will persist for the rest of the patient’s life. In addition, our model did not consider quality of life differences between treatments. With more closely managed care, we would anticipate earlier identification of symptomatic deterioration and subsequent treatment. Therefore, we would expect that incorporating quality of life weights would amplify the differences observed between the HMI and standard care. Finally, our model was developed using multiple assumptions and extrapolations. As expected, there was a substantial amount of uncertainty in our estimates, as reflected in the wide confidence intervals around the ICER and in the CEAC curve, which showed that 39% of bootstrap replications were not cost-effective at a threshold of $50,000 CAD per life-year gained.
In conclusion, our analysis found that a community-based HMI is likely to result in meaningful health improvements at a reasonable cost. Further work would involve understanding whether the health changes associated with the HMI would be sustainable in the future. Policy implications of this work may involve widespread dissemination of the program within the province, and potential reductions in cardiovascular death and morbidity.
Acknowledgments
The Hypertension Management Initiative was developed, implemented, and funded by the Heart and Stroke Foundation of Ontario, with funding support from the Ontario Ministry of Health and Long-Term Care.
Dr Krahn holds the F Norman Hughes Chair in Pharmacoeconomics at the Faculty of Pharmacy, University of Toronto. Dr Tu is supported by a Tier 1 Canada Research Chair in Health Services Research and a career investigator award from the Heart and Stroke Foundation of Ontario. This study was supported by the Toronto Health Economics and Technology Assessment Collaborative and the Institute for Clinical Evaluative Sciences, both of which are funded by an annual grant from the Ontario Ministry of Health and Long-Term Care. The opinions, results and conclusions reported in this paper are those of the authors and independent from the funding sources. No endorsement by the Institute for Clinical Evaluative Sciences or the Ontario Ministry of Health and Long-Term Care is intended or should be inferred.
Supplementary materials
1) 10-year cardiovascular disease (CVD) and component risks
For each patient, we determined the 10-year risk of CVD using the Framingham risk equation:
where S0(t) is the baseline survival at follow-up time t, βi is the estimated regression coefficient (log hazard ratio; see from D’Agostinho et alCitation1), Xi is the log-transformed value of the ith risk factor (if continuous), X̄i is the corresponding mean, and p denotes the number of risk factors.
Risk estimation from Cox model
Example
Women (baseline 10-year survival 0.95012): For a 61-year-old woman who has not been treated for high blood pressure, has a total cholesterol of 180 mg/dL, high-density lipoprotein of 47 mg/dL, systolic blood pressure of 124 mmHg, and is a current smoker but is not diabetic (see Table 11 from D’Agostinho et alCitation1), the risk estimate based on the Cox model is computed as follows:
10-year risk of
Therefore, using calibration factors (see and from D’Agostinho et alCitation1), the 10-year risk of:
CHD = 0.1048 × 0.6086 = 0.06378,
stroke = 0.1048 × 0.2385 = 0.02499, and so forth.
Life expectancy
Assumption
On average, the CVD event will occur at the mid-point of the 10-year projection. Therefore, we will include 5 years on life-expectancy for CVD.
For each patient, the estimated life expectancy will be:
Example
A 50-year-old-man has a Rcvd of 0.13. Therefore, using from Peeters et al,
2) Discounted life expectancy
To calculate the discounted life expectancy (DLE), the life expectancy of each participant from above will be assumed to be the area under the curve of an exponential survival curve (S(t) = e−kt) for that particular patient.
Using the declining exponential approximation of life expectancy (DEALE) method, k can be calculated for each patient. Applying a continuous discounting rate, r, of 5%, the discounted LE is equal to the following:
Using this method, the discounted LE will be calculated for each participant in both the standard and interventional groups.
3) Continuous costs
The following steps are used to calculate continuous costs:
Convert the LE in years to LE in 30-day blocks. LE = LEyears × 365/30
Define the discount rate, R, in 30-day blocks. R = 0.05 × 30/365
Define C1, which is the mean 30-day cost for the stable phase
Define C2, which is the mean 30-day cost for the pre-death phase
Define t, which is time in 30-day blocks
Define x, which is time (in 30-day blocks), at which point, switch from the stable phase to the pre-death phase (note: in excel example, x = 6).
Therefore, for any period, t, the total proportion of a patient’s LE is S(t) = e−kt.
At time t, the proportion of patients who are in the stable phase is e−k(t + 6) and the proportion of patients who are in the pre-death phase is e−kt−e−k(t + 6).
Therefore, the total cost at any time period, t, is [C1(e−k(t + 6)) + C2(e−kt−e−k(t + 6))].
To determine the cost over time period 0-∞, the following closed integral must be solved:
For discounted costs, solve the following:
Table S1 Cost categories
Table S2 Life expectancy, cumulative costs and incremental cost-effectiveness of HMI and standard care (for imputed data)
Reference
- D’AgostinoRBSrVasanRSPencinaMJGeneral cardiovascular risk profile for use in primary care: the Framingham Heart StudyCirculation2008117674375318212285
- PeetersAMamunAAWillekensFBonneuxLA cardiovascular life history. A life course analysis of the original Framingham Heart Study cohortEur Heart J20022364586611863348
Disclosure
Sheldon W Tobe reports receiving lecture and/or consulting fees from companies manufacturing antihypertensive drugs. The authors report no other conflicts of interest.
References
- Health CanadaEconomic Burden of Illness in Canada, 1998OttawaHealth Canada2002 Ref Type: Report
- BorghiCDormiAL’ItalienGLapuertaPFranklinSSGaddiAThe relationship between systolic blood pressure and cardiovascular risk – results of the Brisighella Heart StudyJ Clin Hypertens (Greenwich)2003V475212556653
- NealBMacMahonSChapmanNBlood Pressure Lowering Treatment Trialists’ CollaborationEffects of ACE inhibitors, calcium antagonists, and other blood-pressure-lowering drugs: results of prospectively designed overviews of randomised trials. Blood Pressure Lowering Treatment Trialists’ CollaborationLancet20003561955196411130523
- TurnbullFNealBAlgertCBlood Pressure Lowering Treatment Trialists’ CollaborationEffects of different blood pressure-lowering regimens on major cardiovascular events in individuals with and without diabetes mellitus: results of prospectively designed overviews of randomized trialsArch Intern Med20051651410141915983291
- HajjarIKotchenTATrends in the prevalence, awareness, treatment, and control of hypertension in the United States, 1988–2000JAMA200329019920612851274
- HackamDGKhanNAHemmelgarnBRCanadian Hypertension Education ProgramThe 2010 Canadian Hypertension Education Program recommendations for the management of hypertension: part 2 – therapyCan J Cardiol201026524925820485689
- MargoliusDBodenheimerTControlling hypertension requires a new primary care modelAm J Manag Care201016964865020873951
- QuinnRRHemmelgarnBRPadwalRSCanadian Hypertension Education ProgramThe 2010 Canadian Hypertension Education Program recommendations for the management of hypertension: part I – blood pressure measurement, diagnosis and assessment of riskCan J Cardiol201026524124820485688
- TobeSWMoy Lum-KwongMVon SychowskiSKandukurKKissAFlintoftVHypertension Management Initiative (HMI): results of a prospective cohort studyJ Hum Hypertens (under submission)
- Bank of CanadaConsumer Price Index, 2000 to Present [Webpage on internet]Accessed September 13, 2010 Available from: www.bankofcanada.ca/en/cpi.html
- Guidelines for the Economic Evaluation of Health Technologies: Canada3rd edOttawaCanadian Agency for Drugs and Technologies in Health2006 (Report)
- GlasgowREEmontSMillerDCAssessing delivery of the five ‘As’ for patient-centered counselingHealth Promot. Int200621324525516751630
- D’AgostinoRBSrVasanRSPencinaMJGeneral cardiovascular risk profile for use in primary care: the Framingham Heart StudyCirculation2008117674375318212285
- SarnakMJGreeneTWangXThe effect of a lower target blood pressure on the progression of kidney disease: long-term follow-up of the modification of diet in renal disease studyAnn Intern Med200514234235115738453
- PeetersAMamunAAWillekensFBonneuxLA cardiovascular life history. A life course analysis of the original Framingham Heart Study cohortEur Heart J200223645846611863348
- BeckJRKassirerJPPaulkerSGA convenient approximation of life-expectancy (the “DEALE”). I. Validation of the methodAm J Med1982738838887148881
- Statistics Canada2000Canadian Community Health Survey, 2000–2001Cycle11Statistics Canada
- JacobsPYimRUsing Canadian Administrative Databases to Derive Economic Data for Health Technology AssessmentsOttawaCanadian Agency for Drugs and Technologies in Health2009 Available at http://www.cadth.ca/en/products/health-technology-assessment/publication/889
- RileyGFPotoskyALLubitzJDKesslerLGMedicare payments from diagnosis to death for elderly cancer patients by stage at diagnosisMed Care19953388288417637404
- BrownMLRileyGFPotoskyALEtzioniRDObtaining long-term disease specific costs of care: application to Medicare enrollees diagnosed with colorectal cancerMed Care1999371249125910599606
- WijeysunderaHCMachadoMFarahatiFAssociation of temporal trends in risk factors and treatment uptake with coronary heart disease mortality, 1994–2005JAMA2010303181841184720460623
- SchaferJLAnalysis of Incomplete Multivariate DataBoca Raton, FLChapman and Hall/CRC1997
- StinnettAAMullahyJNet health benefits: a new framework for the analysis of uncertainty in cost-effectiveness analysisMed Decis Making199818SupplS68S809566468
- JoffresMRHamtePRabkinSWGelskeyDHoganKFodorGPrevalence, control and awareness of high blood pressure among Canadian adults. Canadian Heart Health Surveys Research GroupCMAJ199246199722051596849
- JoffresMRHamtePMacLeanDRL’italienGJFodorGDistribution of blood pressure and hypertension in Canada and the United StatesAm J Hypertens2001141099110511724207
- UbelPAHirthRAChernewMEFendrickAMWhat is the price of life and why doesn’t it increase at the rate of inflation?Arch Intern Med20031631637164112885677
- GafniABirchSIncremental cost-effectiveness ratios (ICERs): The silence of the lambdaSoc Sci Med2006622091210016325975
- DattaSKOddoneEZOlsenMKEconomic analysis of a tailored behavioral intervention to improve blood pressure control for primary care patientsAm Heart J2010160225726320691830
- O’BrienBConnollySJGoereeRCost-effectiveness of the implantable cardioverter-defibrillator: results from the Canadian Implantable Defibrillator Study (CIDS)Circulation20011031416142111245646
- GoereeRBowenJMBlackhouseGEconomic evaluation of drug-eluting stents compared to bare metal stents using a large prospective study in OntarioInt J Technol Assess Health Care200925219620719331710