Abstract
Background
Influenza affects all age groups and is common in children. Between 15% and 42% of preschool- and school-aged children experience influenza each season. Recently, intranasal live attenuated influenza vaccine, trivalent (LAIV) has been approved in Canada.
Objective
The objective of this study was to determine the cost-effectiveness of LAIV compared with that of the injectable inactivated influenza vaccine, trivalent (TIV) in Canadian children and adolescents from both a payer (eg. Ministry of Health) perspective and a societal perspective.
Methods
A cost-effectiveness model comparing LAIV and TIV in children aged 24–59 months old was supplemented by primary (ie, a survey of 144 Canadian physicians) and secondary (eg, literature) data to model children aged 2–17 years old. Parameter uncertainty was addressed through univariate and probability analyses.
Results
Although LAIV increased vaccination costs when compared to TIV, LAIV reduced the number of influenza cases and lowered the number of hospitalizations, emergency room visits, outpatient visits, and parents’ days lost from work. The estimated offsets in direct and societal costs saved were CAD$4.20 and CAD$35.34, respectively, per vaccinated child aged 2–17 years old. When costs and outcomes were considered, LAIV when compared to TIV, was the dominant strategy. At a willingness to pay of CAD$50,000 per quality adjusted life year gained, or CAD$100,000 per quality adjusted life year gained, the probabilistic results indicated that the probability of LAIV being cost-effective was almost 1.
Conclusions
LAIV reduces the burden of influenza in children and adolescents. Consistent with previously reported results, vaccinating children with LAIV, rather than TIV, is the dominant strategy from both a societal perspective and a Ministry of Health perspective.
Introduction
Due to its high prevalence and associated morbidity and mortality, influenza is a major public health concern that affects millions of Canadians every year. It is estimated that every year between 2000 and 8000 Canadians die of influenza or its complications, depending on the seasonal severity.Citation1 Although influenza affects all age groups, influenza infection is most common in children, as between 15% and 42% of preschool- and school-aged children each season may experience influenza.Citation2 In addition, school-aged children spread influenza to other schoolchildren, family members, and members of the community.Citation3,Citation4 However, many children do not receive vaccinations or do not follow the recommended dose regimen,Citation4,Citation5–Citation7 despite the fact that immunization is one of the most effective and cost-effective ways to protect against influenza. There are currently two types of influenza vaccines available in Canada: intranasal live attenuated influenza vaccine, trivalent (LAIV; FLUMIST®; MedImmune, Gaithersburg, MD) and injectable trivalent inactivated influenza vaccine (TIV). Although LAIV is indicated for the prevention of influenza in Canadians aged between 2 and 59 years old,Citation8 the Canadian National Advisory Committee on Immunization recently stated that for healthy children and adolescents aged between 2 and 17 years old, “[a]vailable data indicates that LAIV would be preferred over TIV in this population, although the [National Advisory Committee on Immunization] recognizes that other programmatic considerations will impact the implementation of this recommendation in publicly funded programs.”Citation9 To help inform decision makers about the relative value of LAIV, the study objective was to determine the cost-effectiveness of LAIV and TIV in healthy Canadian children and adolescents.
Methods
Study overview
A cost-effectiveness modelCitation10 comparing LAIV and TIV in children aged 24–59 months was supplemented by primary (ie, a survey of 144 Canadian physicians) and secondary (eg, literature) data to model three age cohorts of Canadian children: 2–5 years of age, 6–9 years of age, and 10–17 years of age. Extrapolation of these results to healthy children aged 2–17 years old was conducted using Canadian age distribution statistics from Statistics Canada.Citation11 In the absence of dominance (ie, one alternative being less costly and more effective than the other alternative), the results were reported in terms of incremental cost per quality-adjusted life year (QALY) gained, as per the recommendations of the current Canadian guidelines for economic evaluations.Citation12 Univariate and probabilistic analyses were conducted, and both a Ministry of Health perspective and a societal perspective were considered. All costs were expressed in 2010 dollars and the model was built in Microsoft® Excel (1997–2003 Microsoft Excel, Microsoft Corporation, Redmond, WA).
Model structure and time horizon
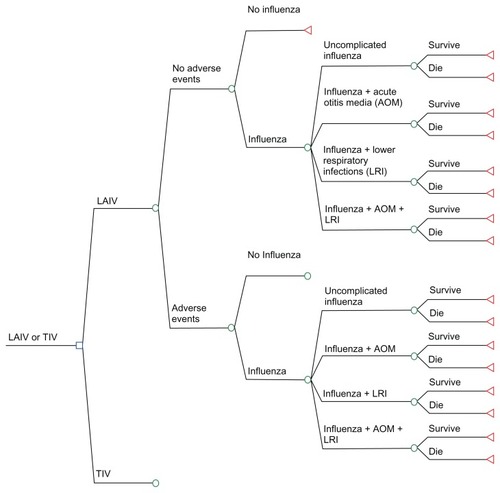
As shown in , children can develop vaccine-related adverse events (AEs) following the administration of LAIV or TIV (eg, fever, runny nose, sore arm). In both cases (no AEs or AEs), two outcomes are possible: no influenza or influenza. Influenza can present as either uncomplicated influenza, influenza with acute otitis media (AOM), influenza with lower respiratory infections (LRI), or influenza with AOM and LRI. Children could survive or die following influenza. As children are vaccinated against influenza with either LAIV or TIV, the basic structure of the two treatment arms was similar. A 12-month time horizon was used in the analysis to capture all costs and outcomes associated with an influenza episode.
Figure 1 Model structure.
Vaccine effectiveness
The efficacy of LAIV and TIV was taken from the re-analysisCitation10 (and MedImmune LLC, data on file, 2007) of a large head-to-head double-blind randomized trial comparing LAIV and TIV in children aged 6–59 months (the Belshe et al trial),Citation13 to determine the relative efficacy of LAIV in children aged 24–59 months. Results indicated that among those children aged 24–59 months who developed influenza (4.90% and 10.46% of those vaccinated with LAIV and TIV, respectively), the vast majority had uncomplicated influenza (4.30% in the LAIV group and 8.64% in the TIV group), while a small proportion experienced influenza with AOM (0.23% and 1.00% for the LAIV and TIV arms, respectively), or influenza with LRI (0.37% and 0.82% for the LAIV and TIV arms, respectively)Citation10 (and MedImmune LLC, 2007). Since recent evidence surrounding LAIV suggests there is no difference in efficacy in healthy children by age or circulating influenza subtype,Citation14,Citation15 it was assumed that the relative efficacy of LAIV compared with TIV was similar in the three age groups.
Since the severity of influenza may change depending on age group and in the absence of Canadian primary and secondary data for children aged older than 5 years, 144 Canadian physicians were surveyed to estimate the breakdown of influenza by age group in terms of: (1) uncomplicated influenza, (2) influenza with AOM, (3) influenza with LRI and (4) influenza with AOM and LRI. As a reference point, physicians were provided with the values used by Belshe et alCitation13 for children aged 2–5 years old (ie, 82%–88% of all influenza episodes were uncomplicated influenza). Physicians were asked to validate these estimates for children aged 2–5 years old and to provide an estimate for the two other age groups (ie, 6–9 years of age and 10–17 years of age). The resulting influenza breakdown was applied to the overall efficacy of LAIV and TIV for each age group assuming no differences in severity of influenza between arms, as shown in . The probabilities of vaccine-related AEs (medically significant wheezing [MSW] occurring within 42 days following vaccination, injection-site reactions, and reactogenicity events occurring within 10 days following vaccination) and influenza-related mortality (0.0001% for uncomplicated influenza and influenza with AOM, and 0.0025% for influenza + LRI and influenza + AOM + LRI) were taken from the re-analysisCitation10 (and MedImmune LLC, 2007) of the trial conducted by Belshe et al.Citation13 These results were adjusted for the two other age groups, assuming that the rate of influenza in children older than 5 years of age was similar between treatment arms. Contrary to Luce et al,Citation10 AEs related to the injection site only were assumed to be 0 for LAIV (vs 5.35% in Luce et alCitation10), while AEs related to runny or stuffy nose only were set at 0 for TIV (vs 7.5% in Luce et alCitation10). Since MSW is unlikely to occur in older children, we assumed a zero probability of MSW in children aged 10–17 years old. To reflect that the AEs related to the influenza vaccination decrease with age, injection site events for older children were adjusted based on the study conducted by Prosser et al ().Citation16 For example, Prosser et alCitation16 assumed that the probability of an injection-site reaction decreased from 0.0025 in children aged 2–5 years old to 0.001 in children aged 5–11 years old, and to 0.0003 in children aged 12–17 years old.
Table 1 Clinical probabilities
Calculations of QALYs
On a scale from 0 (death) to 1 (perfect health), the model attributes utilities of 0.558 to uncomplicated and complicated influenza,Citation17 0.851 to MSW,Citation18 and 0.9333 to noninfluenza or to a nonwheezing period,Citation19 as per Luce et al.Citation10 The average number of symptom days was derived from the Belshe et al trialCitation13 (4.03 for uncomplicated influenza, 11.06 for complicated influenza, and 12.78 for MSW), and this information was applied across the three age groups. To calculate QALYs, utilities were weighted by time spent in health states (eg, number of symptom days).Citation20 As an illustration, the average annual QALYs associated with influenza were calculated as: [0.558 (ie, utility of influenza) × 4.03 days (average number of days with uncomplicated influenza)] + [0.933 (ie, utility without influenza) × 361.22 days (average number of days with no influenza)]. Similar calculations were used to calculate the QALYs associated with MSW and complicated influenza.
Resource utilization and unit costs
The model considers resource utilization and costs incurred by the Ministry of Health (eg, vaccine-, AE-, and influenza-related costs). To reflect a societal perspective, indirect costs incurred by parents (eg, over-the-counter medications, transportation costs, and the cost of lost days of work or usual activities performed by parents due to the children’s vaccination or influenza episodes) were also analyzed. The probabilities of office visits were calculated by multiplying the rates of MSW, as well as the rates of complicated and uncomplicated influenza (as given in ) by the corresponding number of physician visits, which were derived from the physician survey (). The probabilities of influenza-related hospitalizations for LAIV and TIV across each age group were calculated using Canadian data from the Sebastian et al study,Citation21 and were applied to the Belshe et al trial (MedImmune, 2007).Citation13
Table 2 Resource utilization
In the absence of Canadian data, the probability that children aged 2–5 years old would undergo hospitalizations following MSW was taken from Luce et alCitation10 and applied to the other age groups, assuming equal rates between treatment arms. Furthermore, the length of stay associated with hospitalizations, the proportion of emergency room (ER) visits due to influenza or MSW, as well as medical management of influenza and MSW, were also taken from Luce et al’sCitation10 study. To calculate the amount of time lost by caregivers, our panel of physicians was asked to estimate the proportion of medical visits across each age group in which at least one parent accompanied their child (ie, 100% of the time for the children aged 2–9 years old and 75% of the time for the older age group), as well as the percentage of office visits in which the children attended strictly to receive the influenza vaccine (ie, 32% of the time). The model assumed that only one parent would accompany the children, and it was identified that the parent who always attended these consultations was the mother. Canadian data were used to identify the proportion of mothers who were employed full-time (54%), part-time (19%), and to calculate the average transportation costs spent to travel to the physician’s office (CAD$1.32).Citation22–Citation24 Time lost from work (full time worker) or from usual activities (mother not working) due to vaccination was only applied when the purpose of the visit was only to receive an influenza vaccination as determined by the physicians. Time lost due to an influenza episode was based on the number of febrile days observed in the Belshe et al trial,Citation13 which was assumed to be similar between treatment arms and older age groups (ie, from 3.00 days to uncomplicated influenza to 3.52 days for influenza + AOM).
The cost per dose of LAIV (CAD$14.00) was provided by the manufacturer, while the weighted average cost of a dose of TIV was calculated at CAD$9.59 based on IMS Drugstore and Hospital sales for January 2010 (data on file, AstraZeneca Canada). Costs related to the administration of the vaccine were taken from Sanders et al,Citation25 while other costs were derived from public sources in Ontario or Canada (). For children with previous vaccinations (37% and 42% for children aged 2–5 and 6–9 years old, respectively, as per the results of the physician survey), it was assumed that one dose of LAIV or TIV would be administered. It was also assumed that two doses of the vaccine were to be given to all children with no previous influenza vaccination. As per the guidelines of the Canadian Paediatric Society, children aged 9 years or older were assumed to receive one dose of the vaccine.Citation26
Table 3 Unit costs
Incremental cost-effectiveness analyses
The base case scenario evaluates the cost-effectiveness of vaccinating children for the first time with LAIV as opposed to TIV, taking into account that approximately 63% of children aged 2–5 years old have never been vaccinated for influenza, as per the physician survey. Three age groups were modeled and the results were extrapolated to healthy children aged between 2 and 17 years old using Statistics Canada data on Canadian age distribution.Citation11 As of July 1, 2008, out of 6,206,814 Canadian children aged between 2 and 17 years old, 23% were aged 2–5 years old (1,417,525) and 23% were aged 6–9 years old (1,442,144). Children aged 10–17 years old accounted for 54% of this population (3,347,145). These percentages were used to calculate the expected costs and benefits of vaccinating children aged 2–17 years old. The base case analysis did not include any benefits derived from the prevention of influenza transmission within a household resulting from vaccinating children against influenza.
In a secondary analysis, we evaluated the impact of including secondary wild-type influenza virus transmission among household members. In this scenario, it was assumed that 18% of contacts per influenza case contracted influenza.Citation31 Time lost by each parent (either from work or from performing their usual daily activities) due to influenza transmitted from the child was also considered in this scenario.
Univariate and probabilistic sensitivity analyses
Variables tested in univariate sensitivity analyses included, but were not limited to, the relative risk reduction of LAIV versus TIV (from 70% to 30%; base case: 54%); the price of TIV vaccine (from CAD $9.59 to $7); the percentage of children requiring two doses (ranging from 0% to 100%); and all unit costs (±20% of the base case costs). Probabilistic analyses in which all parameters for LAIV and TIV were varied simultaneously according to specified distributions were conducted using Monte Carlo techniques. According to good modeling practices,Citation32 beta distributions were used to represent the uncertainty associated with probabilities (eg, the probability of developing MSW) or utilities. Gamma distributions and trimmed normal distributions were used for the cost and length of stay data, respectively. Both the beta and gamma distributions were fitted by the method of moments.Citation32 presents the characteristics of the distributions used in the probabilistic sensitivity analyses for the main study parameters. When measures of dispersion were not available, the following conventions were used to fit the distributions used in the probabilistic sensitivity analyses. Standard errors were assumed to be 20% of the mean values associated with proportions (eg, influenza) and unit costs other than hospitalization costs (eg, drug costs). Standard errors were assumed to be 100% of the mean hospitalization costs and 10% for the utility data. A total of 1000 simulations were conducted and the uncertainty associated with the parameters was represented using cost-effectiveness acceptability curves.Citation32 It should be noted that the uncertainty associated with the effectiveness of the vaccines was not incorporated by fitting a distribution to the relative effectiveness of LAIV when compared with TIV, but rather by varying the effectiveness of each vaccine. As such, different distributions were assigned to LAIV and TIV ().
Table 4 Distributions used for the probabilistic sensitivity analyses
Results
Due to the increased efficacy of LAIV compared with TIV in preventing influenza in children, the additional cost of LAIV was offset by the decrease in costs associated with AE management, outpatient physician visits, ER visits, and hospitalizations for all age groups (). Indirect costs were also reduced with LAIV. In terms of outcomes (), vaccinating 100,000 healthy children aged 2–17 years old with LAIV instead of TIV was estimated to gain 34 QALYs. Vaccinating these children was also found to prevent around 5500 cases of influenza, 10,000 physician visits, 1000 ER visits, and 17,500 days lost of which 11,500 were the equivalent of full -time days lost from work ().
Table 5 Costs resultsTable Footnote*
Table 6 Clinical outcome results per 100,000 vaccinated children
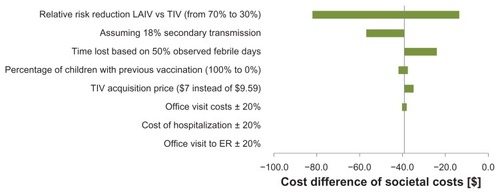
When a reduction in secondary transmission of the wild-type virus to household contacts was modeled across all age groups, LAIV was associated with additional cost savings when compared to TIV. From a societal perspective, the savings increased from CAD$39.03 to CAD$56.77 for children aged 2–5 years old, from CAD$33.03 to CAD$50.77 for children aged 6–9 years old, and from CAD$34.75 to CAD$52.48 for children aged 10–17 years old. The results of other univariate sensitivity analyses indicated that these results were robust against changes in the price differential between LAIV and TIV, and robust against changes in relative risk reductions associated with LAIV versus TIV. The results also held up against other model assumptions ().
Figure 2 Tornado diagram (societal perspective, children aged 2–5 years old – savings of CAD$39.00 in the base case analysis).
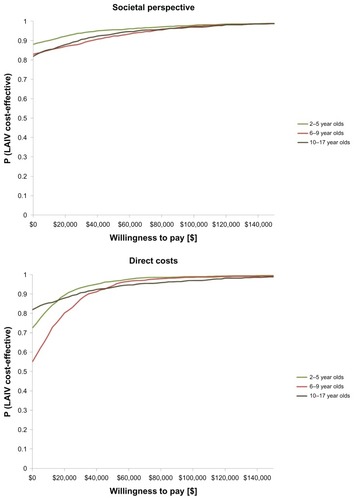
The results of the probabilistic sensitivity analyses are shown in , which presents the cost-effectiveness acceptability curves. Results indicated that if society was willing to pay CAD$50,000 per QALY (societal perspective), the probability of LAIV being cost-effective was 0.96 for children aged 2–5 years old, 0.92 for children aged 6–9 years old, and 0.94 for children aged 10–17 years old. At CAD$100,000 per QALY, these probabilities increased to close to 1 for all age groups. Similarly, from a Ministry of Health perspective, the probability of LAIV being cost-effective for all direct health care costs was almost 1 for all age groups at commonly accepted thresholds ().
Figure 3 Cost-effectiveness acceptability curves.
Discussion
Similar to the previous US cost-effectiveness analysis of LAIV versus TIV administration in children aged 2–5 years old,Citation10 the results of this study indicated that LAIV was the dominant influenza vaccination strategy used in healthy children aged 2–5 years old from both a societal and a Ministry of Health perspective. LAIV was also found to be the dominant strategy for the other two age groups and for Canadian children aged 2–17 years old, despite the fact that conservative assumptions were used when extrapolating the results observed in the Belshe et al trialCitation13 to an older population of healthy children. When all model parameters were simultaneously varied, the results of the probabilistic analyses indicated that the probability of LAIV being cost-effective in comparison to TIV was almost one at commonly accepted thresholds (eg, CAD$50,000 and CAD$100,000 per QALY gained). When secondary transmission was modeled, LAIV provided additional benefits at a lower cost. Although we did not include this scenario as our base case analysis to provide a more conservative estimated benefit, recent Canadian data suggest that these protective effects may be even larger than those anticipated in our analyses.Citation33 Similarly, other potential benefits of LAIV were not modeled, such as increased vaccination compliance due to LAIV needle-free administration,Citation34 substantial efficacy following a single dose in previously unvaccinated young children,Citation35,Citation36 and an approximate efficacy rate of 60% through a second influenza season without revaccination.Citation37
Several limitations were associated with this study. In comparing LAIV and TIV, the study relied on a large randomized controlled trial of primarily healthy children and it is not known how these results apply to children with asthma or wheezing. However, it is very unlikely that the results would change significantly given that similar relative efficacy results were observed in young children with a history of recurrent respiratory tract illnesses and in older children and adolescents with asthma.Citation38,Citation39 We also assumed that the relative efficacy of LAIV compared with TIV was similar across age groups. Although this assumption was supported for LAIV, as per recent analyses of LAIV evidence,Citation14,Citation15 we assumed the same for TIV in a conservative approach.
In the absence of head-to-head trials in older healthy children, data regarding the rates of other outcomes following influenza in children aged 24–59 months old were sometimes used to model the two other age groups. To mitigate the impact of this assumption, we always assumed equality between the two treatments. In addition, sensitivity analyses decreasing the relative efficacy of LAIV when compared to TIV in all age groups indicated that LAIV was still the dominant strategy (from a societal perspective) even when the efficacy rate was reduced to 30% (as compared with 54%). Noncompliance to vaccination schedules for children aged less than 9 years old was not modeled, although this is a frequent problem in real life. However, this assumption should not adversely affect the relative efficacy of LAIV compared with TIV, as LAIV has shown high efficacy following a single dose in previously unvaccinated children.Citation15,Citation36
Although we did not include secondary transmission of influenza in the base case analysis, LAIV was found to provide additional benefits at a lower cost when secondary transmission was modeled; however, the model structure used in our analysis (ie, the decision tree) cannot fully deal with the spread of disease between individuals. The use of transmission models characterizing the population as being susceptible to infection, being infected, or being infectious to others is an important avenue of research to evaluate the cost-effectiveness of influenza vaccines. We did not model a “no vaccination” strategy; rather, we used data from a head-to-head trial comparing two vaccines.
It should also be noted that this trial was conducted during the 2004–2005 influenza season, which was a mild to moderate influenza season. As such, the results may not be generalizable to severe influenza seasons. In the absence of pediatric utility data, we followed the approach used by Luce et al,Citation10 which was to use adult utility values as proxy. Although utility data derived from a pediatric population is the preferred option when modeling populations of children and adolescents, changing the utility values associated with no influenza, influenza, or MSW should not affect the overall conclusion (eg, more QALYs generated with LAIV).
Finally, a value of information analysis was not conducted to determine if there would be value in conducting additional research to reduce the remaining uncertainty associated with the results. However, this situation is unlikely since the results of the probabilistic sensitivity analyses indicated that the probability of LAIV being more cost-effective than TIV was almost one at commonly cited thresholds. In addition, the results of the sensitivity analyses indicated that LAIV was still cost saving, even when the relative risk reduction of LAIV compared with TIV was decreased from 70% to 30% ().
Despite these limitations, this study also had several strengths. First, the study used data from a large head-to-head randomized trial comparing LAIV and TIV in children aged 2–5 years old and conservative assumptions were used when it was necessary to extrapolate the results to older children. Second, we surveyed 144 Canadian physicians to estimate several key variables not available from the literature (eg, number of physician visits). The large number of physicians answering the survey and the variety of their geographical locations provided a good representation of the treatment of influenza in Canadian primary care practices. Finally, to take into account the uncertainty associated with key model parameters, we conducted a probabilistic analysis as well as several univariate sensitivity analyses; in all scenarios, LAIV was still the dominant strategy.
In conclusion, vaccinating Canadian children between the ages of 2–17 years old with LAIV instead of TIV was found to be the dominant strategy from both a societal and a Ministry of Health perspective.
Acknowledgments
This study was funded through an unrestricted grant from AstraZeneca Canada. At the time of study, Drs Daria O’Reilly, Jean-Eric Tarride, and Feng Xie were recipients of Career Scientist Awards from the Ontario Ministry of Health and Long-term Care. Since May 28, 2012 Jean-Eric Tarride’s primary affiliation has been with AstraZeneca Canada, Ontario, Canada.
Disclosure
The authors report no conflicts of interest in this work.
References
- Influenza [homepage on the Internet]OttawaPublic Health Agency of Canada [updated February 12, 2012; cited June 27, 2010]. Available from: http://www.phac-aspc.gc.ca/influenza/index-eng.phpAccessed June 27, 2010
- American Academy of Pediatrics Committee on Infectious DiseasesRecommendations for influenza immunization of childrenPediatrics200411351441144715121970
- GlezenWPCouchRBInterpandemic influenza in the Houston area, 1974–1976N Engl J Med197829811587592628375
- WeyckerDEdelsbergJHalloranMEPopulation-wide benefits of routine vaccination of children against influenzaVaccine200523101284129315652671
- Centers for Disease Control and PreventionEstimates of Influenza Vaccination Target Population Sizes in 2006 and Recent Vaccine Uptake LevelsAtlanta, GACenters for Disease Control and Prevention2006 Available from: http://www.cdc.gov/flu/professionals/vaccination/pdf/targetpopchart.pdfAccessed June 27, 2010
- JacksonLANeuzilKMBaggsJCompliance with the recommendations for 2 doses of trivalent inactivated influenza vaccine in children less than 9 years of age receiving influenza vaccine for the first time: a Vaccine Safety Datalink studyPediatrics200611852032203717079576
- McIntoshKLieuTIs it time to give influenza vaccine to healthy infants?N Engl J Med2000342427527610648771
- FLUMIST® (influenza vaccine, live, attenuated, intranasal spray) [product monograph]Mississauga, ONAstraZeneca Canada2010 Available at http://www.astrazeneca.ca/cs/Satellite?blobcol=urldata&blobheader=application%2Fpdf&blobheadername1=Content-Disposition&blobheadername2=MDT-Type&blobheadervalue1=inline%3B+filename%3DProduct-Monograph.pdf&blobheadervalue2=abinary%3B+charset%3DUTF-8&blobkey=id&blobtable=MungoBlobs&blobwhere=1285635966235&ssbinary=true
- National Advisory Committee on ImmunizationRecommendations on the use of live, attenuated influenza vaccine (FluMist®): Supplemental statement on seasonal influenza vaccine for 2011–2012Can Commun Dis Rep [serial on the Internet]. 2011 [cited March 26, 2012];37 [about 8 pp]. http://www.phac-aspc.gc.ca/publicat/ccdr-rmtc/11vol37/acs-dcc-7/recom-eng.phpAccessed March 26, 2012
- LuceBRNicholKLBelsheRBCost-effectiveness of live attenuated influenza vaccine versus inactivated influenza vaccine among children aged 24–59 months in the United StatesVaccine200826232841284818462851
- Statistics Canada[Database on the Internet] Table 051-0001 - Estimates of population, by age group and sex for July 1, Canada, provinces and territories, annual, CANSIM2008 Available at: http://cansim2.statcan.gc.ca/cgi-win/cnsmcgi.pgm?Lang=E&ArrayId=510001&Array_Pick=1&RootDir=CII/&ResultTemplate=CII/CII
- Canadian Agency for Drugs and Technologies in Health (CADTH)Guidelines for the Economic Evaluation of Health Technologies: Canada3rd edOttawa, ONCADTH2006
- BelsheRBEdwardsKMVesikariTCAIV-T Comparative Efficacy Study GroupLive attenuated versus inactivated influenza vaccine in infants and young childrenN Engl J Med2007356768569617301299
- BelsheRBTobackSLYiTAmbroseCSEfficacy of live attenuated influenza vaccine in children 6 months to 17 years of ageInfluenza Other Respi Viruses20104314114520409210
- RhorerJAmbroseCSDickinsonSEfficacy of live attenuated influenza vaccine in children: A meta-analysis of nine randomized clinical trialsVaccine20092771101111019095024
- ProsserLABridgesCBUyekiTMHealth benefits, risks, and cost-effectiveness of influenza vaccination of childrenEmerg Infect Dis200612101548155817176570
- MauskopfJACatesSCGriffinADNeighborsDMLambSCRutherfordCCost effectiveness of zanamivir for the treatment of influenza in a high risk population in AustraliaPharmacoeconomics200017661162010977398
- RevickiDALeidyNKBrennan-DiemerFSorensenSTogiasAIntegrating patient preferences into health outcomes assessment: the multiattribute Asthma Symptom Utility IndexChest1998114499810079792568
- MittmannNTrakasKRisebroughNLiuBAUtility scores for chronic conditions in a community-dwelling populationPharmacoeconomics199915436937610537955
- DrummondMFSculpherMJTorranceGWO’BrienBJStoddardGLMethods for the Economic Evaluation of Health Care Programmes3rd edOxfordOxford University Press2005
- SebastianRSkowronskiDMChongMDhaliwalJBrownsteinJSAge-related trends in the timeliness and prediction of medical visits, hospitalizations and deaths due to pneumonia and influenza, British Columbia, Canada, 1998–2004Vaccine200826101397140318280620
- Statistics CanadaWomen in Canada: A Gender-based Statistical Report1Fifth edition Catalogue no. 89-503-XPE0-660-19504-6 Available at: http://publications.gc.ca/Collection-R/Statcan/89-503-X/0010589-503-XIE.pdf
- Natural Resources CanadaThe Atlas of CanadaAverage distance to the nearest family physician1998 Available at: http://atlas.nrcan.gc.ca/site/english/maps/health/ruralhealth/distancephysicians/distancephysicianspecialist/1
- Canadian Automobile AssociationDriving costs http://www.caa.ca/documents/DrivingCostsBrochure-jan09-eng-v3.pdf
- SanderBKwongJCBauchCTEconomic appraisal of Ontario’s Universal Influenza Immunization Program: a cost-utility analysisPLoS Med201074e100025620386727
- Canadian Paediatric SocietyInfluenza vaccine recommendations for children and youth for the 2008–2009 seasonPaediatr Child Health200813868869119436524
- Canadian Institute for Health Information (CIHI) [database on the Internet] Available at: http://www.cihi.ca/CIHI-ext-portal/internet/EN/Home/home/cihi000001
- Ontario Health Insurance (OHIP) Schedule of Benefits and Fees [database on the internet]. Available at: http://www.health.gov.on.ca/english/providers/program/ohip/sob/facility/ihf_mn.html
- Ontario Case Costing Initiative [Webpage on the Internet]. Available at: http://www.occp.com/mainPage.htmAccessed August 13, 2012
- Statistic Canada: [Database on the Internet]Earnings, average hourly for hourly paid employees by industry Available at: http://www41.statcan.gc.ca/2009/2621/tbl/cybac2621_2009_000_t10-eng.htm
- HaydenFGBelsheRBCloverRDHayAJOakesMGSooWEmergence and apparent transmission of rimantadine-resistant influenza A virus in familiesN Engl J Med198932125169617022687687
- BriggsAClaxtonKSculpherMDecision Modelling for Health Economic EvaluationNew York, NYOxford University Press2006
- LoebMRussellMLMossLEffect of influenza vaccination of children on infection rates in Hutterite communities: a randomized trialJAMA20103031094395020215608
- TaddioAIppMThivakaranSSurvey of the prevalence of immunization non-compliance due to needle fears in children and adultsVaccine201230324807481222617633
- HullHFO’ConnorHOptimizing protection against influenza in children eligible for the vaccine for children programPediatr Infect Dis J2010291091091420431426
- BlockSLTobackSLYiTAmbroseCSEfficacy of a single dose of live attenuated influenza vaccine in previously unvaccinated children: a post hoc analysis of three studies of children aged 2 to 6 yearsClin Ther200931102140214719922885
- AmbroseCSYiTWalkerREConnorEMDuration of protection provided by live attenuated influenza vaccine in childrenPediatr Infect Dis J200827874474818600188
- FlemingDMCrovariPWahnUCAIV-T Asthma Study GroupComparison of the efficacy and safety of live attenuated cold-adapted influenza vaccine, trivalent, with trivalent inactivated influenza virus vaccine in children and adolescents with asthmaPediatr Infect Dis J2006251086086917006278
- AshkenaziSVertruyenAAristeguiJCAIV-T Study GroupSuperior relative efficacy of live attenuated influenza vaccine compared with inactivated influenza vaccine in young children with recurrent respiratory tract infectionsPediatr Infect Dis J2006251087087917006279