 ?Mathematical formulae have been encoded as MathML and are displayed in this HTML version using MathJax in order to improve their display. Uncheck the box to turn MathJax off. This feature requires Javascript. Click on a formula to zoom.
Abstract
Background
Depression has a lifetime prevalence of 10%–25% among women and 5%–12% among men. Selective serotonin reuptake inhibitors (SSRIs) are the most used and the most cost-effective treatment for long-term major depressive disorder. Since the introduction of generic SSRIs, the costs of branded drugs have been questioned. The objective of this study was to assess the cost-effectiveness (€ per quality-adjusted life year [QALY]) of escitalopram (which is still covered by a patent) compared with paroxetine, sertraline, and citalopram, the patents for which have expired.
Methods
A decision analytic model was adapted from the Swedish Dental and Pharmaceutical benefits agency model to reflect current clinical practice in the treatment of depression in Italy in collaboration with an expert panel of Italian psychiatrists and health economists. The population comprised patients with a first diagnosis of major depressive disorder and receiving for the first time one of the following SSRIs: escitalopram, sertraline, paroxetine, and citalopram. The time frame used was 12 months. Efficacy and utility data for the original model were validated by our expert panel. Local data were considered for resource utilization and for treatment costs based on the Lombardy region health service perspective. Several scenario simulations, oneway sensitivity analyses, and Monte Carlo simulations were performed to test the robustness of the model.
Results
The base case scenario showed that escitalopram had an incremental cost-effectiveness ratio (ICER) of €4395 and €1080 per QALY compared with sertraline and paroxetine, respectively. Escitalopram was dominant over citalopram, which was confirmed by most one-way sensitivity analyses. The escitalopram strategy gained 0.011 QALYs more than citalopram, 0.008 more than paroxetine, and around 0.007 more than sertraline. Monte Carlo simulations indicated that ICER values for escitalopram were centered around €1100 and €4400 per QALY compared with paroxetine and sertraline, respectively. Although there is no official cost-effectiveness threshold in Italy, the value of €25,000 per QALY could be acceptable. All ICER values retrieved in all analyses were lower than this threshold.
Conclusion
The findings from this cost-effectiveness analysis indicate that escitalopram could be accepted as a cost-effective strategy for the Lombardy region health service compared with the other SSRIs studied. The present assessment is based on ICER values resulting from this analysis, which are lower than the thresholds proposed by health care authorities in other European Union countries. These benefits are driven by the effectiveness of escitalopram, which result in an improved health-related quality of life, a higher probability of sustained remission, and better utilization of health care resources. The study results are robust and in line with other pharmacoeconomic analyses comparing escitalopram with other SSRIs.
Introduction
Depression is a severe and pervasive disorder and a chronic recurrent illness associated with significant disability, impaired health-related quality of life, and increased mortality, and is at least as debilitating as other chronic conditions, such as diabetes mellitus and heart disease.Citation1 Depression has an estimated lifetime prevalence of 10%–25% in women and 5%–12% in men.Citation2 In Italy, the overall prevalence is around 3%.Citation3 Major depressive disorder is a persistent debilitating mental disorder that affects around 120 million adults worldwide,Citation4 and in Italy, the number of people with major depressive disorder is estimated to be about 5 million, with a lifelong prevalence of between 8% and 13%.
Major depressive disorder represents a substantial burden not only in terms of direct costs (eg, treatments, hospitalizations),Citation5 which represent 24% of the total costs, and are paid by patients, their families, and the health services, but also for the indirect and intangible costs (decreased productivity, comorbidities, early retirement, or death), which account for 62% of the overall costs of depression and impact on society and economic productivity.Citation6,Citation7 Kind and Sorensen have shown that pharmacological treatments accounted for 11.3% of the total (direct, indirect, and intangible) costs of major depressive disorder.Citation8 The economic burden of this disease was estimated at USD 83.1 billion worldwide in 2004. Approximately 60% of patients affected by major depressive disorder never seek treatment, whereas those who do seek help are likely to be undertreated.Citation9 Major depressive disorder is associated with an increased risk of relapse after a first episode and a high risk of suicidal behavior.
The main therapeutic modalities for major depressive disorder include antidepressant medication, psychotherapy, and somatic treatment. Selective serotonin reuptake inhibitors (SSRIs) and serotonin-norepinephrine reuptake inhibitors are two effective classes of antidepressants with a better safety profile in comparison with the traditional agents, such as the tricyclic antidepressants.Citation10 SSRIs are also more cost-effective in long-term treatment than the older antidepressants in major depressive disorder.Citation10,Citation11 Although pharmacological, psychological, and case management interventions are all recommended, antidepressant drugs remain the mainstay of treatment for depression for most people in contact with health care services.Citation12,Citation13
The first generic SSRI appeared in 2001 with fluoxetine. Since then most SSRIs have lost their patent protection. Currently, escitalopram is the only SSRI covered by a patent. A recent literature review by Ciprani et al identified clinically important differences among commonly prescribed antidepressants, in terms of both efficacy and acceptability, in favor of escitalopram and sertraline. In particular, this meta-analysis showed that mirtazapine, escitalopram, venlafaxine, and sertraline were more effective, in terms of response, than duloxetine, fluoxetine, fluvoxamine, paroxetine, and reboxetine. In terms of acceptability, escitalopram, sertraline, citalopram, and bupropion were better than other second-generation antidepressants.Citation14
Since the introduction of generic SSRIs, the higher costs of the branded drugs have been questioned. Furthermore, health services stakeholders need pharmacoeconomic data to be able to make decisions about where resources should be allocated. The Italian National Health Service was instituted in 1978 to provide universal health care for its citizens; it is organized under the Ministry of Health and is administered on a regional basis.
Nevertheless, there are large and growing differences in regional health service organization and provision. Covered are inpatient treatments that include tests and medications, as well as surgeries during hospitalization, family doctor visits, medical assistance provided by pediatricians, and other specialists. The health service also shoulders the costs of drugs, outpatient treatment, and dental treatment.
The 1978 reform law inaugurated fundamental changes in the mental health care system, prohibiting admissions to state mental hospitals, stipulating community-based services and allowing hospitalization only in small general hospital units. The Lombardy mental health system is strongly based on community care. There is a comprehensive network of inpatient and outpatient, residential, and semiresidential facilities.
The objective of this study was to assess the cost-effectiveness of escitalopram versus generic paroxetine, sertraline, and citalopram in the treatment of major depressive disorder, adopting the Lombardy region health service perspective, and identifying major cost drivers. The drugs included in this analysis were chosen because they are the most widely prescribed SSRI antidepressants in Italy.Citation15
Materials and methods
Description of model
A decision analytic model was developed to simulate the management of Italian patients with major depressive disorder over a time horizon of 12 months by combining clinical outcomes with resource utilization. The starting point was a pharmacoeconomic model developed by the Swedish Dental and Pharmaceutical benefits agency (TLV).Citation16 The 12-month time frame used for the economic evaluation of antidepressants was chosen to include the largest proportion of clinical events within a given depressive episode. However, the time frame should not be so long that extrapolations beyond the available clinical and real-life data may jeopardize the accuracy of the model.
An expert panel comprising three psychiatrists under the supervision of two health economists from an independent agency was responsible for evaluating the original model and for adapting it to Italian clinical practice and context.
Unlike the original model, which evaluated the cost-effectiveness of several antidepressant drugs (eg, SSRIs, serotonin-norepinephrine reuptake inhibitors), we evaluated four drugs of the SSRIs class, ie, escitalopram, citalopram, paroxetine, and sertraline, because these four antidepressants represent the most prescribed SSRIs in Italy. In contrast to the TLV model in which, after initial treatment failure, patients switched therapy to venlafaxine and/or passed to specialist care (combination of the third and fourth step from STAR*D),Citation17 our model considered each treatment line, from the first to the fourth, separately, following the STAR*D study. Efficacy data were retrieved from the TLV model. Utility data from the original model were assessed by our expert panel. Local data were considered for resource utilization and for treatment costs based on the Lombardy regional health service perspective. The decision tree was developed using TreeAge Pro 2011 software (TreeAge Software Inc, Williamstown, MA, USA) and its structure is presented in .
Figure 1 Decision analytic model.
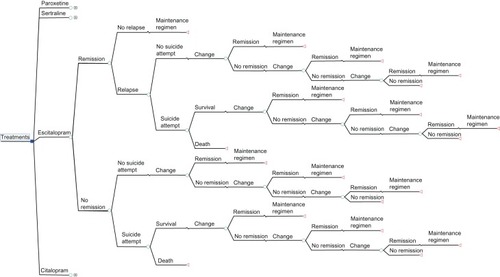
The population involved in this pharmacoeconomic analysis comprised patients with a first diagnosis of major depressive disorder and receiving for the first time one of the following SSRIs: escitalopram, sertraline, paroxetine, and citalopram. The treatment objectives were to achieve remission, measured by a score of ≤7 on the Hamilton Depression Rating scale. We assumed that patients achieving remission in the first treatment step in the model would do so after one month of treatment.Citation16
Once in remission, if the patient does not relapse, defined as a new major depressive disorder episode occurring within 6 months after remission, then she/he was treated with a maintenance treatment for 6 months in accordance with the international treatment guidelines; otherwise if the patient relapsed, it was assumed that relapse occurs after 4 months of starting treatment. Patients who failed to respond, defined as not achieving remission in the first treatment line, move to a second-line therapy. A proportion of these patients might attempt suicide. Those patients who achieve remission in the second line of treatment, which we have assumed to occur after one month, receive maintenance treatment for 6 months, whereas those who do not achieve remission at the second line of treatment move to the third line of treatment. Patients move to the third and fourth treatment lines according to the same criteria described for second-line treatment.
Model parameters
Efficacy
The remission probabilities for the first line of treatment were derived from an independent meta-analysis made by the TLV as specified in . Several studies were included in this meta-analysis for a total of about 20,000 patients,Citation16 and in order to exclude potential bias related to level of sponsorship of the articles, the authors applied adjustments in the meta-analysis.
Table 1 Treatment strategies and lines, and drug remission probabilities
The mixed treatment comparison statistical method was used to compare more than two treatments that were not part of the same direct head-to-head study. This approach made it possible to estimate the effect of all relevant treatments and combine all the information from the relevant studies. The study had to report remission as #7 or 8 Hamilton Depression Rating scale points or as #12 Montgomery–Åsberg Depression Rating Scale points. Therefore, the expert panel considered this meta-analysis robust enough for the aim of our pharmacoeconomic study.
Our scientific expert panel analyzed and adapted second, third, and fourth treatment strategies and lines described in the STAR*D study,Citation17 considered as the reference study, to Italian standard clinical practice.
After failure of initial treatment, patients move to a second-line treatment consisting of a switching strategy or a combination strategy; if the second-line treatment failed, the patients passed to a third treatment line consisting of an augmentation strategy and, finally, if this last strategy failed, the patients passed to a fourth line consisting of a switching strategy carried out during hospitalization (for details on drugs see ). We assumed that patients had the same probability of receiving one of the different treatments within each treatment line.
Second, third, and fourth treatment line remission probabilities were discussed with the expert panel, which agreed to adapt STAR*D remission probabilities to the treatments that are not present in the STAR*D study, but are the ones usually used in normal Italian clinical practice. For these treatments, remission probabilities were calculated using the mean probability of remission of the drug classes considered in the STAR*D study. Regarding the probability of relapse, a systematic review of two observational studies in primary care was performed.Citation18 In these studies, the relapse frequencies were 11% and 30%, respectively; however, the latter study was very small. The STAR*D study had a 33.5% relapse rate for those patients who achieved remission in the first step. Patients who suffered a relapse experienced this condition at an average of 4.4 months after remission. In our main analysis, we assumed the risk of relapse to be 11% and that relapse occurs after 4 months.Citation18 For suicide attempts and the probability of dying, we followed Löthgren and Khan, setting the risk of suicide attempts at 0.031 and the risk of dying in such an attempt at 0.1().Citation19,Citation20
Table 2 Probabilities
Drug costs
Monthly drug costs were calculated by multiplying, for each presentation, unit costs in milligrams by daily dose and by 30 days of usage (). A mean of the costs of all the available commercial presentations was used to define the monthly costs for the different antidepressants ().
Table 3 Drug dosages
Table 4 Drug costs (€)
Unit costs in milligrams were calculated by dividing the price of the commercial presentation by the total strength in each box (mg). For the generic drugs, we considered the price reimbursed by the regional health service while for the branded drugs we considered the public price. In both cases, €2 of copayment (ticket) for each drug prescription directly paid by the patient was subtracted from the respective prices. The data source was the Italian Drug Agency website.Citation21
Regarding drug dosages, we used the defined daily dosages retrieved from the website of the World Health Organization Collaborative Center for Drug Statistics Methodology which, according to our expert panel, fits well with standard clinical practice in Italy.Citation22 A sensitivity analysis was performed using the mean daily doses derived from the Summary of Product Characteristics and the results are shown in the Results section.
Resource utilization
This analysis considered direct medical costs including those of general practitioner visits, specialist visits, patient examinations, and hospitalizations. Considering the perspective of the model, which is that of the Lombardy region health service, the costs were those directly reimbursed by the regional health service. Indirect costs have not been evaluated in this model due to perspective and data availabilities (no accurate data in Lombardy).
Resource utilization was assessed by our expert panel to reflect standard clinical practice in Italy. They advised a list of examinations that, according to standard clinical practice, are prescribed at first visits and estimated as an annual mean number of general practitioners and specialist visits (). From this last assessment, we decided to allocate all examinations to the first month and to distribute homogeneously the visits in each patient pathway indistinctly over the 12-month time horizon. Unit costs, expressed in €, were retrieved from 2011 Lombardy region official prices and diagnosis-related group pricelists, and were applied to the resource utilization data ().
Table 5 Resource utilization and costs
Utilities
In health economics, utilities are cardinal values that reflect an individual’s preferences for different health outcomes. They are measured on an interval scale, with 0 reflecting a state of health equivalent to death and 1 reflecting perfect health. Utilities are typically combined with survival estimates and aggregated across individuals to generate quality-adjusted life years (QALYs) for use in cost-effectiveness analyses of health care interventions. The treatment effects have been expressed as QALYs with the aid of data from Sobocki et al,Citation23 where utilities for a patient who achieves remission and for one who does not are calculated as 0.81 and 0.57, respectively. The TLV model considered the utility for patients in relapse and the utility for patients who attempt suicide to be equal to patients who do not achieve remission.Citation16 Our expert panel did not validate this approach because, according to their clinical experience, patients who relapse have a higher quality of life than patients not in remission, because they experience remission at least once and patients who attempt suicide have a lower quality of life than patients not in remission, because they have a higher score on the Hamilton Rating Scale for Depression.Citation24 Furthermore, a literature review showed a lack of information regarding utility values for patients who relapse and for patients who attempt suicide. As a consequence, the authors decided to perform an analysis based on the utility values suggested by the expert panel () and to test the results by performing another analysis using the original data from Sobocki et al and to compare the results of the two cost-effectiveness analyses.Citation23
Table 6 Utilities
Analyses
Cost-effectiveness analysis is a method for assessing gains in health relative to the costs of different health interventions. It is not the only criterion for deciding how to allocate resources, but it is an important one because it directly relates the financial and scientific implications of different interventions. One type of cost-effectiveness analysis is cost-utility analysis, in which the basic calculation involves dividing the cost of an intervention in monetary units by the expected health gain measured in QALYs.Citation25 Nevertheless, in this study, we will speak generally about cost-effectiveness analysis.
The main outcome of the cost-effectiveness analysis is the incremental cost effectiveness ratio (ICER). The ICER represents the difference in costs divided by the difference in outcomes observed between two alternative programs. It represents the additional cost due to a new technology related to its additional benefits.
where ΔC is the difference in total cost between intervention 1 and intervention 0, and ΔE is the difference in effectiveness between intervention 1 and intervention 0.
The ICER has to be compared with a meaningful threshold value and many agencies have studied this threshold. The most recognized agency is the National Institute for Health and Clinical Excellence in the UK that proposes a threshold of €35,000 per QALY.Citation26 In Italy, there is no official cost-effectiveness threshold, so some authors have proposed to use these latter values for Italy.Citation27 Some authors have also proposed to reduce the National Institute for Health and Clinical Excellence threshold for wider use of some more cost-effective treatments.Citation28 Based on this paper, we decided to use a threshold of €25,000 per QALY for this analysis. An ICER value lower than the threshold lets us assume that one technology has a higher probability of being considered cost-effective in comparison with the other technologyCitation26,Citation29,Citation30
The interpretation of ICER results depends on the level of confidence or uncertainty in various parameters. In this case, it may be necessary to know the likely impact of using alternative values of the parameters and examining the sensitivity of the model to changes in its inputs. The simplest form of sensitivity analysis is to simply vary one value in the model by a given amount, and examine the impact that the change has on the model’s results. This is known as one-way sensitivity analysis, because only one parameter is changed at one time. In our model, we decided to perform the following one-way sensitivity analyses:
probability of remission of escitalopram in first line ± 5%
probability of remission of second line ± 5%
probability of remission of third line ± 5%
probability of remission of fourth line ± 5%
probability of relapse equal to 0.335
mean daily doses values to calculate daily costs
utility values from Sobocki et alCitation23
Another form of sensitivity analysis is the Monte Carlo simulation, which performs several analyses by building models of possible results and substituting a range of values or a probability distribution for any factor that has inherent uncertainty. It then calculates results many times, each time using a different set of random values from the probability functions. Monte Carlo simulations produce distributions of possible outcome values.Citation31
One important output of Monte Carlo simulation is the cost-effectiveness acceptability curve (CEAC), which is a graph presenting the uncertainty within the results of a study. This graph plots the probability that the ICER is favorably cost-effective, ie, has a cost-effectiveness ratio below the Lombardy health service willingness-to-pay threshold.Citation32
Results
Base case scenario analysis
In the base case scenario (see ), patients treated with escitalopram have a mean expected number of QALYs of 0.735 compared with a mean expected number of QALYs of 0.724 for citalopram and 0.728 for paroxetine and sertraline. The escitalopram strategy gains 0.011 QALYs more than citalopram, 0.008 more than paroxetine, and about 0.007 more than sertraline.
Table 7 Results: base case scenario
The average costs of the different treatment strategies for the 12-month time frame range from €1362 for sertraline to €1401 for citalopram, €1394 for escitalopram, and €1385 for paroxetine. The escitalopram strategy costs €32 more than sertraline, €8.50 more than paroxetine, and about €6.80 less than citalopram.
In this context, citalopram was dominated by escitalopram (citalopram had a higher cost and less effectiveness than escitalopram). Paroxetine and sertraline were less costly, but also less effective than escitalopram. Escitalopram had an ICER of €4395 and €1080 per QALY compared with sertraline and paroxetine, respectively.
Sensitivity analyses
shows the results of the sensitivity analyses. By decreasing the probability of remission with escitalopram by 5%, the model showed that the ICER of escitalopram versus sertraline increased to €18,092, the ICER of escitalopram versus paroxetine increased to €9822, and the ICER of escitalopram versus citalopram was €3191 per QALY. By increasing the probability of remission of escitalopram by 5%, the model showed that the ICER of escitalopram versus sertraline decreased to €115 and that both paroxetine and citalopram were dominated by escitalopram.
Table 8 Sensitivity analysis
The model was slightly sensitive to the probability of remission of the second, third, and fourth lines, using an interval of ±5%, and the results varied by around €300, €180, and €20 for the second, third, and fourth treatment line, respectively, compared with the base scenario. Thus, these parameters did not have an important impact on the model, indicating its robustness.
The sensitivity analysis of the probability of relapse using the value 0.335 from the STAR*D study showed that the ICER of escitalopram versus sertraline varied from €4395 (base case) to €8065, the ICER of escitalopram versus paroxetine varied from €1080 (base case) to €4104, and the ICER of escitalopram versus citalopram was €2096.
Regarding the dosages, we calculated the daily costs of the study drugs using the mean daily dose (calculated from the range suggested by the Summary of Product Characteristics) instead of the defined daily dosages used in the base case scenario. This showed that the ICER of escitalopram versus sertraline increased from €4395 (base case) to €6269, the ICER of escitalopram versus paroxetine increased from €1080 to €2520, and the ICER of escitalopram versus citalopram was €1725. Also, a cost-effectiveness ranking performed using utilities from Sobocki et al gave results that were closer to the base case scenario.Citation23 The ICER for escitalopram versus sertraline was €6607 and the ICER for escitalopram versus paroxetine resulted in savings of €1623.
Monte Carlo simulation
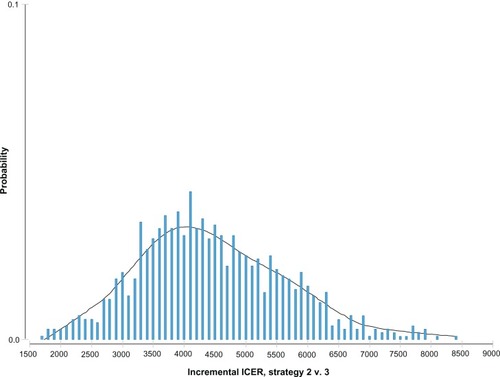
The model was assessed using Monte Carlo simulation to account for the multivariate uncertainty inherent in input parameters based on 10,000 bootstraps to test model and parameters. shows the ICER distribution probability of escitalopram versus sertraline, assuming a normal distribution centered on an average value of €4444, which was the most probable ICER value for escitalopram versus sertraline.
Figure 2 Incremental cost effectiveness ratio (ICER) distribution probability of escitalopram versus sertraline.
shows the ICER distribution probability of escitalopram versus citalopram in which the mean of the normal distribution was centered around the negative values (−€561). This means that escitalopram dominated citalopram in most simulations. The ICER distribution probability of escitalopram versus paroxetine showed a normal distribution, with an ICER mean value of around €1100 ().
Figure 3 Incremental cost effectiveness ratio (ICER) distribution probability of escitalopram versus citalopram.
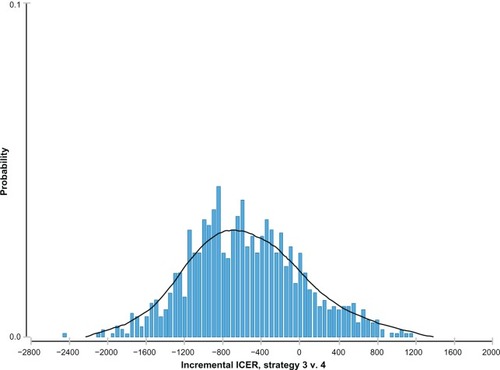
Figure 4 Incremental cost effectiveness ratio (ICER) distribution probability of escitalopram versus paroxetine.

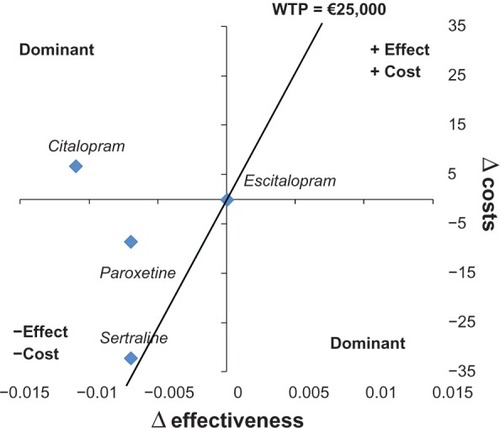
shows strategies for a plan defined in two dimensions, ie, differential cost and differential effectiveness. Citalopram dominated because it had a higher cost and less effectiveness in comparison with escitalopram. Paroxetine and sertraline were in the quadrant for which strategies were less costly and less effective in comparison with escitalopram. Considering a willingness to pay of €25,000, paroxetine and sertraline were in the part of the plan that is considered sustainable.
Figure 5 Cost-effectiveness analysis plan.
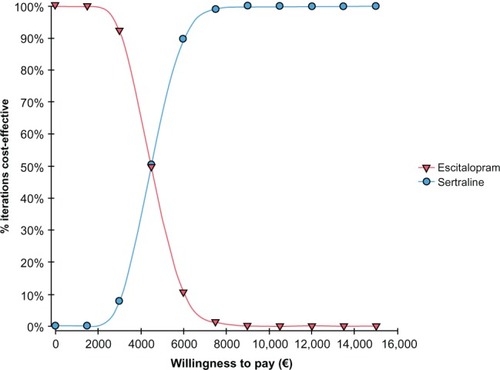
The CEAC graph shows how varying the willingness to pay probability impacted the cost-effectiveness probability. The CEAC for escitalopram versus sertraline presented in shows that for a willingness to pay of less than around €5000, the sertraline strategy had the highest probability of being cost-effective, whereas above €5000, the most cost-effective strategy was escitalopram. A 95% probability of escitalopram being the most cost-effective was estimated within a willingness to pay that goes from €7000 to €10,000.
Figure 6 Cost-effectiveness acceptability curve for escitalopram versus sertraline.
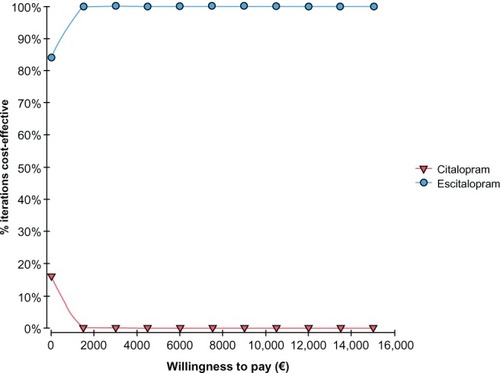
The CEAC for escitalopram versus paroxetine presented in shows that for a willingness to pay of less than around €1000, the paroxetine strategy had the highest probability of being cost-effective, whereas above €1000, the most cost-effective strategy was with escitalopram. Finally, shows the CEAC of escitalopram versus citalopram in which we could see that citalopram, also for a willingness to pay equal to zero, is less cost-effective than escitalopram.
Figure 7 Cost-effectiveness acceptability curve for escitalopram versus paroxetine.
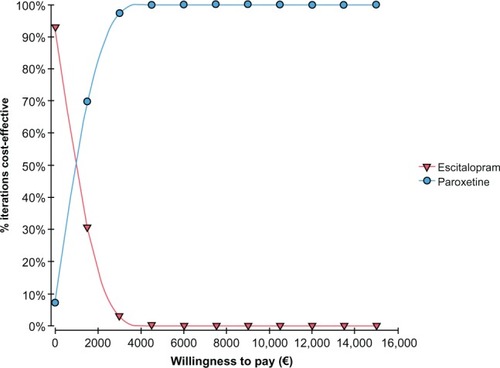
Figure 8 Cost-effectiveness acceptability curve for escitalopram versus citalopram.
Discussion
In this cost-effectiveness analysis of escitalopram versus paroxetine, sertraline, and citalopram in major depressive disorder, escitalopram was dominant over citalopram in most of the one-way sensitive analyses. Escitalopram yielded ICERs with a maximum value of about €9800 compared with paroxetine, and ICERs ranging from about €115 to about €18,000 compared with sertraline. The high variability in the ICER for the comparison of escitalopram versus sertraline is due to the remission rate that, being the only parameter specific for each drug, was very sensitive to small variations. Despite the wide range of ICER values, Monte Carlo simulation showed that ICER values for escitalopram were centered around €1100 compared with paroxetine and around €4400 compared with sertraline. CEAC confirmed these results, with an ICER break-even point of around €1000 for escitalopram versus paroxetine and €5000 for escitalopram versus sertraline. Although there is no official cost-effectiveness threshold in Italy, the value of €25,000 could be suggested as being acceptable also for Italy. All values of ICERs retrieved in all analyses were lower than this threshold.
In the T LV model, escitalopram was dominant versus the other molecules except for mirtazapine when using all studies in the meta-analysis to calculate remission frequencies. The cost and effect ratio for escitalopram compared with mirtazapine was approximately 61,000 Swedish crowns (about €7000). Considering only studies with a follow-up period of 8–12 weeks, the results changed and escitalopram became dominant over all alternatives, including mirtazapine.
A review by Cipriani et al showed the superior clinical efficacy of escitalopram versus citalopram, sertraline, and paroxetine.Citation33 In a study that compared direct costs and the cost-effectiveness of eight SSRIs in the US, escitalopram was the least expensive and the most cost-effective drug, and adverse reactions were considered in this study for calculation of direct costs that were applied to the model having a significant impact on the success of escitalopram because of lower incidence.Citation34
As with any pharmacoeconomic modeling, this study has some limitations. For example, bias may be present because of using data from different sources. In our case, the probability of remission, relapse, and attempted suicide came from a meta-analysis and two randomized controlled trials, respectively. The lack of data from observational studies is an important limitation to a pharmacoeconomic study because analyses based mostly on randomized controlled trials provide values that are far from “real life”. Another potential limitation of our study is that the main clinical inputs for the model were based on studies not performed in an Italian health care setting, but the probabilities of clinical events are not usually considered country-specific.Citation35 Another important limitation due to the lack of published local data was that data on resource utilization, treatment patterns, and some utilities were based on estimates from an expert panel. However, it has been suggested that use of expert opinion is appropriate for situations in which there is little or no published material in a particular area, or in which the findings from a thorough literature review are considered unreliable, conflicting, or insufficient to cover the requirements of a study.Citation36
Conclusion
The findings from this cost-effectiveness analysis indicate that escitalopram could be accepted as a cost-effectiveness strategy for the Lombardy region health service compared with citalopram, sertraline, and paroxetine in the first-line treatment of major depressive disorder. This assessment is based on ICERs resulting from this analysis, which are lower than the threshold proposed by several agencies in other countries. These benefits are driven by the effectiveness of escitalopram, resulting in improved health-related quality of life and probability of sustained remission and health care resource utilization. The findings from the sensitivity analyses in this study support the robustness of the model. The results of this analysis are in line with the TLV model.
Author contributions
Dr Katz and Dr Ripellino were responsible for model development and writing of the manuscript. Professor Mencacci and Dr Di Sciascio were responsible for clinical validation of the model and review of the manuscript. All authors read and approved the final manuscript.
Acknowledgments
The authors wish to thank Dr Radice for quality assurance of the model and review of the manuscript and Dr Percudani for clinical validation of the model and review of the manuscript.
Disclosure
This study was financially supported by an unrestricted grant from Lundbeck Italy SpA which was not responsible for creation of the study protocol, the data analysis, data interpretation, or writing of the manuscript. CM, GDS, and Drs Percudani and Radice have received honoraria from CSD Medical Research SrL. PK and CR are employees of CSD Medical Research SrL. The authors report no other conflicts of interest in this work.
References
- CroomKPloskerGSpotlight on the pharmacoeconomics of escitalopram in depressionCNS Drugs20041846947315139801
- MooreJDBonaJRDepression and dysthymiaMed Clin North Am20018563164411349477
- GirolamoGPolidoriGMorosiniPPrevalence of common mental disorders in Italy: results from the European Study of the Epidemiology of Mental Disorders (ESEMeD) projectActa Psychiatr Scand Suppl2004420212715128384
- ColomboGDi MatteoSNel Trattamento della Depressione Maggiore Nelle Diverse Regioni Italiane: Il Ruolo di Venlafaxina [Budget Impact Analysis in the Treatment of Major Depressive Disorder on Italian Regions: The Role of Venlafaxine]MilanW.H.E.RE. Medical Press Srl2009 Italian.
- BattagliaADubiniAMannheimerRPancheriPDepression in the Italian community: epidemiology and socio-economic implicationsInt Clin Psycho pharmacol200419135142
- GreenbergPEKesslerRCBirnbaumHGThe economic burden of depression in the United States: how did it change between 1990 and 2000?J Clin Psychiatry2003641465147514728109
- StoudemireAFrankRHedemarkNKamletMBlazerDThe economic burden of depressionGen Hosp Psychiatry198683873943491775
- KindPSorensenJThe costs of depressionInt Clin Psychopharmacol199371911958468441
- FrankLRevickiDASorensenS VThe economics of selective serotonin reuptake inhibitors in depression: a critical reviewCNS Drugs200115598311465013
- PanzarinoPJNashDBCost-effective treatment of depression with selective serotonin reuptake inhibitorsAm J Manag Care2001717318411216334
- RevickiDASimonGEChanKDepression, health-related quality of life, and medical cost outcomes of receiving recommended levels of antidepressant treatmentJ Fam Pract1998474464529866670
- EllisPAustralian and New Zealand clinical practice guidelines for the treatment of depressionAust N Z J Psychiatry20043838940715209830
- National Guideline Clearinghouse: DepressionThe treatment and management of depression in adults [webpage on the Internet]. Guideline summaryLondon, UKNational Institute for Health and Clinical Excellence2009 Available from: http://guideline.gov/content.aspx?id=15521Accessed December 17, 2012
- CiprianiAFurukawaTASalantiGComparative efficacy and acceptability of 12 new-generation antidepressants: a multiple-treatments meta-analysisLancet200937374675819185342
- TrifiròGTillatiSSpinaEA nationwide prospective study on prescribing pattern of antidepressant drugs in Italian primary careEur J Clin PharmacolEpub 6 17, 2012
- WesslingARamsbergJDepression: The Review of AntidepressantsSolna, SwedenThe Dental and Pharmaceutical benefits Agency2008 Available from: http://www.tlv.se/Upload/genomgangen/reviewantidepressants.pdfAccessed November 21, 2012
- GaynesBRushAMadhukarTWisniewskiSSpencerDFavaMThe STAR*D study: treating depression in the real worldCleve Clin J Med200875576618236731
- GilchristGGunnJObservational studies of depression in primary care: what do we know?BMC Fam Pract200782817493280
- LothgrenMHemelsMFrancoisCJoenssonBACost-effectiveness analysis of escitalopram as first line treatment of depression in SwedenPrimary Care Psychiatry20049153162
- KhanAKhanSRLeventhalRMBrownWASymptom reduction and suicide risk in patients treated with placebo in antidepressant clinical trials: a replication analysis of the Food and Drug Administration DatabaseInt J Neuropsychopharmacol2001411311811466159
- Agenzia Italiana del Farmaco [homepage on the Internet]RomeAgenzia Italiana del Farmaco Available from: http://www.agenziafarmaco.gov.it/Accessed November 21, 2012
- WHOCC [homepage on the Internet] International language for drug utilization researchOslo, NorwayWorld Health Organization Collaborating Center for Drug Statistics Methodologyupdated 5 4, 2012 Available from: http://www.whocc.no/Accessed November 21, 2012
- SobockiPEkmanMAgrenHRunesonBJönssonBThe mission is remission: health economic consequences of achieving full remission with antidepressant treatment for depressionInt J Clin Pract20066079179816846399
- PevelerRKendrickTBuxtonMA randomised controlled trial to compare the cost-effectiveness of tricyclic antidepressants, selective serotonin reuptake inhibitors and lofepramineHealth Technol Assess200591134 iii.15876362
- JamisonDTBremanJGMeashamARCost-effectiveness analysisPriorities in HealthWashington, DCWorld Bank2006 Available from: http://www.ncbi.nlm.nih.gov/books/NBK10253/Accessed November 21, 2012
- LucioniCRavasioRCome valutare i risultati di uno studio farmacoeconomico? How to evaluate the results of a pharmacoeconomic analysis?PharmacoEconomics – Italian Research Articles20043121130 Italian.
- CapriSRicciardiWAdvate nel trattamento dell’emofillia A – analisi costo-efficacia della terapia on-demand versus profilassi basata sull’emivita del prodotto. [Advate in the treatment of emoflia A – cost-effectiveness of an on-demand therapy versus a prophylaxis based on the half-life of the product]Ital J Public Health201186167 Italian.
- UK’s NICE unlikely to bow to new pricing suggestionsFinancial Times5102012
- RawlinsMDCulyerAJNational Institute for Clinical Excellence and its value judgementsBMJ200432922422715271836
- CulyerAJIntroductionTowseAPritchardCDevlinNCost Effectiveness Thresholds: Economic and Ethical IssuesLondon, UKKings Fund and Office of Health Economics2002
- Palisade CorporationMaker of Risk and Decision Analysis Software using Monte Carlo Simulation [homepage on the Internet]Ithaca, NYPalisade Corporation2012 Available from: http://www.palisade.com/Accessed November 21, 2012
- CEA Registry [homepage on the Internet]Boston, MACost-Effectiveness Analysis Registry Available from: https://research.tufts-nemc.org/cear4/Accessed November 21, 2012
- CiprianiASantilliCFurukawaTAEscitalopram versus other antidepressive agents for depressionCochrane Database Syst Rev20092CD00653219370639
- SullivanP WValuckRSaseenJMacFallHMA comparison of the direct costs and cost effectiveness of serotonin reuptake inhibitors and associated adverse drug reactionsCNS Drugs20041891193215521793
- NuijtenMBrignoneMMarteauFden BoerJHoencampECost-effectiveness of escitalopram in major depressive disorder in the Dutch health careClin Ther2012341364137822578310
- EvansCThe use of consensus methods and expert panels in pharmacoeconomic studies: practical applications and methodological shortcomingsPharmacoeconomics19971212112910169665
- NelsonJCPapakostasGIAtypical antipsychotic augmentation in major depressive disorder: a meta-analysis of placebo-controlled randomized trialsAm J Psychiatry200916698099119687129
- GarattiniLCastelnuovoELanzeniDDurata e Costo delle visite in medicina generale. Il progetto DYSCO [Duration and cost of general practitioner visits. The DYSCO project]Farmeconomia Health Economics and Therapeutic Pathways20034109114 Italian.