 ?Mathematical formulae have been encoded as MathML and are displayed in this HTML version using MathJax in order to improve their display. Uncheck the box to turn MathJax off. This feature requires Javascript. Click on a formula to zoom.
Abstract
Background
Diabetes is one of the most prevalent chronic diseases, and its prevalence is predicted to increase in the next two decades. Diabetes imposes a staggering financial burden on the health care system, so information about the costs and experiences of collecting and reporting quality measures of data is vital for practices deciding whether to adopt quality improvements or monitor existing initiatives. The aim of this study was to quantify the association between health care costs and level of glycemic control in patients with type 2 diabetes using clinical and administrative databases.
Methods
A retrospective analysis using a large administrative database and a clinical registry containing laboratory results was performed. Patients were subdivided according to their glycated hemoglobin level. Multivariate analyses were used to control for differences in potential confounding factors, including age, gender, Charlson comorbidity index, presence of dyslipidemia, hypertension, or cardiovascular disease, and degree of adherence with antidiabetic drugs among the study groups.
Results
Of the total population of 700,000 subjects, 31,022 were identified as being diabetic (4.4% of the entire population). Of these, 21,586 met the study inclusion criteria. In total, 31.5% of patients had very poor glycemic control and 25.7% had excellent control. Over 2 years, the mean diabetes-related cost per person was: €1291.56 in patients with excellent control; €1545.99 in those with good control; €1584.07 in those with fair control; €1839.42 in those with poor control; and €1894.80 in those with very poor control. After adjustment, compared with the group having excellent control, the estimated excess cost per person associated with the groups with good control, fair control, poor control, and very poor control was €219.28, €264.65, €513.18, and €564.79, respectively.
Conclusion
Many patients showed suboptimal glycemic control. Lower levels of glycated hemoglobin were associated with lower diabetes-related health care costs. Integration of administrative databases and a laboratory database appears to be suitable for showing that appropriate management of diabetes can help to achieve better resource allocation.
Introduction
Diabetes is one of the most prevalent chronic diseases. The estimated prevalence of diabetes in the world population was 6.6% in 2010, and this number is projected to increase to 7.8% by 2030.Citation1 The condition commonly progresses to include microvascular and macrovascular complications.Citation2,Citation3 Development of diabetes-related complications is related to glycemic control.Citation4 Diet and pharmacological treatment play a central role in the management of diabetes. However, according to the World Health Organization, only 50% of diabetic patients in developed countries comply with drug treatment.Citation5,Citation6 In addition, the National Health and Nutrition Examination Survey reported that only 37% of patients with diabetes have adequate disease control.Citation7 In addition to its adverse effects on health and quality of life, diabetes also imposes a staggering financial burden on the health care system. The total cost of diabetes care is 2.3 times the cost of care for nondiabetic patients.Citation8 In Italy, direct costs for people with diabetes amount to about 9 billion Euros per year, representing nearly 9% of the national health expenditure.Citation9 Oglesby et al found that diabetes-related costs were 16% and 20% lower for patients with good control (glycated hemoglobin [HbA1c] ≤7%) compared with those having fair control (HbA1c >7%–9%) and poor control (HbA1c >9%).Citation10 Menzin et al reported that patients with a mean HbA1c ≥10% had higher diabetes-related hospital costs than those with a mean HbA1c <7%.Citation11 Other data suggest that diabetes-related complications and consequent costs may be increased in patients with therapy targeted to very tight glycemic control.Citation12
Estimates of the direct medical costs attributed to diabetes are essential to be able to assess the financial burden of the disease and plan for future health care needs. In addition, because type 2 diabetes is potentially preventable,Citation13 estimates of medical expenditure are needed to assess the full economic effect of programs aimed at prevention of the disease. The data used to determine these policies are based either on disease registries clinical information or on administrative data. The former often involve population samples and are time-consuming and expensive to collect, whereas the latter have been used successfully as a source of information for diabetes monitoring.Citation14,Citation15
The aim of this study was to quantify the relationship between health care costs attributable to diabetes and level of glycemic control by cross-linkage of various large clinical and administrative databases in order to increase our understanding of the management of diabetes and be able to make informed policy decisions.
Materials and methods
Data source
The study was based on administrative databases maintained by two local health units in Italy; Arezzo in Tuscany and Ravenna in Emilia-Romagna, representing a population of about 700,000 subjects. Using the Territorial Pharmacy Database, local health units routinely measure the volume of expenditure generated by dispensing of drugs to enrollees. The data available in each prescription claim include the patient’s national health number, the prescribing physician’s number, the anatomical-therapeutic-chemical (ATC) code of the drug dispensed, the number of packs dispensed, the number of units per pack, the dose, the unit cost per pack, and the prescription date. Using the anonymous alphanumeric code allocated to each citizen by the local health unit as a unique identifier to guarantee patient privacy, this database is linked with the Hospital Direct Drugs Distribution Registry, which contains the same data as the Territorial Pharmacy Database: the Beneficiaries’ Database, listing patient demographic characteristics, ie, date of birth, gender, place of residence, physician license number, start and end of registration dates and the date of death; the Hospital Discharge Database, which includes all hospitalization data, with the principal and secondary discharge diagnosis codes classified according to the International Classification of Diseases, Ninth Revision (ICD9CM), and the diagnosis-related group code; the Outpatient Service Registry, which includes all laboratory investigations, instrumental tests, and specialist checkups requests, and the dates on which these were performed; the Clinical Laboratory File, which records the test results of all laboratory tests performed. Universal health care coverage in Italy means that the information contained in these databases is complete and comprehensive, and has been used in previous epidemiological studies.Citation16 The Italian Ministry of Health reports that these archives are 100% complete and 95% accurate.Citation17 No identifiers related to patients were provided to the researchers. The ethics committees for the local health units approved the study.
Cohort definition
This was a retrospective cohort study, which included subjects identified as diabetic if, between January 1, 2009 and December 31, 2009, they had at least two prescriptions of antidiabetic drugs (ATC code A10), and/or at least one fasting glucose determination over 126 mg/dL, and/or at least one hospitalization with a discharge diagnosis of diabetes (ICD9CM code 250), and/or at least one outpatient service with an exemption for diabetes. The date of the first prescription of antidiabetic medication, date of glucose determination, hospital discharge, and/or outpatient service was defined as the index date. The clinical characteristics of the patients enrolled in this study were investigated for the one-year period before the index date. A two-year study period, starting from the index date, was evaluated for each patient. Patients were excluded if they were younger than 45 years, if they had only one determination of HbA1c in the first or the second year of the study, if they had moved to another local health unit, or if they had died during the study period.
Subjects enrolled were defined as: dyslipidemic based on the presence of at least two prescriptions of lipid-lowering drugs (ATC code C10) and/or at least one hospitalization with a primary or secondary diagnosis of metabolic syndrome (ICD9CM code 277.7) or disorder of lipid metabolism (ICD9CM code 272); as hypertensive based on the presence of at least two prescriptions of antihypertensive drugs (ATC code C02, C03, C07, C08, C09) and/or a hospitalization with a primary or secondary diagnosis of hypertensive disease (ICD9CM code 401–405); as affected by a previous major cardiovascular event based on the presence of at least one hospitalization with a primary or secondary diagnosis of ischemic heart disease (ICD9CM code 410–414), heart failure (ICD9CM code 428), cerebrovascular disease (ICD9CM code 430–438), or arterial disease (ICD9CM code 440–442); as affected by a cardiovascular disease if they had a previous hospitalization for a cardiovascular event and/or had prescriptions for drugs acting on the renin-angiotensin system (ATC code C09A, C09B), antiplatelet drugs (ATC code B01AC06), beta-blockers (ATC code C07), and/or antiplatelet drugs. The Charlson comorbidity index was also calculated for each patient by summing the assigned weights for all comorbid conditions evaluated in the one-year period before the index date.Citation18 In addition, for the purposes of analysis, all HbA1c measurements available during the follow-up period were identified. HbA1c is a widely used marker of glycemic control that reflects the average glycemic level during the past 2–3 months. As in previous studies, the target HbA1c was defined as ≤7%.Citation19 Enrolled patients were subdivided into five cohorts according to target HbA1c values achieved: excellent (≥80%), good (60%–79%), fair (40%–59%), poor (20%–39%), and very poor (<20%). We also grouped patients without any determination of HbA1c.
Adherence with antidiabetic medication
Adherence was determined using the medication possession ratio (MPR). The MPR reflects the proportion of days during which the enrollee possesses a supply of medication.
For enrollees on multiple antidiabetic medications, the MPR reported was calculated as the mean of the MPR calculated for each drug. We excluded the number of days spent by the patients in an institutionalized care setting, such as hospital, from the MPR calculation. Because the Territorial Pharmacy Database does not include data for drug dose, the mean daily dose of the prescribed drugs was defined according to the recommended dose reported in “L’Informatore Farmaceutico” for 2010.Citation20 Patients were defined as adherent with antidiabetic medication if their MPR was ≥80%.
Cost of illness
Cost of illness was measured using two different methods, ie, cohorts of people based on the percentage of HbA1c levels ≤7%, as previously described, or the first and last HbA1c measurement during the study period. Disease-related health care costs evaluated in the study period included: costs of antidiabetic medication dispensed by the Territorial and Hospital Pharmacy; costs due to hospitalizations for fatal and nonfatal hypertensive disease (ICD9CM code 401–405); ischemic heart disease (ICD9CM code 410–414), heart failure (ICD9CM code 428), cerebrovascular disease (ICD9CM code 430–438), arterial disease (ICD9CM code 440–442), and diabetes (ICD9CM code 250); costs of laboratory/instrumental tests for HbA1c, glycemia, complete blood count, lipid panel, and albumin to creatinine ratio; and costs for specialist visits and eye examinations. Drug costs were evaluated using the National Health Service purchase price. Hospitalization costs were determined using the diagnosis-related group tariff. The cost of instrumental and laboratory tests was defined according to the tariffs applied by the Emilia-Romagna and Tuscany regions. The currency reference used was the Euro (€).
Statistical analysis
Quantitative variables are presented as the mean ± standard deviation. One-way analysis of variance was used to compare the means for the quantitative variables. Associations between categoric variables were tested using the Pearson χ2 test. A generalized linear model with an identity link function and a gamma distribution was used to estimate the association between health care costs and level of glycemic control.Citation21 To control for confounding, we included in the model factors including age, gender, Charlson comorbidity index, coexisting illnesses (such as hypertension, dyslipidemia, and cardiovascular disease), and adherence level. Age was categorized as ≤65 or >65 years; the Charlson score was grouped into three categories based on distribution of scores, ie, ≤1, 2–3, ≥4; and adherence level was categorized based on the MPR value and grouped into three categories, ie, poor adherence (MPR <40%), fair adherence (MPR 40% to <80%), or good adherence (MPR ≥80%). Two-tailed P-values < 0.05 were considered to be statistically significant, and all statistical analyses were conducted using Stata software version 12.1 (Stata Corporation, College Station, TX, USA).
Results
Of the total study population of 700,000 subjects, 31,022 (4.4% of the entire population) were identified as diabetic. Of these, 9436 were excluded (1481 for being younger than 45 years; 5980 for having only one determination of HbA1c in the first or second year of the study; and 1975 because they died or moved to another local health unit). We identified six cohorts of patients using HbA1c levels (). In total, 6807 patients (31.5%) had very poor HbA1c control, 5540 (25.7%) had excellent control, and 3337 (15.5%) did not have any determination of HbA1c during the 2 years of the study. Patient characteristics are reported in . Patients without HbA1c determinations were more frequently older than those with HbA1c determinations, and had less concomitant illness and cardiovascular disease.
Figure 1 Prevalence of diabetic patients with different levels of glycemic control.
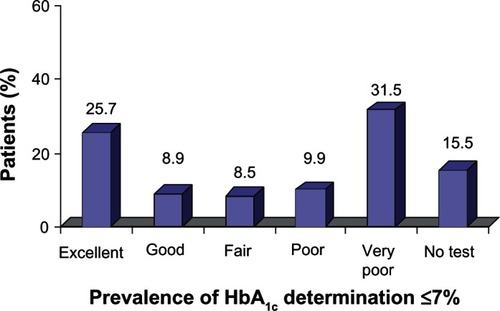
Table 1 Characteristics of enrolled patients
Worst is the glycemic control level, higher is the median value as well as the number of HbA1c tests performed during the study period (). and show glycemic control expressed as HbA1c ≤7% in relation to the number of antidiabetic drugs prescribed for each patient. There were 2046 patients (9.5% of the entire study population) with no prescriptions for antidiabetic medication, 7633 patients (35.4%) with prescriptions for one drug, 6204 (28.7%) with prescriptions for two drugs, and 5703 (26.4%) with prescriptions for three or more drugs. The majority (53.6%) of untreated patients did not have any HbA1c measurements recorded. In contrast, the number of treated patients without HbA1c determinations was very low, ranging from 18.7% to 4.2%. Moreover, in the group of patients with excellent control, 39.6% maintained their target HbA1c level successfully using a single drug whereas subjects with very poor control failed to maintain their target HbA1c level despite intensification of treatment (56.1% were prescribed more than two drugs).
Figure 2 Prevalence of different levels of glycemic control in diabetic patients categorized according to number of antidiabetic drugs prescribed.
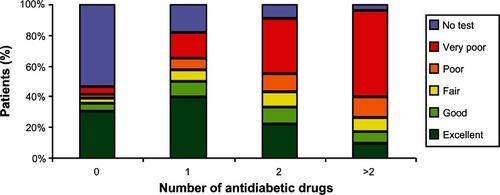
Table 2 Number of determinations and median values for HbA1c
Table 3 Number of antidiabetic drugs prescribed in the different cohorts of diabetic patients
The rate of adherence with antidiabetic medication () was significantly different in the six cohorts of diabetic patients, being 6.7%–4.6% in <40% and 64.7%–60.1% in ≥80%.
Table 4 Adherence to antidiabetic medication in different cohorts of diabetic patients
Total health care costs were calculated to be €30,433,264.79 and the mean cost per patient was €1557.49. The mean cost calculated per patient according to the prevalence of HbA1c ≤7% () showed a progressive and significant increase correlating with a progressive decrease in control of HbA1c, from €1291.56 in patients with excellent control to €1894.80 in patients with very poor control. Patients without any HbA1c tests showed the lowest mean cost at €859.90. Older age, presence of hypertension, dyslipidemia, cardiovascular disease, and uncontrolled HbA1c were factors that contributed significantly to increased health care costs in these patients ().
Table 5 Health care costs in different cohorts of diabetic patients
Table 6 Multivariate regression analysis
We also analyzed health care costs according to the first and last HbA1c levels recorded during the study period (). The intervals between the first and last HbA1c determinations were similar in all cohorts, and in the range of 17.1–18.4 months. The mean cost per patient increased progressively in patients with stable HbA1c <7%, 7.1%–8%, 8.1%–9%, and >9%. There was an increment in mean health care costs in patients with worsening control of HbA1c. Analysis of the different components of health care costs () showed that the progressive incremental cost was mainly because of antidiabetic drugs, hospitalizations for diabetes-related problems, and use of outpatient services.
Table 7 Mean cost per patient in different cohorts of diabetic patients determined according to the levels of first and last HbA1c determination performed during the study
Table 8 Distribution of health care costs
Discussion
Diabetes registries have been used for years to evaluate clinical care provided by health systems,Citation22 and are usually created from administrative data, such as those for hospital discharge diagnoses and pharmaceutical claims.Citation23,Citation24 The availability of detailed clinical data, including real-time laboratory test results, has improved the ability to build more sophisticated and accurate diabetes registries that capture more precisely defined cohorts of individuals with diabetes. With regard to laboratory tests, we selected plasma glucose and HbA1c levels to create the linkage with clinical and administrative databases. In addition to antidiabetic medication, we used three further criteria to identify diabetic patients, and documented a diabetes prevalence of 4.4%, which makes our cohort comparable with the entire Italian population.Citation25 Moreover, these criteria enabled identification of 9.5% of subjects who were not treated with antidiabetic medication. About half of these untreated subjects did not have any determination of HbA1c, while the majority of the remaining subjects had excellent HbA1c control. This apparently conflicting profile could be because: firstly, the presence in this cohort of a high percentage of subjects defined as diabetic on the basis of a single determination of fasting plasma glucose >126 mg/dL, which might be considered the weakest of the criteria we used; secondly, the inability of this analysis to capture diet and exercise habits, which have been shown to have a positive impact on glycemic control. The importance of the criteria used for inclusion in such registries is not trivial. For example, in a sample of residents of Ontario, Canada, Harris et al showed that the prevalence of diabetes ranged from 5% to 12% depending on which combinations of laboratory, pharmacy, and diagnosis data were used.Citation26 To determine the quality of control of diabetes in clinical practice, we subdivided our patients into five cohorts according to the percentage of HbA1c levels ≤7% during the two-year study period. HbA1c concentration is a good indicator of glycemic control during the previous 8–12 weeks and is used as the standard biomarker for the efficacy of glycemic management because it correlates well with development of microvascular complications and also (albeit to a lesser extent) macrovascular complications, according to a large epidemiological study.Citation27,Citation28 The treatment guidelines for patients with type 2 diabetes that existed during the study period recommended a target HbA1c level of ≤7%,Citation29 although the National Institute for Health and Clinical Excellence has more recently recommended a target HbA1c level of ≤7.5%.Citation30 Despite these recommendations, most patients still do not achieve their target HbA1c level in general practice.Citation7,Citation31 Among our diabetic patients with HbA1c determinations, only 25.7% had excellent control of diabetes (median HbA1c 6.4%) and 8.9% had good control (6.9%), while 31.5% had very poor control (8.2%). Of note is that more than 60% of patients in each of our study cohorts showed ≥80% adherence with antidiabetic medication, which is greater than the adherence figures reported by the World Health Organization,Citation6 and indicates that the quality of glycemic control decreases with increasing numbers of antidiabetic prescriptions. Other authors have documented significant differences in the use of diabetic medication at different levels of HbA1c control.Citation10 In order to quantify the association between health care costs attributable to diabetes and quality of control of diabetes in clinical practice, we used two different calculation methods, ie, one based on the percentage of HbA1c levels ≤7% and the other based on the first and the last determinations of HbA1c. Using the first method, we identified five cohorts. Patients with very poor HbA1c control (less than 20% of HbA1c determinations ≤7%) showed a cost per year increment of 46.7% (€947.40) compared with those having excellent control (more than 80% of HbA1c determinations ≤7%) who had a cost per year of €645.78. Our findings using this method of analysis highlight the significant differences in cost associated with each of the five levels of glycemic control. Even patients considered to have fair glycemic control, ie, HbA1c 7.1%–9%, had significantly higher total and prescription costs attributable to diabetes than patients with excellent glycemic control.
Using the second method, we identified sixteen cohorts of patients. Those with a first-last HbA1c determination >9% compared with those with a first-last HbA1c determination ≤7% showed an annual cost increment of 63.2% (€1042.37 versus €638.67, respectively). In general, we found a significant cost increment when the HbA1c increased during the follow-up period independent of the initial level, whereas decreasing HbA1c, although advantageous in the short-term, did not significantly change costs. Our findings also indicate that a modest (around 1%) incremental worsening of HbA1c resulted in greater health care costs and increased resource utilization in the two-year study period. However, modest incremental improvements in HbA1c control may not be sufficient to reduce costs in a meaningful way. The amount of antidiabetic medication prescribed, number of outpatient attendances, and frequency of hospitalizations for diabetes-related reasons contributed to the increased costs. Other researchers have found that reduction of HbA1c to ≤7% was associated with a 30% decrease in expenditure on long-term health care, and patients with HbA1c ≤8% had a lower likelihood of hospitalization.Citation10,Citation32,Citation33 This mixed-methods assessment of the cost and issues surrounding quality of measurement of glycemic control and use in primary care practices yielded interesting results. The data we collected enabled estimation of costs per patient in a context more easily understood by payers and policymakers.
The findings of the present study must be interpreted in light of some limitations. First, the analyses were performed using the databases of two local health units located in the north-center of Italy. Although these databases were deemed to cover the area of the local health units adequately, the results may not be generalizable to other populations. Second, the analysis only included subjects receiving antidiabetic medication, so it is unknown if all of our study subjects had a formal diagnosis of type 2 diabetes. However, we excluded subjects younger than 45 years of age to minimize the risk of inclusion of subjects with type 1 diabetes, which is common practice in retrospective analyses of databases.Citation34,Citation35 Menzin et al found a higher prevalence of patients with type 1 diabetes in the younger age groups.Citation11 Third, we did not examine place of residence, which could confound the association between glycemic control and diabetes-related health care costs. Fourth, we were unable to define time since initial diagnosis, a factor that may influence response to antidiabetic medication, level of glycemic control, and costs. Fifth, we only considered subjects receiving oral antidiabetic drugs or a combination of oral agents and insulin. Future work using alternative approaches, eg, based on type of medication that subjects require, may be of interest. Sixth, we did not consider costs related to other therapies (eg, lipid-lowering or antihypertensive medication) or hospitalizations for any other reason, which are both factors that may contribute to underestimation of the cost per patient. Finally, the two-year study period was too short to evaluate cardiovascular morbidity and total mortality. In conclusion, our study shows that cross-linkage between various clinical and administrative databases is critical for successfully implementing systems of care that are value-based. To be adopted and embraced fully, systems must be applicable to patient care across payment sources and must have adequate patient volumes in order to identify patient characteristics influencing costs and be able to estimate the expected costs of quality improvement or deterioration. Our results indicate that glycemic control (ie, HbA1c level) is a useful surrogate not only for diabetes-related complications but also for the associated health care costs.
Disclosure
The authors declare no conflicts of interest in this work.
References
- International Diabetes FederationDiabetes Atlas4th edBrussels, BelgiumInternational Diabetes Federation2009 Available from: http://www.diabetesatlas.org/content/diabetesAccessed March 29, 2013
- SobelBESchneiderDJCardiovascular complications in diabetes mellitusCurr Opin Pharmacol2005514314815780822
- GrundySMBenjaminIJBurkeGLDiabetes and cardiovascular disease: a statement for healthcare professionals from the American Heart AssociationCirculation19991001134114610477542
- StolarMGlycemic control and complications in type 2 diabetes mellitusAm J Med2010123SupplS3S1120206730
- Nichols-EnglishGPoirierSOptimizing adherence to pharmaceutical care plansJ Am Pharm Assoc200040475485
- World Health OrganizationAdherence to long-term therapies: evidence for actionGeneva, SwitzerlandWorld Health Organization Available from: http://whqlibdoc.who.int/publications/2003/9241545992.pdfAccessed March 31, 2013
- SaydahSFradkinJCowieCCPoor control of risk factors for vascular disease among adults with previously diagnosed diabetesJAMA200429133534214734596
- National Diabetes Information ClearinghouseNational diabetes statistics2011 Available from: http://diabetes.niddk.nih.gov/dm/pubs/statistics/Accessed March 29, 2013
- LauroRNicolucciAPublic Health and Health Policy An informed health policy on chronic diseasesScientific EditorConsorzio Mario Negri Sud2011
- OglesbyAKSecnikKBarronJAl-ZakwaniILageMJThe association between diabetes-related medical costs and glycemic control: a retrospective analysisCost Eff Resour Alloc20064116412255
- MenzinJKornJCohenJLoboFRelationship between glycemic control and diabetes-related hospital costs in patients with type 1 or type 2 diabetes mellitusJ Manag Care Pharm20101626427520433217
- KellyTNBazzanoLAFonsecaVAThethiTKReynoldsKHeJSystematic review: glucose control and cardiovascular disease in type 2 diabetesAnn Intern Med200915139440319620144
- TuomilehtoJLindstromJErikssonJGPrevention of type 2 diabetes mellitus by changes in lifestyle among subjects with impaired glucose toleranceN Engl J Med20013441343135011333990
- HuxJEIvisFFlintoftVBicaADiabetes in Ontario: determination of prevalence and incidence using a validated administrative data algorithmDiabetes Care20022551251611874939
- SolbergLIEngebretsonKISperl-HillenJMHroscikoskiMCO’ConnorPJAre claims data accurate enough to identify patients for performance measures or quality improvement? The case of diabetes, heart disease, and depressionAm J Med Qual20062123824516849780
- Di BariMBalziDRobertsATPrognostic stratification of older persons based on simple administrative data: development and validation of the “Silver Code”, to be used in emergency department triageJ Gerontol A Biol Sci Med201065159164
- Ministero del Lavoro, della Salute e delle Politiche Sociali. [Ministry of Labour, Health and Social Policies. Annual report on the hospitalization activity]2005 Available from: http://www.ministerosalute.it/programmazione/sdo/sezDocumenti.jsp?id=148&label=ospAccessed April 24, 2009 Italian
- CharlsonMEPompeiPAlesKLMcKenzieCRA new method of classifying prognostic comorbidity in longitudinal studies: development and validationJ Chronic Dis1987403733833558716
- LawrenceDBRagucciKRLongLBParrisBSHelferLARelationship of oral antihyperglycemic (sulfonylurea or metformin) medication adherence and hemoglobin A1c goal attainment for HMO patients enrolled in a diabetes disease management programJ Manag Care Pharm20061246647116925454
- Informatore farmaceutico – Medicinali [Pharmaceutical Informer -Drugs]2012ElsevierItaly Italian
- BarberJThompsonSMultiple regression of cost data: use of generalised linear modelsJ Health Serv Res Policy2004919720415509405
- KhanLMincemoyerSGabbayRADiabetes registries: where we are and where are we headed?Diabetes Technol Ther20091125526219344200
- BrownJBNicholsGAGlauberHSCase control study of 10 years of comprehensive diabetes careWest J Med2000172859010693367
- SelbyJVRayGTZhangDColbyCJExcess costs of medical care for patients with diabetes in a managed care populationDiabetes Care199720139614029283786
- ISTAT[Health conditions and use of health services]2008 Available from: http://www.ministerosalute.it/imgs/C_17_pubblicazioni_609_allegato.pdf. Italian
- HarrisSBGlazierRHTompkinsJWInvestigating concordance in diabetes diagnosis between primary care charts (electronic medical records) and health administrative data: retrospective cohort studyBMC Health Serv Res20101034721182790
- StrattonIMAdlerAINeilHAAssociation of glycaemia with macrovascular and microvascular complications of type 2 diabetes (UKPDS 35): prospective observational studyBMJ200032140541210938048
- The Diabetes Control and Complications Trial Research GroupThe relationship of glycemic exposure (HbA1c) to the risk of development and progression of retinopathy in the diabetes control and complications trialDiabetes1995449689837622004
- [No authors listed]Standards of medical care in diabetes – 2009Diabetes Care200932Suppl 1S13S6119118286
- National Collaborating Centre for Chronic ConditionsType 2 Diabetes: National Clinical Guideline for Management in Primary and Secondary Care (Update)London, UKRoyal College of Physicians2008
- Alvarez GuisasolaFMavrosPNoceaGAlemaoEAlexanderCMYinDGlycaemic control among patients with type 2 diabetes mellitus in seven European countries: findings from the Real-Life Effectiveness and Care Patterns of Diabetes Management (RECAP-DM) studyDiabetes Obes Metab200810Suppl 181518435669
- MenzinJLangley-HawthorneCFriedmanMBoulangerLCavanaughRPotential short-term economic benefits of improved glycemic control: a managed care perspectiveDiabetes Care200124515511194241
- ShettySSSecnikKOglesbyAKRelationship of glycemic control to total diabetes-related costs for managed care health plan members with type 2 diabetesJ Manag Care Pharm20051155956416137213
- HertzRPUngerANLustikMBAdherence with pharmacotherapy for Type 2 diabetes: a retrospective cohort study of adults with employer-sponsored health insuranceClin Ther2005271064107316154485
- VanderpoelDRHusseinMAWatson-HeidariTPerryAAdherence to a fixed-dose combination of rosiglitazone maleate/metformin hydrochloride in subjects with type 2 diabetes mellitus: a retrospective database analysisClin Ther2004262066207515823770