Abstract
Purpose
CHOICE (CHanges to treatment and Outcomes in patients with type 2 diabetes initiating InjeCtablE therapy) assessed patterns of exenatide bid and initial insulin therapy usage in clinical practice in six European countries and evaluated outcomes during the study.
Methods
CHOICE was a 24-month, prospective, noninterventional observational study. Clinical and resource use data were collected at initiation of first injectable therapy (exenatide bid or insulin) and at regular intervals for 24 months. Costs were evaluated from the national health care system perspective at 2009 prices.
Results
A total of 2515 patients were recruited. At the 24-month analysis, significant treatment change had occurred during the study in 42.2% of 1114 eligible patients in the exenatide bid cohort and 36.0% of 1274 eligible patients in the insulin cohort. Improvements in glycemic control were observed over the course of the study in both cohorts (P < 0.001 for both), but mean weight was reduced in the exenatide bid cohort (P < 0.001) and increased in the insulin cohort (P < 0.001) by 24 months. Across all countries, total per patient health care costs for the 24 months post baseline were €3997.9 in the exenatide bid cohort and €3265.5 in the insulin cohort (€1791.9 versus €2465.5 due to costs other than those of injectable therapy). When baseline direct cost and patients’ and disease characteristics were controlled for, mean direct costs differed by country (P < 0.0001), irrespective of treatment initiated, and the mean cost difference between treatments varied by country (P < 0.0001).
Conclusion
Much of the higher mean cost of exenatide bid, compared with insulin, therapy was compensated for by lower mean costs of other health service utilization. Costs associated with exenatide bid or insulin initiation varied across countries, highlighting the need to avoid generalization of resource use and cost implications of a particular therapy when estimated in specific country settings.
Introduction
An estimated 8.1% of Europe’s adult population (52.8 million people) has diabetes mellitus. The prevalence of the disease continues to grow; by 2030, it is estimated that 64.2 million individuals (9.5% of the world’s adult population) will live with diabetes mellitus.Citation1 Type 2 diabetes mellitus (T2DM) accounts for 85%–90% of all diabetes mellitus cases.Citation2 As the diabetes epidemic expands, associated health care demands and costs also continue to increase.Citation3 For example, the direct medical costs associated with diabetes mellitus in Europe in 2011 were estimated at $131 billion.Citation1 Moreover, the indirect costs associated with lost productivity due to disability, absenteeism, early retirement, social benefits, and caregivers are significant, exceeding the direct costs of diabetes care.Citation4
New classes of antidiabetes medication have been developed to address the unmet needs of the growing population of patients with T2DM. Glucagon-like peptide-1 (GLP-1) receptor agonists were first granted regulatory approval in Europe for the treatment of T2DM in 2006 and were subsequently introduced to the market. Regulatory approval does not require demonstration of the effects of therapy in usual care settings, and as the demand for data to support decision making escalates, there is a growing recognition that randomized controlled trials (RCTs) alone will not fill the information gaps.Citation5,Citation6 This is primarily because RCTs enroll a homogeneous patient population, carefully define treatment regimens, and require that these regimens be assiduously followed. As such, the management approach used in RCTs does not refect actual clinical practice.Citation7 In addition, resource use and costs of therapy can only be evaluated with limited reliability or validity in RCTs. For reasonable external validity and generalizability of the cost implications of a chosen treatment strategy, it is important to estimate these outcomes in more realistic clinical practice settings.
Well-designed observational research is an increasingly utilized complementary approach to enhance the evidence upon which the management of a disease is based.Citation8 This type of research is particularly important in T2DM because of the chronic, complex nature of the condition, and the large and heterogeneous nature of the affected population. According to Ligthelm et al, “a comprehensive evidence base, including both RCTs and high-quality, well-designed observational studies, is essential to make balanced judgments about the management of diabetes.”Citation9
Exenatide bid delivered by subcutaneous injection was the first approved GLP-1 receptor agonist. Although exenatide once weekly and liraglutide have more recently been approved, these GLP-1 receptor agonists were not available for routine clinical use at the initiation of this study and hence were not included for study. RCTs have shown that exenatide bid provides glucose-lowering efficacy similar to that of insulin glargine and biphasic insulin aspart, and that in contrast with insulins, it is associated with weight loss.Citation10–Citation12 These results indicate that, in many patients with T2DM, exenatide bid could be an alternative to initial conventional insulin therapy. Economic modeling of clinical trial data using the CORE (Center for Outcomes Research) diabetes model projected the therapy to be cost effective in comparison with insulin glargine in multiple European geographies.Citation13–Citation16 Post launch retrospective analyses of prescription claims data in the United States have also compared health care resource use (and associated costs) for patients receiving exenatide bid and insulin glargine.Citation17–Citation19 However, these latter studies are of limited use in understanding the European health care setting, where health services are predominantly publicly funded and a large diversity in drug reimbursement systems exists. CHOICE (CHanges to treatment and Outcomes in patients with type 2 diabetes initiating InjeCtablE therapy) was the first prospective observational study to evaluate patterns of exenatide bid and initial insulin therapy usage and outcomes (clinical and economic) in clinical practice in multiple European countries. This paper focuses on the resource use and associated costs during the 24 months after the initiation of injectable therapy with exenatide bid or insulin in CHOICE.
Patients and methods
Design and patients
CHOICE (http://www.clinicaltrials.gov identifier NCT00635492) is a prospective, multinational, noninterventional observational study that recruited patients from six European countries (Denmark, Belgium, France, Germany, Greece, and Sweden) between January 2008 and October 2009. Patients were recruited through 322 investigators (88.0% at secondary care sites) and invited to participate only after the clinical decision had been made that they would initiate exenatide bid or insulin. At study entry, patients could be taking any oral antidiabetes (OAD) medication. Appropriate ethical review board approval was obtained and patients gave written informed consent for the use of their data at the time of initiation of injectable therapy (baseline). Data were collected from patients at routine clinical care visits at baseline and at approximately 3, 6, 12, 18, and 24 months thereafter. Patients referred from the study site to another health care professional (HCP) during the study were followed up by contacting the new provider and by postal patient questionnaires. For more details on the design of the CHOICE study, see Matthaei et al.Citation20
The primary endpoint of CHOICE was the time to a significant treatment change after patients with T2DM initiated their first injectable, glucose-lowering therapy (exenatide bid or insulin) in clinical practice. This allowed evaluation of patterns of initial injectable therapy usage in patients with T2DM. Significant treatment change was defined as at least one of the following: discontinuation of any exenatide bid/insulin initiated at baseline; addition of a new medication (any route of administration) for the treatment of T2DM; a change in the number of times insulin is administered per day; or substitution of a human insulin for an analog insulin or vice versa (not including switching between brands of the same class/type of insulin). Secondary endpoints included reasons for significant treatment change, clinical outcomes, and medication usage after initiation of exenatide bid or insulin. This paper reports the real-world economic outcomes of the study and focuses on the secondary endpoint of estimating health care resource utilization and costs associated with treatment of T2DM. Resource use data were collected at baseline (for the previous 6 months) and all follow-up visits (“since last visit”), and included the following:
Antidiabetes medication (OAD and injectable therapy; agent and dosage);
Self-monitoring of blood glucose (SMBG);
Incidence and summary of number of contacts with primary care (primary care doctor and nurse) and secondary care HCPs (diabetologist/endocrinologist, internal medicine, specialist nurse, dietician, ophthalmologist, chiropodist/podiatrist, cardiologist, nephrologist, and neurologist);
Hospitalizations, including emergency room (ER) visits and overnight hospitalizations;
Concomitant medication (lipid-lowering, cardiovascular, antiplatelet, weight lowering, and antiemetic medication).
Direct medical costs and resource use costs were evaluated from the national health care system (third-party payer) perspective at 2009 prices. All prices were taken from published sources and converted from local currencies to Euros (€). Direct nonmedical costs (eg, transportation costs) and indirect costs (eg, productivity losses) were not assessed in this study. Also, data on concomitant medication (other than OAD therapies) were considered as additional information and were not collected with all details needed for costing. For each country, per-patient costs were calculated by applying local unit costs (from the payer perspective) to each resource used: exenatide bid/insulin costs, OAD medication costs, resource utilization costs, and SMBG costs.
The following assumptions were employed when calculating costs: all medications were assumed to be branded formulations; when medications with multiple brand names were used mean costs were taken; combination medication was assigned a cost for the total daily dose of the lowest priced medication; and data on the average number of SMBG measurements per week over the past month were used to calculate daily costs that were applied to each day over the observation interval. Data on hospitalizations for acute complications, long-term complications, and hypoglycemia were collected. Hospitalization costs were valued on the basis of cost per episode for each type of admission.
Analysis
Sample size
The study aimed to recruit a maximum of 800 patients per country/country group with approximately 60% initiating insulin and 40% initiating exenatide bid. The insulin cohort was to be larger than the exenatide bid cohort because of the greater variability in the former cohort (linked to use of different insulin regimens). For more detail on the CHOICE study protocol, see Matthaei et al.Citation20
Statistical analysis
All patients who provided consent to release information, fulfilled the study entry criteria, and had a case report form summary page signed by an investigator were included in the analyses (“eligible patients”). Due to the observational nature of this study, patients who violated the study description were included in the analyses. Analyses were performed using all data up to the point of the last data collection for patients who were lost to follow-up or who withdrew from the study.
Analyses were conducted on the eligible population according to the cohort (insulin or exenatide bid) that they were placed in at baseline (“initiators analysis”). As anticipated, analysis of the baseline data indicated that the two treatment cohorts comprised substantially different patient populations (see Matthaei et al).Citation20 A propensity score-derived matched subgroup (exenatide bid versus insulin) was analyzed to understand the cost outcomes in a more comparable patient subgroup. To further assess the role of patient selection, as well as to control for differences between countries that were likely to exist due to treatment practices and costs specific to each national health care setting, the direct medical cost per patient following initiation of therapy was modeled (post hoc) using analysis of covariance. Total cost per patient per 6 months (taking into account all the information available between baseline and 24 months and adjusting for duration of follow-up) was the dependent variable; treatment (exenatide bid/insulin), country, and country-by-treatment interaction were the independent (categorical) variables; propensity score and treatment cost prior to baseline were included as covariates. The baseline cost was the total cost during the 6 months prior to inclusion in the study.
Outliers
All data entered by patients and HCPs were used in the primary analysis. Outlying data points for OAD and injectable medication doses were defined as values ≥200% of maximum daily doses. No outliers were found according to this criterion. Missing data were not imputed.
Results
A total of 2515 patients were recruited after the decision had been made that they would initiate injectable therapy for the first time in routine clinical practice; 2388 (95.0%) were eligible for the analysis (1114 in the exenatide bid cohort and 1274 in the insulin cohort). Throughout the 24-month study, 23.5% of patients discontinued the study (lost to follow-up was the most common reason in both cohorts [≈13.5%], although 7.4% of exenatide bid and 3.5% insulin patients discontinued due to “subject decision”).
At the 24-month analysis, significant treatment change had occurred during the study in 42.2% of 1114 eligible patients in the exenatide bid cohort and 36.0% of 1274 eligible patients in the insulin cohort.Citation21 The most common reason for discontinuing the initial injectable therapy was inadequate response (15.3% of the exenatide bid cohort and 6.8% of the insulin cohort); adverse events were the reason for discontinuing initial injectable therapy for 8.2% of the exenatide bid cohort and 0.9% of the insulin cohort.Citation21 The clinical results of CHOICE and additional details regarding the reasons for discontinuation of initial injectable therapy are reported elsewhere.Citation21
Demographic and clinical characteristics
Overall, patients in the exenatide bid cohort tended to be younger and more obese, with greater comorbid illness but better glycemic control and fewer diabetes complications than the insulin cohort (; see Matthaei et al).Citation20 Patients in the exenatide bid cohort also appeared more likely to have received multiple OADs than patients in the insulin cohort ().
Table 1 Baseline clinical and demographic characteristic of patients with type 2 diabetes mellitus initiated on exenatide bid or insulin therapy
Clinical outcomes
Improvements in mean glycated hemoglobin (HbA1c) over 24 months were observed in both the exenatide bid and insulin cohorts. When controlling for baseline HbA1c, treatment, and visit, statistically significant improvements in mean HbA1c were observed over the course of the study in both groups (analysis of covariance t-test: P < 0.001 for mean change from baseline for both). In the exenatide bid group, mean (standard deviation [SD]) HbA1c was 8.4 (1.4)% units at baseline, 7.5 (1.2)% units at 3 months, and remained between 7.3 (1.2)% units and 7.4 (1.2)% units at each further visit. Corresponding mean (SD) HbA1c values in the insulin group were 9.2 (1.9)% units, 7.5 (1.4)% units, and 7.3 (1.0)% units to 7.3 (1.1)% units.
Least square mean weight was significantly reduced in the exenatide bid cohort by 3 months (least square mean [standard error] reduction of 2.2 [0.1] kg from baseline), remaining below baseline levels thereafter, and was significantly increased in the insulin cohort by 6 months (least square mean [standard error] increase of 0.8 [0.2] kg); least square mean (standard error) weight had increased by 1.8 (0.2) kg from baseline in the insulin cohort by 24 months (analysis of covariance t-test: P < 0.001 versus baseline for both cohorts, when controlling for baseline weight, treatment, and visit). Hypoglycemia was reported (based on patient recall) by 18.4% of the exenatide bid cohort and 36.8% of the insulin cohort. At 24 months, the proportion of patients who met the clinically relevant composite endpoint suggested by Zinman et al (HbA1c <7.0%, no weight gain [≤1 kg], and no hypoglycemia)Citation22 was 25.9% in the exenatide bid cohort and 10.0% in the insulin cohort. Overall, 30.8% of the exenatide bid cohort reported gastrointestinal events; this was primarily in the first 6 months post baseline, with fewer than 8% reporting these events in all subsequent 6-month periods. A total of 5.3% of patients in the insulin cohort experienced gastrointestinal events (most commonly abdominal pain in 2.5% of patients). Adverse events were recorded as the reason for treatment discontinuation in 91 patients in the exenatide bid cohort (8.2%) and eleven patients in the insulin cohort (0.9%).
Propensity matching of baseline patient and disease-related characteristics identified 619 pairs of patients who could be compared (51.8% of the total sample). In this subgroup, there was no significant difference between treatment cohorts regarding mean (SD) change in HbA1c (P = 0.7587) or in the percentages of patients at 24 months with HbA1c <7.0% (P = 0.4904) or <6.5% (P = 0.3390). However, patients in the exenatide bid group had mean weight loss in contrast with those in the insulin group who had mean weight gain (difference: P < 0.0001) and the exenatide bid group had a lower incidence of hypoglycemia (P < 0.0001) than the insulin group during the study.
Resource use
Antidiabetes medication
In the exenatide bid cohort, most patients (91.1%) were initiated on a dosage of 10 μg/day, with 8.1% of patients initiated on exenatide bid 20 μg/day. At the 24-month visit, 393 patients had discontinued exenatide bid; of these, ten patients (2.5% of discontinuers) did not start anything else during the study, 373 (94.9%) started an (additional) OAD medication, 53 (13.5%) started liraglutide (a GLP-1 receptor agonist approved following commencement of the study), and 283 (72.0%) started insulin. Of those who did not discontinue, the mean (SD) daily dose of exenatide bid was 16.18 (4.88) μg/day at 24 months (). Throughout the study, 15 patients added insulin to their exenatide bid regimen.
Table 2 Mean daily dose of injectable therapy and the percentages of patients using oral antidiabetes drug medication
Of the 1274 eligible patients in the insulin cohort, 49.2% initiated insulin with basal only insulin, 24.5% initiated mixtures, 13.7% initiated a basal-bolus regimen, and 11.5% initiated short-acting insulin only (1.1% other; ), although there was between-country variability. The mean overall (mean range across all insulin regimens) daily dose of insulin therapy at baseline was 25.04 (15.40–46.09) IU. Over the 24-month study, 155 patients discontinued their initial insulin; 18 of these patients (11.6% of discontinuers) did not start anything else during the study, 20 (12.9%) started an (additional) OAD medication, and eleven (7.1%) started a GLP-1 receptor agonist (liraglutide). At 24 months, 21.4% of patients were taking basal-bolus therapy, 27.8% of patients were receiving basal only insulin regimens, 3.7% of patients were receiving short-acting only insulin regimens, and 19.9% of patients were using only mixtures. Across all countries, the mean (range across the different insulin regimens) daily insulin dose at 24 months was 40.78 (23.59–67.57) IU, with the lowest and highest average daily doses observed among patients using long-acting and other regimens, respectively. Across the different regimens, insulin doses increased by 21.0% (46.09 IU/day to 55.78 IU/day) for basal-bolus regimens, 33.0% (33.75 IU/day to 44.88 IU/day) for mixtures, 41.7% (21.28 IU/day to 30.15 IU/day) for short-acting regimens, 53.2% (15.40 IU/day to 23.59 IU/day) for long-acting regimens, and 67.1% (40.43 IU/day to 67.57 IU/day, other insulin regimens) from baseline to 24 months.
Overall, 95.5% of patients in the exenatide bid cohort and 76.7% of patients in the insulin cohort used at least one OAD agent over the 24-month observation period. At baseline, 86.1% of patients initiating exenatide bid used metformin or a combination of metformin with a sulfonylurea or thiazolidinedione. The corresponding proportion of patients using metformin in the insulin cohort was 64.8%. Use of sulfonylureas fluctuated throughout the study in both patient cohorts, while an increase in dipeptidyl peptidase-4 inhibitor use was observed in both cohorts, although the proportion of users was no more than 5.5% among exenatide bid and 2.9% among insulin starters at any point during the study.
Concomitant medication
The proportion of patients in the exenatide bid and insulin cohorts receiving non-antihyperglycemic concomitant medications was 87.7% and 85.2%, respectively, at baseline and ranged from 88.4% to 90.7% and 87.7% to 89.7%, respectively, during each 6-month period after initiation of injectable therapy. Approximately 80% (79.3%–83.4%) of patients in the exenatide bid group received cardiovascular medication throughout the observation period (77.2% at baseline), and use among insulin patients ranged from 76.8% to 79.3% during this period (74.0% at baseline).
SMBG
The overall percentage of patients using blood glucose monitoring, around 80% in both cohorts at baseline, reached 90.6% in patients initiating exenatide bid and 98.7% in patients initiating insulin therapy 18–24 months post baseline (). The mean (SD) number of strips used per week in the insulin cohort was 8.0 (8.7) at baseline and 13.0 (8.8) during the 4 weeks before the 24-month visit. In the exenatide bid cohort, the mean number of strips used per week was 7.4 (8.0) at baseline and 7.8 (7.3) during the 4 weeks before the 24-month visit.
Table 3 Resource use in patients with type 2 diabetes mellitus receiving exenatide bid or insulin therapy by country
HCP contacts
In the exenatide bid cohort, the percentage of patients visiting or consulting HCPs was >97% both before and after treatment initiation in all countries except Greece, where it was 87.4% at baseline and 92.7% after initiation. The mean number of contacts with HCPs throughout the study, for all countries and by country, is reported in and ; Denmark had the fewest mean (SD) contacts over the entire 24-month observation period (10.6 [6.9]). The highest 24-month mean (SD) HCP utilization was observed in Germany (32.4 [17.8]).
Figure 1 Mean number of health care professional contacts per 6 months by country during treatment with (A) exenatide bid or (B) insulin therapy in clinical practice.
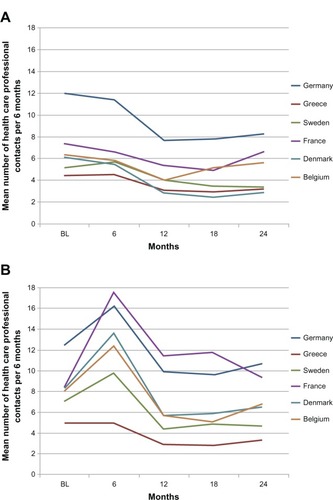
In the insulin cohort, the percentage of patients consulting HCPs ranged from 87.9% in Greece to 100% in Denmark before initiation and from 92.7% in Greece to 100% in Denmark, France, Germany, and Sweden after insulin initiation. The mean number of visits or consultations with HCPs following insulin initiation in all countries and by country is reported in and . The greatest decline in mean HCP contacts from baseline to 24 months was observed in Greece and Sweden (), which also reported the lowest 24-month mean (SD) numbers of visits, with 12.6 (11.8) and 21.9 (12.0) visits, respectively, during this period. The highest 24-month mean (SD) number of contacts was 42.4 (31.3) in Germany and 42.2 (78.9) in France ().
Hospitalizations
During the 6 months prior to initiating injectable treatment, the percentage of patients with at least one diabetes-related hospitalization was 4.8% in the exenatide bid cohort and 6.4% in the insulin cohort across all countries. During the 18–24-month period, hospital admission rates in both cohorts were 1.2% and 1.4%, respectively ().
The proportion of patients who reported visiting the ER across all countries in the 6 months prior to baseline was 2.8% and 5.7% in exenatide bid and insulin cohorts, respectively. In both groups, visits to the ER were 1.5% and 2.4%, respectively, during the 6-month period preceding the 24-month study visit ().
Costs
Total direct costs comprised costs of T2DM medications, self-testing strips, and contacts with HCPs and hospitalizations ( and ).
Figure 2 Mean cost (€) per patient before and after initiation of exenatide bid or insulin in clinical practice.
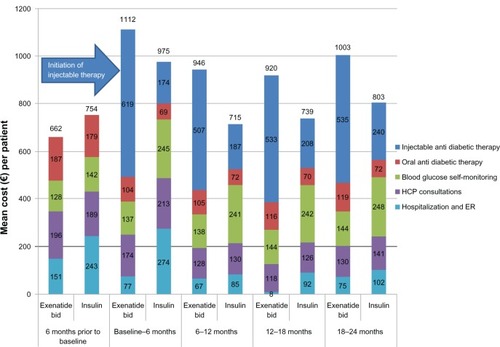
Table 4 Mean direct medical cost (€) per patient receiving exenatide bid or insulin therapy in clinical practice
In the exenatide bid cohort and across all countries, the total mean health care costs over the 24 months post baseline were €3997.9 per patient, of which €2206.0 (55.2%) was the cost of injectable therapy, mainly exenatide bid. In the insulin cohort, the total 24-month cost was €3265.5, of which injectable therapy accounted for €800.0 (24.5%). The mean 24-month direct cost of OAD medications, SMBG, HCP consultations, hospitalization, and ER visits made up the remaining €1791.9 in the exenatide bid cohort and €2465.5 in the insulin cohort; the largest contributor to these costs was SMBG in both cohorts, which accounted for €561.8 (14.1% of total costs) and €975.3 (29.9%) in the exenatide bid and insulin groups, respectively. Nearly one-half (47.9%) of the higher cost of injectable therapy in the exenatide bid cohort (€1406) was offset by the lower cost of other medical costs, resulting in an overall excess cost of €732.4 for the exenatide bid cohort compared with the insulin cohort during the 24-month follow-up period (€366.2/year).
The mean direct cost of treating T2DM across all countries in the 6 months prior to the initiation of injectable therapy was €661.8 in the exenatide bid group and €753.6 in the insulin group. Mean direct costs in the 6-month period after the initiation of first injectable therapy are presented in . The mean direct cost in the insulin cohort reached €975.4 in the 6-month period following initiation, but it was between €715 and €803 thereafter (). Notably the mean cost of SMBG was €142.3 during the 6 months prior to insulin initiation and €245.1 during the first 6-month post insulin initiation period; respective mean costs of health service utilization (hospitalization and ER visits) were €243.3 and €274.4. Mean costs due to SMBG remained higher than €240.0 until the end of the 24-month study period ().
shows that when controlling for baseline direct cost and patients and disease characteristics, direct mean costs differed by country (P < 0.0001) irrespective of the treatment initiated, and that the mean cost difference between treatments varied by country (P < 0.0001). The increased cost of exenatide bid compared with insulin was greatest in France, Greece, and Sweden (). The differences found in Belgium, Denmark, and Germany were not statistically significant.
Table 5 Analysis of covariance for direct medical cost per patient per 6 months during treatment with exenatide bid or insulin in patients with type 2 diabetes mellitus
An analysis of cost data using the matched subpopulation (across countries) showed that the longitudinal patterns remained the same. The 24-month mean cost in this subpopulation was €4069.2 in the exenatide bid group and €3402.4 in the insulin group ().
Discussion
This paper presents the results of health service resource use and costs incurred when patients initiated exenatide bid or insulin as their first injectable antidiabetes therapy across six European countries. The findings are relevant as supplementary information for health service administrators, clinical guideline development, and reimbursement authorities.
The authors believe that the differences in resource use identified at baseline refect differences in patient and disease state characteristics that are relevant to the choice of injectable therapy and, to some extent, the content of the product label. The high proportion of patients receiving OAD medication at baseline in the exenatide bid compared with the insulin cohort is likely mainly explained by label restrictions, which indicate that exenatide bid should be initiated after failure of OAD, and in combination with metformin, sulfonylurea, and/or thiazolidinedione therapy. This baseline difference was carried over the entire 24-month observation period.
The proportion of patients who reported monitoring their blood glucose level, a common component of standard care at the time of the study, was similar and rather high in both cohorts at baseline and increased, as expected, after the new therapy was initiated. The proportion of patients continuing monitoring over 24 months remained high in both treatment cohorts; this may refect the increase in basal insulin dose and inclusion of a prandial component in the regimen of some patients in the insulin cohort over the course of the study. The high baseline level of blood glucose monitoring is interesting given the results of recent systematic reviews questioning the value of this practice in patients not receiving insulin.Citation23,Citation24 The findings may have been due to inadequate glycemic control in these patients and could have contributed to physicians’ willingness to change the antidiabetes treatment of their patients. Moreover, enrollment into the observational study itself and the fact that the study was predominantly (88.0%) performed by secondary care physicians (mainly diabetologists) familiar with blood glucose monitoring might have impacted the use of SMBG both before and during the study period.
Somewhat higher baseline values for the mean number of HCP contacts and proportions of patients who had been hospitalized or visited ER in the 6-month period preceding the baseline visit were observed in patients initiating insulin therapy compared with exenatide bid. This is likely a reflection of the longer time since diagnosis, higher mean age, and, hence, more severe state of the disease, including a higher prevalence of both micro- and macrovascular complications, among patients in the insulin cohort (). One very clear difference in resource use patterns after initiation of injectable therapy was an initial increase in HCP visits in the insulin cohort but not in the exenatide bid cohort. This could relate to two things: the need to adjust insulin dosage and an increase in the proportion of patients reporting hypoglycemic events 6 months post initiation. After the initial peak, however, the mean number of HCP contacts declined to below baseline levels in the insulin cohort, but remained higher than in patients who initiated exenatide bid. This pattern was similar in all countries except Greece, which also had the lowest baseline number of HCP visits at baseline, and demonstrates that the therapeutic choice may impose clear further burden on health care services. The higher level of HCP contact in the insulin cohort, when compared with the exenatide bid cohort, however, may be partly due to the higher age and longer duration of diabetes in the insulin cohort.
Results from cost analyses show that, from the health service point of view, it is important to consider wider resource use impact when assessing therapeutic options and their availability. In this case for exenatide bid and insulin, a large proportion of the higher cost of exenatide bid therapy is compensated for by lower costs related to other health service utilization. Moreover, it is worth noting that 2 years of follow-up is likely not long enough to fully capture treatment costs of long-term complications of T2DM or to understand the impact of (mean) weight loss observed with exenatide bid versus weight gain with insulin.
Another important finding of this analysis is that mean costs varied significantly across countries. The authors believe that this variation was also in patterns of how the cost accumulated over time after initiation of therapy in each group. In some countries, 6-month mean costs over the 24-month post injectable initiation period were not statistically significantly higher in the exenatide bid compared with the insulin cohort. This highlights the importance of caution in generalizing the resource use and cost implications of a particular therapy estimated in specific country settings.
Limitations
CHOICE was a prospective, observational (noninterventional) study and was therefore subject to the general limitations that can be associated with this type of study, including the unknown magnitude of observer effects, the potential for investigators to be influenced by the scrutiny that occurs during a prospective study, and the potential for selection bias. The inclusion of two treatment arms should have helped to reduce prescribing bias, as would the fact that patients were invited to participate in the study only after the clinical decision had been made that they would initiate exenatide bid or insulin. This inclusion criterion also avoided several additional problems identified with some observational studies.Citation25,Citation26 Nonrandom selection of patients who initiated exenatide bid or insulin is naturally a concern for comparisons between groups, although this does reflect the real-world usage of these drugs.
This paper reports only the resource use and cost implications of the therapeutic options under study, which provide a limited view. Any additional cost related to a therapy should be assessed against potential clinical benefits, which have been reported elsewhere.Citation21 Furthermore, appropriate health technology assessment would necessarily involve modeling of the appropriate long-term costs, benefits, and risks typically associated with treatment of T2DM. As already noted, exenatide bid and insulin were the only injectable therapies available at the time the study was initiated. Exenatide once weekly and liraglutide have more recently been approved, and in clinical trials these agents appeared to have advantages over exenatide bid in terms of reductions in fasting plasma glucose levels and, to a lesser extent, HbA1c, although exenatide bid was better for regulating postprandial glucose levels than these comparator agents.Citation27 However, no real-world resource use and cost data are currently available to compare these GLP-1 receptor agonists, and any differences will need to be addressed in future studies.
Finally, it is worth noting that the study was primarily conducted in secondary (specialist) care settings (88% of study physicians), which may have resulted in the proportion of secondary care HCP contacts during the follow-up period being higher than in typical clinical practice. Consequently, the proportion of HCP-related cost may be overestimated due to differences in unit costs between secondary and primary care services. As this affects both study cohorts equally, it is not likely a major source of bias with regard to relative costs.
Conclusion
Some of the higher costs of exenatide bid therapy compared with insulin therapy were compensated for by lower costs related to other health service utilization, refecting the importance of considering wider resource use impact when assessing therapeutic options and their availability. Costs associated with initiation of exenatide bid or insulin varied significantly across countries, with no statistically significant differences observed between these treatment options in some countries. This highlights the need to avoid generalization of the resource use and cost implications of a particular therapy when estimated in specific country settings.
Acknowledgments
The study and the development of this manuscript were sponsored by Eli Lilly and Amylin Pharmaceuticals, LLC. The authors would like to acknowledge Caroline Spencer (Rx Communications, Mold, UK) for medical writing assistance with the preparation of this article, funded by Eli Lilly.
Disclosure
Stephan Matthaei has received honoraria from Eli Lilly for lectures and consultancy. Bruno Guerci has received honoraria from Eli Lilly for consultancy. Urpo Kiiskinen, Matthew Reaney, Jacek Kiljański, Carole Salaun-Martin, and Hélène Sapin are employees of Eli Lilly: Urpo Kiiskinen, Jacek Kiljański, and Carole Salaun-Martin are holders of Eli Lilly shares and share options; Matthew Reaney and Hélène Sapin are not shareholders. Chantal Mathieu is an advisory board member for Lilly Belgium. Claes-Göran Östenson has received honoraria from Eli Lilly for consultancy. Thure Krarup is an advisory board member for Lilly Denmark. Michael Theodorakis reports no conflicts of interest in this work.
References
- IDF Diabetes Atlas5th ed [homepage on the Internet]BrusselsInternational Diabetes Federation2011 [updated November 14, 2012; cited October 8, 2012]. Available from: http://www.idf.org/diabetesatlas/Accessed December 13, 2012
- Diabetes, fact sheet no 312 [webpage on the Internet]GenevaWorld Health Organization2012 [updated Sep 2012]. Available from: http://www.who.int/mediacentre/factsheets/fs312/en/index.htmlAccessed December 13, 2012
- Centers for Disease Control and PreventionPrevalence and incidence1999 Diabetes Surveillance ReportAtlanta, GAUS Department of Health and Human Services, Centers for Disease Control and Prevention2004
- KanavosPvan den AardwegSSchurerWDiabetes Expenditure, Burden of Disease and Management in 5 EU CountriesLondonLSE Health, London School of Economics2012 Available from: http://www2.lse.ac.uk/LSEHealthAndSocialCare/research/LSEHealth/MTRG/LSEDiabetesReport26Jan2012.pdfAccessed December 20, 2012
- LeonardDTComparative effectiveness and real-world evidenceAm J Manag Care201016641041120560684
- DreyerNASchneeweissSMcNeilBJGRACE InitiativeGRACE principles: recognizing high-quality observational studies of comparative effectivenessAm J Manag Care201016646747120560690
- WareJHHamelMBPragmatic trials – guides to better patient care?N Engl J Med2011364181685168721542739
- MannCJObservational research methods. Research design II: cohort, cross sectional, and case-control studiesEmerg Med J2003201546012533370
- LigthelmRJBorziVGumprechtJKawamoriRWenyingYValensiPImportance of observational studies in clinical practiceClin Ther200729Spec12841292
- BarnettAHBurgerJJohnsDTolerability and efficacy of exenatide and titrated insulin glargine in adult patients with type 2 diabetes previously uncontrolled with metformin or a sulfonylurea: a multinational, randomized, open-label, two-period, crossover noninferiority trialClin Ther200729112333234818158075
- HeineRJVan GaalLFJohnsDExenatide versus insulin glargine in patients with suboptimally controlled type 2 diabetes: a randomized trialAnn Intern Med2005143855956916230722
- NauckMADuranSKimDA comparison of twice-daily exenatide and biphasic insulin aspart in patients with type 2 diabetes who were suboptimally controlled with sulfonylurea and metformin: a non-inferiority studyDiabetologia200750225926717160407
- RayJABoyeKSYurginNExenatide versus insulin glargine in patients with type 2 diabetes in the UK: a model of long-term clinical and cost outcomesCurr Med Res Opin200723360962217355742
- MittendorfTSmith-PalmerJTimlinLHappichMGoodallGEvaluation of exenatide vs insulin glargine in type 2 diabetes: cost-effectiveness analysis in the German settingDiabetes Obes Metab200911111068107919732121
- BrandleMErny-AlbrechtKMGoodallGSpinasGAStreitPValentineWJExenatide versus insulin glargine: a cost-effectiveness evaluation in patients with type 2 diabetes in SwitzerlandInt J Clin Pharmacol Ther200947850151519640359
- GoodallGCostiMTimlinL[Cost-effectiveness of exenatide versus insulin glargine in Spanish patients with obesity and type 2 diabetes mellitus]Endocrinol Nutr2011587331340 Spanish21719364
- MisurskiDLageMJFabunmiRBoyeKSA comparison of costs among patients with type 2 diabetes mellitus who initiated therapy with exenatide or insulin glargineAppl Health Econ Health Policy20097424525419905038
- PawaskarMZagarASugiharaTShiLHealthcare resource utilization and costs assessment of type 2 diabetes patients initiating exenatide bid or glargine: a retrospective database analysisJ Med Econ2011141162721158486
- BaserOWeiWBaserEXieLClinical and economic outcomes in patients with type 2 diabetes initiating insulin glargine disposable pen versus exenatide bidJ Med Econ201114667368021892858
- MatthaeiSReaneyMMathieuCPatients with type 2 diabetes initiating exenatide BID or insulin in clinical practice: CHOICE studyDiabetes Ther201231622714818
- MathieuCÖstensonCGMatthaeiSUsing exenatide twice daily or insulin in clinical practice: results from CHOICEDiabetes Therapy
- ZinmanBSchmidtWEMosesALundNGoughSAchieving a clinically relevant composite outcome of an HbA1c of <7% without weight gain or hypoglycaemia in type 2 diabetes: a meta-analysis of the liraglutide clinical trial programmeDiabetes Obes Metab2012141778221883806
- MalandaULWelschenLMRiphagenIIDekkerJMNijpelsGBotSDSelf-monitoring of blood glucose in patients with type 2 diabetes mellitus who are not using insulin [review]Cochrane Database Syst Rev20121CD00506022258959
- ClarCBarnardKCumminsERoylePWaughNAberdeen Health Technology Assessment GroupSelf-monitoring of blood glucose in type 2 diabetes: systematic reviewHealth Technol Assess201014121140
- GaleEAPost-marketing studies of new insulins: sales or science?BMJ2012344e397422692652
- YudkinJSPost-marketing observational trials and catastrophic health expenditureBMJ2012344e398722692653
- ArodaVRHenryRRHanJEfficacy of GLP-1 receptor agonists and DPP-4 inhibitors: meta-analysis and systematic reviewClin Ther20123461247125822608780