Abstract
Introduction
The economic burden associated with the treatment of low back pain (LBP) in the United States is significant. LBP caused by sacroiliac (SI) joint disruption/degenerative sacroiliitis is most commonly treated with nonoperative care and/or open SI joint surgery. New and effective minimally invasive surgery (MIS) options may offer potential cost savings to Medicare.
Methods
An economic model was developed to compare the costs of MIS treatment to nonoperative care for the treatment of SI joint disruption in the hospital inpatient setting in the US Medicare population. Lifetime cost savings (2012 US dollars) were estimated from the published literature and claims data. Costs included treatment, follow-up, diagnostic testing, and retail pharmacy pain medication. Costs of SI joint disruption patients managed with nonoperative care were estimated from the 2005–2010 Medicare 5% Standard Analytic Files using primary International Classification of Diseases, Ninth Revision, Clinical Modification (ICD-9-CM) diagnosis codes 720.2, 724.6, 739.4, 846.9, or 847.3. MIS fusion hospitalization cost was based on Diagnosis Related Group (DRG) payments of $46,700 (with major complications - DRG 459) and $27,800 (without major complications - DRG 460), weighted assuming 3.8% of patients have complications. MIS fusion professional fee was determined from the 2012 Medicare payment for Current Procedural Terminology code 27280, with an 82% fusion success rate and 1.8% revision rate. Outcomes were discounted by 3.0% per annum.
Results
The extrapolated lifetime cost of treating Medicare patients with MIS fusion was $48,185/patient compared to $51,543/patient for nonoperative care, resulting in a $660 million savings to Medicare (196,452 beneficiaries at $3,358 in savings/patient). Including those with ICD-9-CM code 721.3 (lumbosacral spondylosis) increased lifetime cost estimates (up to 478,764 beneficiaries at $8,692 in savings/patient).
Conclusion
Treating Medicare beneficiaries with MIS fusion in the hospital inpatient setting could save Medicare $660 million over patients’ lifetimes.
Introduction
Low back pain (LBP) is an extremely prevalent and costly condition, affecting over 90% of adults in the United States at some point during their lifetime.Citation1 The prevalence of chronic LBP in the US has increased from 3.9% in 1992 to 10.2% in 2006.Citation2 Claims associated with LBP among Medicare beneficiaries increased by 131.7% from 1991 to 2002 in the US, and the associated charges to Medicare during this time period increased by 387.2%.Citation3 Overall, the total cost burden associated with LBP in the US, including lost productivity and decreased wages, is estimated to range between $60 billion and $200 billion annually.Citation4,Citation5
The sacroiliac (SI) joint is a common cause of chronic LBP.Citation6 The prevalence of SI joint pain has been reported to range between 15%–30% of patients with chronic LBP, recognizing that not all of these patients require surgery.Citation6,Citation7 Therefore, it is reasonable to expect that the disability burden associated with SI joint pain will parallel that of LBP. A study of treatment of spinal disorders among Medicare beneficiaries found that costs for epidural injections increased from $396.7 million in 2002 to $743.8 million in 2006, an increase of 121.1%.Citation8 Total Medicare costs for inpatient lumbar spinal surgery totaled more than $1 billion in 2003.Citation9
Determining that the SI joint is the pain generator is based on three or more positive provocation tests that indicate that the SI joint is the source of pain, followed by a confirmatory image-guided diagnostic injection of the SI joint; a 50% or greater reduction in pain immediately after the injection of a local anesthetic is used to confirm that the SI joint is the pain generator.Citation10,Citation11 The traditional SI joint pain treatment options have included either nonoperative care, such as physical therapy, epidural injections, SI joint injections, radiofrequency ablation, and pain medications, or traditional open SI joint arthrodesis surgery. Less invasive, nonoperative therapies often have limited benefit, as they only address the symptoms of the condition and do not treat the underlying cause. The only option for patients with SI joint pain that is refractory to nonoperative therapies has been open SI joint arthrodesis. This invasive, open surgery requires large incisions, bone harvesting, joint destabilization, and lengthy inpatient hospital stays. Moreover, patients may be required to abstain from weight bearing for several months.Citation12
To address the unmet need for improved surgical treatment of these patients, several minimally invasive surgery (MIS) arthrodesis systems have been developed to minimize tissue destruction, shorten the length of hospital stays, and facilitate faster recovery. Minimally invasive surgical procedures involve placing implants across the target SI joint in order to achieve arthrodesis through a permanent linkage across the joint. The clinical safety and effectiveness of MIS has been demonstrated based on a safety surveillance database of 5,319 patients treated with MIS over a 4-year period, a retrospective study of 50 patients at 40 months postimplant, and a retrospective study of 40 patients with 1-year follow-up.Citation13–Citation15 However, the economic implications of SI joint fusion with MIS have not been fully explored. This study evaluates the cost of SI joint fusion with MIS compared to nonoperative care in patients who suffer from LBP due to SI joint disruption and degenerative sacroiliitis in the hospital inpatient setting among the US Medicare population.
Methods
This research was performed according to guidelines Good Publication Practices (GPP2) established to minimize the conflict of interest when conducting pharmacoeconomic studies.Citation16,Citation17 A multispecialty panel comprised of clinicians and methodologists (the coauthors) provided the framework for the economic analysis, and the panel made all of the decisions regarding the data analysis and interpretation of the results.
An economic model was developed to simulate the lifetime cost savings (2012 US dollars [USD]) associated with treating Medicare patients with MIS SI joint fusion in the hospital inpatient setting compared to the cost of treating the same patients with nonoperative care. The savings in lifetime costs was estimated by subtracting the cost of treating Medicare patients with MIS SI joint fusion from the cost of nonoperative care. The economic model incorporated data from multiple sources, including published literature, Medicare claims data, and clinical expert judgment. The costs included in the analysis pertained to medical treatments, follow-up care, diagnostic tests, and retail pharmacy pain medication. A multispecialty clinical panel of six physicians (three orthopedic surgeons, one neurosurgeon, and two physiatrists) provided the clinical framework for the economic evaluation, and this panel made the final decisions on parameter values.
Assumptions
Several assumptions were made during the development of the economic model: 1) this analysis applies only to Medicare patients in the US who suffer from chronic LBP due to SI joint disruption and degenerative sacroiliitis, and who are eligible for MIS; 2) this analysis applies only to MIS patients treated in the hospital inpatient setting; 3) MIS patients who were classified as clinical failures underwent additional treatment, as described in , where MIS treatment failure was defined as having one or more of the following: implant failure, loosening, and/or malpositioning; failure to relieve pain requiring repeat intervention; and infection requiring reoperation; 4) MIS patients who were classified as clinical successes incurred minimal additional medical resources, such as a reduced class or a reduced dose of pain medications; 5) late complications of MIS, such as infection or loosening, requiring revision were reflected in the 1-year treatment failure rate for MIS; 6) the quality of life effects of MIS and nonoperative care have not been included in the present analysis; 7) the indirect costs associated with lost productivity and intangible costs of pain and suffering related to treatment morbidity have not been included in the present analysis; and 8) the analysis assumed that a single cohort of patients was followed over several years with no new patients entering the cohort in subsequent years.
Table 1 MIS values used in the economic model
Not all patients with SI joint pain and dysfunction necessarily have chronic pain and dysfunction, despite medical intervention. However, it remains unknown how many patients truly seek care, as little data exist on the effectiveness of nonoperative treatment. We assumed the percentage of SI joint disruption in patients who experience chronic pain despite medical treatment strategies is 75%, recognizing that progression is substantial. Further, all patients with SI joint pain and dysfunction are not necessarily surgical candidates for MIS. We have assumed that 90% of patients are eligible for MIS and the remaining 10% are too ill for general anesthesia.
Medical resource utilization and costs: nonoperative care
The costs associated with degenerative sacroiliitis/SI joint disruption patients managed with nonoperative care were estimated using the Medicare 5% Standard Analytic File (SAF) for the years ranging between 2005–2010.Citation18 Patients with a primary International Classification of Diseases, Ninth Revision, Clinical Modification (ICD-9-CM) diagnosis code for degenerative sacroiliitis/SI joint disruption (ICD-9-CM diagnosis codes 720.2, 724.6, 739.4, 846.9, or 847.3) with continuous enrollment for at least 1 year before and 5 years after diagnosis were included in the analysis. Spine-related health care claims attributable to degenerative sacroiliitis/SI joint disruption were identified using ICD-9-CM diagnosis codes (claims with a primary or secondary ICD-9-CM diagnosis code of 71x.xx, 72x.xx, 73x.xx, or 84x.xx), and the 5-year direct medical costs were totaled across practice settings, including hospital inpatient settings, hospital outpatient settings, physicians’ offices, and emergency departments. A subgroup analysis was performed among patients who underwent lumbar spinal fusion. Among Medicare patients with degenerative sacroiliitis or SI joint disruption (N=14,552), the mean 5-year direct medical costs attributable to degenerative sacroiliitis/SI joint disruption was $18,527 (standard deviation [SD] $28,285) per patient.Citation18 Among patients with lumbar spinal fusion (N=538 [3.7%]), the 5-year cost was $63,913 (SD $46,870) per patient. Among patients without lumbar spinal fusion (N=14,014 [96.3%]), the 5-year cost was $16,769 (SD $25,753) per patient. To estimate the total number of Medicare beneficiaries with degenerative sacroiliitis or SI joint disruption annually, the 14,552 patients identified from the Medicare 5% SAF is multiplied by 20, which yields an estimated 291,040 Medicare beneficiaries annually; this figure includes 10,760 patients who underwent a lumbar spinal fusion procedure.
While pain medications, such as nonsteroidal antiinflammatory drugs, are used by many patients treated with nonoperative care,Citation19,Citation20 pharmacy claims data are not available in the Medicare SAF. Therefore, outpatient pharmacy costs associated with pain medications were estimated among privately insured patients with degenerative sacroiliitis/SI joint disruption using Truven Health MarketScan® (Truven Health Analytics Inc., Ann Arbor, MI, USA) data from January 1, 2004 through December 31, 2010. MarketScan is a large, nationally representative longitudinal database of medical and pharmacy claims from over 150 million individuals. The population was identified using the same primary ICD-9-CM diagnosis codes that were used in the Medicare SAF analysis. Pain medication costs were estimated as the costs of pharmacy claims for the following drug categories: salicylate analgesics/antipyretics; antiinflammatory analgesics/antipyretics; opiate agonists; antidepressants; benzodiazepines; anxiolytics; sedatives; and hypnotics. Three years of pharmacy costs were estimated (due to data availability). The cumulative mean costs for outpatient pharmacy pain medications at 1 year, 2 years, and 3 years were $1,003, $1,809, and $2,567, respectively (2012 USD). Linear extrapolation was used to estimate pain medication costs over subsequent years.
Medical resource utilization and costs: minimally invasive surgery
Parameter estimates for MIS were derived from the published literature, Medicare claims data, and the expert clinical opinion of the multispecialty clinical panel, and are further described in . In a retrospective studyCitation14 of 50 consecutive patients treated with a MIS device (iFuse Implant System®; SI-BONE, Inc.),Citation21 early and sustained clinically significant improvements were reported in seven out of nine quality of life domains, with 82% of patients reaching minimal clinically important difference (MCID) (>2 point change)Citation22 at 40 months postimplant.Citation11 In another retrospective study of 40 consecutive patients treated with the same device,Citation15 a clinically significant improvement (>2 point change from baseline) was observed in all but one patient at 1-year follow-up. Therefore, the MIS 1-year treatment success rate was assumed to be 82% in the economic model.
Complications were reported among 3.8% of 5,319 patients treated with the new MIS system (iFuse Implant System) over a 4-year period (204 of 5,319 patients),Citation13 which included clinical, device-related, and procedure-related events. Clinical events included pain due to nerve impingement, recurrent SI joint pain, hematoma/excessive bleeding, iliac fracture, superficial wound infection, deep venous thrombosis, and deep wound infection. Device-related events included pin bending/breakage and device migration, whereas procedure-related events included improper device placement or improper device size. MIS revisions were performed in 1.8% of patients (n=96) at a median follow-up of 4 months, and were typically performed in the early postoperative period for the treatment of symptomatic malpositioned implants (n=46), or in the late postoperative period due to symptom recurrence (n=34).Citation13 Therefore, based on Miller et al,Citation13 complications were assumed to occur in 3.8% of patients undergoing SI joint fusion with MIS, and revisions were assumed to occur in 1.8% of patients in the economic model.
SI joint fusion with MIS is currently predominantly performed as a hospital inpatient procedure. The reason why this procedure is conducted in this manner is that it offers postoperative pain control, it helps to ensure avoidance of urinary retention, it allows provision of physical therapy education on toe touch weight bearing, and ensures safety in ambulation. The cost of MIS hospitalization was based on the national average adjusted DRG payments of $46,700 for DRG 459 (spinal fusion except cervical with major complication or comorbidity) and $27,800 for DRG 460 (spinal fusion except cervical without major complication or comorbidity). A weighted cost was calculated using the percentage of patients (3.8%) with clinical, device-related, or procedure-related events based on 5,319 patients treated with MIS fusion (iFuse Implant System).Citation13 The MIS device cost is bundled into the DRG payment.
The costs associated with major adverse events that occur during the MIS hospitalization (such as implant malpositioning requiring revision, as well as medical complications including hematoma and deep vein thrombosis) are reflected in the Medicare payment for DRG 459 (with major complications). The professional fee of $1,033.38 for the MIS procedure was based on the 2012 payment for Current Procedural Terminology (CPT) code 27280 (arthrodesis, SI joint [including obtaining graft]).Citation23 The Medicare policy has designated CPT code 27280 as an “inpatient only” service.Citation22,Citation24
Medical resource use for MIS SI joint fusion follow-up care (including pain medications) was determined by three surgeons (DWP, TH, and JC) based on their experience treating over 360 patients with MIS (). It was assumed that two of the office visits in year 1 would fall under the postsurgical global period and would not incur additional costs, per CMS regulations and guidance.Citation25,Citation26 CPT codes and reimbursement amounts from standard physician fee schedulesCitation23 were used to enumerate costs for professional services for MIS patients (). Retail pharmacy pain medication costs for MIS patients were enumerated using the Thomson Reuters Redbook Online ().Citation27
Table 2 MIS costs used in the economic model (2012 US dollars)
Extrapolation
The 5-year costs for nonoperative care and MIS were extrapolated to an overall lifetime cost impact to the Medicare population. For this extrapolation, it was assumed that Medicare patients are 70 years old in year 1 (the mean age of the Medicare SAF sample), and that patients have a life expectancy of 84 years (the sex-weighted average life expectancy of Americans who reach the age of 65 years, per the Social Security Administration);Citation28 as such, cost savings after year 5 are extrapolated over an additional 10 years. The costs in each of the additional years beyond 5 years were estimated by adding the treatment-specific average annual difference over the first 5 years to the cost totals at the end of year 5. The net present value was discounted at 3% per annum, based on the standards used in economic analyses and the approach employed by the Congressional Budget Office.Citation29
Because there is significant overlap of SI joint pathology and LBP requiring spinal fusion, a subgroup analysis was performed on degenerative sacroiliitis/SI joint disruption patients who underwent lumbar spinal fusion. It is unclear how often lumbar fusion is performed on patients who truly have SI pathology; however, Sembrano and PollyCitation6 previously suggested at least 5% of the time. In a recent study of the Medicare population of the 538 patients in a lumbar spinal fusion subgroup, 7% underwent lumbar spinal fusion within 1 year prior to receiving a diagnosis of SI joint disruption and/or degenerative sacroiliitis,Citation18 which may represent patients with concomitant disease, new SI joint disease, or misdiagnosis. In addition, lumbar spinal fusion patients with SI diagnoses represent a group requiring greater medical resource utilization for treatment than patients with the same diagnosis, but who have not had lumbar spinal fusion.Citation18
Sensitivity analysis
Sensitivity analyses were performed to determine the consequences of making alternative assumptions for the following model parameter inputs: the durability of the MIS treatment success rate; the percentage of MIS index hospitalizations that fall under DRG 459 (with major complications); the distribution of subsequent treatments for MIS failures; the exclusion of retail pharmacy costs for pain medications; the inclusion of ICD-9-CM code 721.3 (lumbosacral spondylosis); and the discount rate for extrapolation. Of note, for the base case analysis, we adjusted the Medicare population size to reflect patients who suffer from chronic LBP due to SI joint disruption and degenerative sacroiliitis who are eligible for MIS. As such, sensitivity analyses were also performed for the percent of patients with chronic pain and the percent of patients who are eligible for MIS surgery. The generalizability of the results was assessed by varying the parameters over plausible ranges.
Results
The extrapolated lifetime cost of treating Medicare patients with MIS fusion in the inpatient setting was $48,185 per patient compared to the cost of treating them with nonoperative care of $51,543 per patient, resulting in a savings of $660 million to the Medicare program ($3,358 in savings per patient for 196,452 patients) due to reductions in spine-related health care costs over Medicare patients’ lifetimes (). This occurs because direct medical costs of nonoperative care accumulate steadily over the patients’ lifetimes, as opposed to the costs associated with MIS, which are higher in the first year. The per patient cost differential for MIS compared to nonoperative care was similar for the overall group ($3,358) and for patients without lumbar spinal fusion ($1,033). Per patient cost differential for patients with lumbar spinal fusion was much higher ($63,705). Of note, patients managed with lumbar spinal fusion surgery (3.7% of patients) represent a disproportionate share of the cost savings in that approximately 70% of the potential cost savings ($463 million) would be realized from this subgroup, whereas the remaining 30% of the potential cost savings (about $195 million) would be realized from the 96% of patients without lumbar spinal fusion.
Table 3 Extrapolated Medicare population lifetime results from the economic model, excluding ICD-9-CM diagnosis code 721.3 (2012 US dollars)
Sensitivity analyses
Sensitivity analyses were used to test the robustness of the results and to determine which variables have a substantial effect on the results. The results generated by the economic model are generally considered robust because the costs fall within a narrow range () when key model assumptions and parameters are varied. As anticipated, the results were most sensitive to the MIS treatment success rate, followed by the exclusion of retail pharmacy costs for pain medications, and the inclusion of the ICD-9-CM code 721.3 ( and ).
Figure 1 Sensitivity analysis of lifetime cost differentials between nonoperative care and MIS (2012 US dollars).
Abbreviations: MIS, minimally invasive surgery; DRG, diagnosis-related group; ICD-9-CM, International Classification of Diseases, Ninth Revision, Clinical Modification.
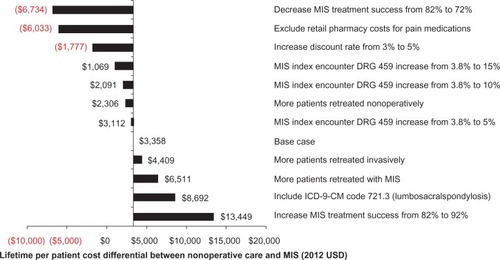
Table 4 Sensitivity analysis for MIS compared with nonoperative care (2012 US dollars), lifetime results excluding ICD-9-CM diagnosis code 721.3Table Footnotea
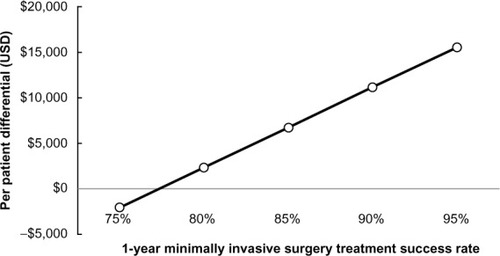
In the current study, the 1-year MIS treatment success rate of 82% was estimated from two studies based on the best evidence currently available: one retrospective study of 50 consecutive patients treated with MIS;Citation14 and a second retrospective study of 40 consecutive patients.Citation15 To address uncertainty in the durability of MIS, a sensitivity analysis was performed by varying the MIS treatment success rate from 72% to 92% to evaluate model robustness. Overall, cost-neutrality was achieved at a 1-year MIS treatment success rate of approximately 78.7%; lower values result in MIS being cost-additive over a patient’s lifetime, whereas higher values result in cost savings ().
Figure 2 Lifetime cost differentials by minimally invasive surgery treatment success rate (2012 USD).
Abbreviations: USD, US dollars; MIS, minimally invasive surgery.
In the base case, ICD-9-CM code 721.3 was not included; ICD-9-CM code 721.3 is described as “lumbosacral spondylosis without myelopathy: Lumbar or lumbosacral; Arthritis; Osteoarthritis; Spondylarthritis.” Given that ICD-9-CM code 721.3 may also include patients with SI joint disruption and degeneration, we conducted a sensitivity analysis to estimate the costs to Medicare when it was included. With the inclusion of ICD-9-CM code 721.3, 35,464 patients were identified in the Medicare 5% SAF analysis between 2005 and 2010, resulting in up to 478,764 Medicare beneficiaries with degenerative sacroiliitis or SI joint disruption annually. When ICD-9-CM code 721.3 is included, overall estimated lifetime per-patient costs for patients treated with nonoperative care were $60,867 compared to $52,175 for patients treated with MIS; therefore, the per patient cost differential of treatment with MIS instead of nonoperative care is estimated to be $8,692 (). When ICD-9-CM code 721.3 was included in the analysis, the potential lifetime cost savings to the Medicare program by treating this entire population with MIS increases up to $4.16 billion (478,764 beneficiaries at $8,692 in savings per patient). For patients who underwent lumbar spinal fusion surgery (5.4% of the population with the inclusion of ICD-9-CM code 721.3), lifetime costs for nonoperative care were estimated at $142,994 per patient compared to $87,503 for MIS; the cost differential of $55,491 per patient would result in an estimated savings to Medicare of up to $1.4 billion over patients’ lifetimes. The lifetime cost savings for patients without lumbar spinal fusion were estimated at up to $2.7 billion with the inclusion of ICD-9-CM code 721.3.
Table 5 Extrapolated Medicare population lifetime results from the economic model, including ICD-9-CM diagnosis code 721.3 (2012 US dollars)
Due to the absence of retail pharmacy data in the Medicare SAF, commercial pharmacy data were used in this analysis. To address this limitation, a sensitivity analysis was performed by excluding retail pharmacy costs for pain medications (from both the MIS and nonoperative care groups). As expected, because pain medications represent a standard treatment option for nonoperative care, when retail pharmacy costs were excluded from the analysis, MIS became cost-additive overall and in patients without lumbar spinal fusion ().
The economic analysis was less sensitive to assumptions about the distribution of subsequent treatments for MIS failures, the percentage of MIS index hospitalizations that fall under DRG 459 (with major complications), and the discount rate ( and ). Cost savings to the Medicare program over patients’ lifetimes () were adjusted by varying the percentage of SI joint disruption patients with chronic pain (from 25% to 100%) and the percentage of patients eligible for MIS SI joint fusion (from 25% to 100%).
Discussion
This study demonstrates that projected lifetime costs associated with nonoperative care were higher than with MIS in the Medicare population, presuming a 1-year treatment success rate of at least 78.7% for MIS SI joint fusion. The $660 million potential savings to the Medicare program associated with the use of MIS instead of nonoperative care would occur because direct medical costs of nonoperative care accumulate steadily over the patients’ lifetimes, as opposed to the costs associated with MIS, which are higher in the first year.
It is helpful to consider the costs associated with new spinal technologies like MIS in light of other common orthopedic technologies. As a point of reference, the estimated cost savings of the MIS procedure compares favorably with that of other common orthopedic procedures. For instance, MIS device placement performed in the hospital inpatient setting compared with nonoperative care (per patient differential cost of $3,358, favoring MIS over a patient’s lifetime) creates cost savings far greater than artificial cervical disc replacement versus anterior cervical fusion surgery for the treatment of single-level radiculopathy or myelopathy (per patient differential cost of $255 [2012 USD] favoring artificial disc from a hospital perspective).Citation24 Furthermore, MIS device placement performed in the hospital inpatient setting is cost-saving relative to nonoperative care among the subgroup of patients who have undergone lumbar spinal fusion (per patient differential of $63,705 favoring MIS over a patient’s lifetime), and it is substantially more cost-saving than bone morphogenetic protein (BMP) versus autogenous iliac crest bone graft in single-level anterior lumbar fusion for treatment of degenerative disk disease (per patient differential cost of $14 [2012 USD] favoring BMP over a 2-year period).Citation30 Current evidence suggests that when BMP results in a higher fusion rate, it is cost-saving.Citation30 These findings broadly suggest that, from an economic perspective, MIS is a reasonable treatment alternative along the continuum of care between continued nonoperative care and open arthodesis surgery.
SI joint pain treatment options include either nonoperative care or SI joint fusion surgery. When nonoperative treatment fails, patients are either left to suffer, or they may be offered SI joint fusion. Traditionally, open SI joint arthrodesis was the only SI joint fusion surgery option, but recently SI joint fusion has been performed with a MIS technique. A recent study explored the prevalence of SI joint fusion and the frequency with which it is being performed using a MIS technique in the US.Citation31 The total number of estimated SI joint fusion procedures (all payers) increased from 189 in 2001 to 3,900 in 2012. MIS SI joint fusions accounted for an increasing percentage of the total, ranging from 0% in 2008 to 76% in 2011, with an estimate of 85% for 2012. MIS SI joint fusion has been broadly adopted in the US and is a viable treatment alternative for patients who have failed nonoperative treatment. Presumably, this is due to improvements in diagnosis, as well as improvements of the risk–benefit ratio with the use of MIS.
Limitations
Several limitations warrant discussion. First, the MIS treatment success rate of 82% at 1 year is based on two studies – a retrospective study of 50 consecutive patients treated with a specific MIS system,Citation14 and a second retrospective study of 40 consecutive patients.Citation15 Despite the small sample size, clinically and statistically significant improvements were reported by RudolfCitation14 in seven out of nine quality of life domains, with 82% of patients reaching the MCID (>2-point change in pain score) at 40 months postimplant. Similarly, in a recent retrospective study with the same MIS system, Sachs and CapobiancoCitation15 reported a clinically significant improvement (>2-point change from baseline) in 39 out of 40 patients at 1-year follow-up. The rate of perioperative complications (20%) reported by RudolfCitation14 was similar to other reports in the literature; half of these events were minor (mild hematoma at the incision site and superficial cellulitis), requiring little to no intervention, whereas the remaining five patients experienced major events. Specifically, three patients were brought back to the operating room for retraction of a misplaced implant (likely due to the learning curve early on during experience), one patient experienced a deep soft tissue wound infection that resolved after 6 weeks of intravenous antibiotics, and the final patient had a nondisplaced fracture that healed without intervention. Beyond the perioperative complications reported by Rudolf,Citation14 only one additional complication occurred in months 13–40 (implant loosening), which resulted in the placement of two additional implants. The revision rate in the 50-patient cohort was 8% after 3 years,Citation14 which compares favorably to that reported in the literature for other types of MIS approaches (8%–15%).Citation32–Citation37
More recently, a complication rate of 3.8% (204 of 5,319 patients) has been reported for a new MIS system over a 4-year period.Citation13 Revision surgeries were performed in 1.8% of patients (n=94) at a median follow-up of 4 months; early revisions primarily for symptomatic malposition were performed at a median of 19 days postoperatively, whereas late revisions primarily for symptom recurrence or continued pain of undetermined etiology were performed at a median of 279 days postoperatively.Citation13 These more recent findings from Miller et alCitation13 and Sachs and CapobiancoCitation15 further suggest that the 1-year MIS treatment success rate of 82% is a reasonable base case value for the economic model (where treatment failure has been defined as having one or more of the following: implant failure, loosening, and/or malposition; failure to relieve pain requiring repeat intervention; and infection requiring reoperations). Nevertheless, because long-term durability data for MIS are limited to up to 4 years, we can only estimate the lasting effects of MIS treatment on symptoms of SI joint disruption/degeneration.Citation14,Citation15 Nonetheless, based on clinical experience to date, MIS failures have occurred within the first 12 months, which has been reflected in the 18% MIS treatment failure rate incorporated into the economic model. In light of the small sample sizes in the RudolfCitation14 and Sachs and CapobiancoCitation15 studies (50 and 40 patients, respectively), and given the question surrounding longer-term durability of MIS, a sensitivity analysis was performed by varying the 1-year MIS treatment success rate from 72% to 92%, which resulted in cost neutrality at a ~79% success rate at 1 year (). Of note, the MIS treatment success rate where cost neutrality is achieved is dependent on the Medicare reimbursement for the MIS procedure (that is, DRG payments for DRGs 459 and 460); for instance, if the DRG payment were to increase, then the MIS treatment success rate where cost neutrality is achieved would also increase.
Second, because the Medicare SAF does not include pharmacy data, the economic model estimated retail pharmacy pain medication costs for nonoperative care using data from younger, privately insured patients, which is notably imperfect. To address this limitation, we performed a sensitivity analysis by excluding retail pharmacy costs. While the exclusion of all retail pharmacy pain medication use is not realistic clinically, the results do provide insights into the economic burden of retail pharmacy pain medications as a component of nonoperative care in patients with degenerative sacroiliitis and SI joint disruption.
Third, the percentage of MIS index hospitalizations that fall under DRG 459 (with major complications) was based on complaint reporting under a US Food and Drug Administration-mandated postmarket product surveillance program,Citation13 which may have underestimated the true incidence of events. As such, it is possible that the true rate of complications is higher than the 3.8% reported by Miller et al.Citation13 Nevertheless, an analysis of DRG 459 (with major complications) and DRG 460 (without major complications) using the Medicare Provider Analysis and Review (MedPAR) 2011 data (a Medicare database reflecting 100% of hospital inpatient stays for Medicare beneficiaries) estimated the percent of patients with DRG 459 at 5% and DRG 460 at 95%. These DRGs include lumbar spinal fusion in addition to MIS SI joint fusion. To address this limitation, a sensitivity analysis was conducted by increasing the complication rate from 3.8% to 15%.
Among Medicare patients with degenerative sacroiliitis or SI joint disruption, 3.7% underwent lumbar spinal fusion 1 year prior to or 5 years following diagnosis.Citation18 Other investigators have reported that between 18% and 48% of their patients treated with MIS SI joint fusion underwent lumbar spinal fusion,Citation14,Citation15 which suggests that the 6-year window may not have been long enough to fully capture those patients who previously or subsequently underwent lumbar spinal fusion. As the percentage of patients who underwent lumbar spinal fusion increases, the overall per-patient cost differential (cost of nonoperative care – cost of MIS) also increases.
As noted earlier, the health-related quality of life (HRQoL) effects of MIS and nonoperative care were not included in the present analysis. Nonetheless, among MIS patients, RudolfCitation14 reported early and sustained clinical improvement through 12 months of follow-up among multiple HRQoL domains, including pain, activities (light, moderate, and vigorous), sleep, overall happiness, and pain effects on social interest. On the other hand, nonoperative care often requires continued therapy over time,Citation18 which suggests that MIS may lower lifetime costs and result in greater improvement in HRQoL, as compared to nonoperative care.
Of note, we explored multiple public and private databases to identify Medicare beneficiaries who underwent the MIS procedure in the hospital inpatient setting; however, these databases did not contain sufficient sample sizes (due to the lack of available reimbursement codes to uniquely identify MIS patients in the datasets and/or due to the limited availability of more recent data). Therefore, the cost of MIS hospitalization was based on the estimated national average DRG payments for DRG 459 and DRG 460, and the professional fee for the procedure was based on the 2012 Medicare Payment for CPT 27280. The follow-up medical resources and costs for MIS were based on inputs from three surgeons (DWP, TH, and JC, who have collectively treated over 360 patients using MIS) and standard Medicare fee schedules. Where differences in clinical practice management were identified, the more conservative values (ie, higher costs) were used in the economic model in order to minimize any potential cost savings associated with use of MIS. Additional research should include prospective multicenter studies, medical chart reviews, or analysis of health insurance claims made by MIS patients. Two trials have been initiated to further characterize the safety and effectiveness of MIS SI joint fusion: a large single arm trial (SIFI: NCT01640353)Citation38 and a randomized controlled trial (INSITE: NCT01681004).Citation39 Since it will be several years before those trials are complete, the values used in the economic model were based on the best evidence that is currently available. As more robust evidence emerges, the economic model will be updated accordingly.
Conclusion
Recent US health care reform legislation focuses on improving quality of care and reducing costs. The economic burden of SI joint disruption and degenerative sacroiliitis among Medicare beneficiaries in the US is substantial and highlights the need for new MIS therapies to treat this condition and to reduce health care expenditures. In patients who suffer from LBP due to SI joint disruption or degenerative sacroiliitis, this economic analysis suggests that MIS SI joint fusion performed in the hospital inpatient setting could result in a cost savings to the Medicare program of $660 million over Medicare patients’ lifetimes by treating this population with MIS fusion.
Acknowledgments
We thank Karen Spach, PhD, of Covance Market Access Services Inc., for her editorial contribution to this manuscript.
Disclosure
This study was sponsored by SI-BONE, Inc. (San Jose, CA, USA). SI-BONE did not participate in the data analysis, interpretation of the results, or writing of the manuscript. SI-BONE was provided a final version of the manuscript for informational purposes only. It did not influence the content or writing of the manuscript. SJA, KS, and TK are consultants to SI-BONE through their employment at Covance. DWP has not received any financial support from SI-BONE. DWP receives research support from the Department of Defense, Orthopaedic Research and Education Foundation, Minnesota Medical Foundation, and Chest Wall and Spine Deformity Foundation. TH and JC are paid teaching and clinical research consultants for SI-BONE. Portions of this work have been presented as an abstract to the 8th Interdisciplinary World Congress on Low Back and Pelvic Pain, and have been accepted to the Society for Minimally Invasive Spine Surgery 2013.
The authors report no other conflicts of interest in this work.
References
- WekslerNVelanGJSemionovMThe role of sacroiliac joint dysfunction in the genesis of low back pain: the obvious is not always rightArch Orthop Trauma Surg20071271088588817828413
- FreburgerJKHolmesGMAgansRPThe rising prevalence of chronic low back painArch Intern Med2009169325125819204216
- WeinerDKKimYSBoninoPWangTLow back pain in older adults: are we utilizing healthcare resources wisely?Pain Med20067214315016634727
- KatzJNLumbar disc disorders and low-back pain: socioeconomic factors and consequencesJ Bone Joint Surg Am200688Suppl 2212416595438
- MurrayWSacroiliac joint dysfunction: a case studyOrthop Nurs2011302126131 quiz 13221422895
- SembranoJNPollyDWHow often is low back pain not coming from the back?Spine (Phila Pa 1976)2009341E27E3219127145
- SchwarzerACAprillCNBogdukNThe sacroiliac joint in chronic low back painSpine (Phila Pa 1976)199520131377709277
- ManchikantiLPampatiVBoswellMVSmithHSHirschJAAnalysis of the growth of epidural injections and costs in the Medicare population: a comparative evaluation of 1997, 2002, and 2006 dataPain Physician201013319921220495584
- WeinsteinJNLurieJDOlsonPRBronnerKKFisherESUnited States’ trends and regional variations in lumbar spine surgery: 1992–2003Spine (Phila Pa 1976)200631232707271417077740
- LaslettMYoungSBAprillCNMcDonaldBDiagnosing painful sacroiliac joints: A validity study of a McKenzie evaluation and sacroiliac provocation testsAust J Physiother2003492899712775204
- SzadekKMvan der WurffPvan TulderMWZuurmondWWPerezRSDiagnostic validity of criteria for sacroiliac joint pain: a systematic reviewJ Pain200910435436819101212
- GiannikasKAKhanAMKarskiMTMaxwellHASacroiliac joint fusion for chronic pain: a simple technique avoiding the use of metalworkEur Spine J200413325325614648303
- MillerLERecklingWCBlockJEAnalysis of postmarket complaints database for the iFuse SI Joint Fusion System®: a minimally invasive treatment for degenerative sacroiliitis and sacroiliac joint disruptionMed Devices (Auckl)20136778423761982
- RudolfLSacroiliac joint arthrodesis-MIS technique with titanium implants: report of the first 50 patients and outcomesOpen Orthop J2012649550223284593
- SachsDCapobiancoRMinimally invasive sacroiliac joint fusion: one-year outcomes in 40 patientsAdv Orthop2013201353612823997957
- GrafCBattistiWPBridgesDInternational Society for Medical Publication ProfessionalsResearch methods and reporting. Good publication practice for communicating company sponsored medical research: the GPP2 guidelinesBMJ2009339b433019946142
- SchulmanKARubensteinLEGlickHAEisenbergJMRelationships between sponsors and investigators in pharmacoeconomic and clinical researchPharmacoeconomics19957320622010155310
- AckermanSJPollyDWKnightTHoltTCummingsJNon-operative care to manage sacroiliac joint disruption and degenerative sacroiliitis is costly and requires high medical resource utilization in the Medicare populationJournal of Neurosurgery: Spine2013In press
- CohenSPChenYNeufeldNJSacroiliac joint pain: a comprehensive review of epidemiology, diagnosis and treatmentExpert Rev Neurother20131319911623253394
- PoleyREBorchersJRSacroiliac joint dysfunction: evaluation and treatmentPhys Sportsmed2008361424920048471
- US Food Drug AdministrationSI-Bone’s iFuse SI Fusion System 501(k) Summary LetterSilver Spring, MDUS Food and Drug Administration2011 Available from: http://www.accessdata.fda.gov/cdrh_docs/pdf11/K110838.pdfAccessed September 13, 2012
- CopayAGGlassmanSDSubachBRBervenSSchulerTCCarreonLYMinimum clinically important difference in lumbar spine surgery patients: a choice of methods using the Oswestry Disability Index, Medical Outcomes Study questionnaire Short Form 36, and pain scalesSpine J20088696897418201937
- Centers for Medicare and Medicaid Services [webpage on the Internet]National physician fee schedule relative value file July releaseBaltimore, MDCenters for Medicare and Medicaid Services2012 Available from: http://www.cms.gov/Medicare/Medicare-Fee-for-Service-Payment/PhysicianFeeSched/PFS-Relative-Value-Files-Items/RVU12C.htmlAccessed September 11, 2012
- AndersonPTraynelisVAckermanSRossDEconomic analysis of artificial cervical disc replacement versus anterior cervical fusion surgery in the non-elderly: impact on hospital and societal costsPresented at: Cervical Spine Research Society (CSRS) 2006 CSRS European Section Annual MeetingMay 17–20, 2006Berlin, Germany
- Department of Health and Human ServicesGlobal Surgery Fact SheetBaltimore, MDCenters for Medicare and Medicaid2012 Available from: http://www.cms.gov/Outreach-and-Education/Medicare-Learning-Network-MLN/MLNProducts/downloads/GloballSurgery-ICN907166.pdfAccessed February 12, 2013
- Centers for Medicare and MedicaidMedicare Claims Processing ManualBaltimore, MDCenters for Medicare and Medicaid2012 Available from: http://www.cms.gov/Regulations-and-Guidance/Guidance/Manuals/downloads/clm104c12.pdfAccessed February 12, 2013
- Thomson Reuters Micromedex Clinical Evidence Solutions [Internet]Thomson Reuters; c2013. RED BOOK Drug References; c2013 [cited 2013 Jul 8]. Available from: http://thomsonreuters.com/products_services/healthcare/healthcare_products/clinical_deci_support/micromedex_clinical_evidence_sols/med_safety_solutions/red_book/Accessed February 12, 2013
- USA Social Security Administration [webpage on the Internet]Calculators: life expectancyWoodlawn, MDUSA Social Security Administration2012 Available from: http://www.ssa.gov/planners/lifeexpectancy.htmAccessed December 18, 2012
- Congressional Budget OfficeCBO’s 2011 Long-Term Projections for Social Security: Additional InformationWashington, DCCongressional Budget Office2011 Available from: http://digitalcommons.ilr.cornell.edu/cgi/viewcontent.cgi?article=1841&context=key_workplace&sei-redir=1&referer=http%3A%2F%2Fwww.google.com%25Accessed September 13, 2013
- PollyDWAckermanSJShaffreyCIA cost analysis of bone morphogenetic protein versus autogenous iliac crest bone graft in single-level anterior lumbar fusionOrthopedics200326101027103714577525
- AckermanSJPollyDWYerbySKimEKnightTWhat is the frequency of minimally invasive sacroiliac joint fusion annually in the United States?Paper presented at: 8th Interdisciplinary World Congress on Low Back and Pelvic PainOctober 27–31, 2013Dubai, United Arab Emirates
- KibsgårdTJRøiseOSudmannEStugeBPelvic joint fusions in patients with chronic pelvic girdle pain: a 23-year follow-upEur Spine J201322487187723001416
- Al-KhayerAHegartyJHahnDGrevittMPPercutaneous sacroiliac joint arthrodesis: a novel techniqueJ Spinal Disord Tech200821535936318600147
- WiseCLDallBEMinimally invasive sacroiliac arthrodesis: outcomes of a new techniqueJ Spinal Disord Tech200821857958419057252
- BuchowskiJMKebaishKMSinkovVCohenDBSieberANKostuikJPFunctional and radiographic outcome of sacroiliac arthrodesis for the disorders of the sacroiliac jointSpine J200555520528 discussion 52916153580
- MooreJDJrUnder new authority. KU Hospital joins movement toward independenceMod Healthc19972774448
- WaisbrodHKrainickJUGerbershagenHUSacroiliac joint arthrodesis for chronic lower back painArch Orthop Trauma Surg198710642382402956935
- SI-BONE, IncSacroiliac Joint Fusion With iFuse Implant System (SIFI) Available from: http://clinicaltrials.gov/show/NCT01640353. Identifier: NCT01640353Accessed October 14, 2013
- SI-BONE, IncInvestigation of Sacroiliac Fusion Treatment (INSITE) Available from: http://clinicaltrials.gov/show/NCT01681004. Identifier: NCT01681004Accessed October 14, 2013