
Abstract
Introduction
Low back pain is common and treatment costly with substantial lost productivity and lost wages in the working-age population. Chronic low back pain originating in the sacroiliac (SI) joint (15%–30% of cases) is commonly treated with nonoperative care, but new minimally invasive surgery (MIS) options are also effective in treating SI joint disruption. We assessed whether the higher initial MIS SI joint fusion procedure costs were offset by decreased nonoperative care costs from a US commercial payer perspective.
Methods
An economic model compared the costs of treating SI joint disruption with either MIS SI joint fusion or continued nonoperative care. Nonoperative care costs (diagnostic testing, treatment, follow-up, and retail pharmacy pain medication) were from a retrospective study of Truven Health MarketScan® data. MIS fusion costs were based on the Premier’s Perspective™ Comparative Database and professional fees on 2012 Medicare payment for Current Procedural Terminology code 27280.
Results
The cumulative 3-year (base-case analysis) and 5-year (sensitivity analysis) differentials in commercial insurance payments (cost of nonoperative care minus cost of MIS) were $14,545 and $6,137 per patient, respectively (2012 US dollars). Cost neutrality was achieved at 6 years; MIS costs accrued largely in year 1 whereas nonoperative care costs accrued over time with 92% of up front MIS procedure costs offset by year 5. For patients with lumbar spinal fusion, cost neutrality was achieved in year 1.
Conclusion
Cost offsets from new interventions for chronic conditions such as MIS SI joint fusion accrue over time. Higher initial procedure costs for MIS were largely offset by decreased nonoperative care costs over a 5-year time horizon. Optimizing effective resource use in both nonoperative and operative patients will facilitate cost-effective health care delivery. The impact of SI joint disruption on direct and indirect costs to commercial insurers, health plan beneficiaries, and employers warrants further consideration.
Introduction
Low back pain (LBP) is a common condition, with 28.1% of adults in the US reporting to have experienced LBP within the previous 3 months.Citation1 The prevalence of chronic LBP has increased from 3.9% in 1992 to 10.2% in 2006.Citation2 National estimates of direct costs for chronic LBP in the US have been between $12.2 billion and $90.6 billion based on a systematic review.Citation3 Back pain treatment was the eighth most expensive medical condition in a national analysis of US private health insurance spending.Citation4 The total economic burden, including lost productivity and decreased wages, associated with LBP in the US ranges between an estimated $60 billion and $200 billion annually.Citation5,Citation6 Of adults in the US labor force, 70.2% receive employer-based health insurance.Citation7 As such, both private health insurers and employers have a vested interest in maintaining a healthy and productive workforce.Citation8
Chronic LPB is commonly caused by the sacroiliac (SI) joint.Citation9 The prevalence of SI joint pain among patients with chronic LBP is estimated to range from 15% to 30%, although not all of these patients with SI joint pain require surgery.Citation9,Citation10 The prevalence of an International Classification of Diseases, Ninth Revision, Clinical Modification (ICD-9-CM) diagnosis of SI joint disruption and/or degenerative sacroiliitis has been reported as 0.9% among privately insured individuals in the US.Citation11 To diagnose the SI joint as the pain generator, three or more positive provocation tests are required, followed by an image-guided diagnostic injection confirming the SI joint as the source of pain; also, an immediate pain reduction of 50% or greater after a local anesthetic injection is required to confirm that the pain is generated from the SI joint.Citation12,Citation13 SI joint pain has traditionally been treated with either nonoperative care or open SI joint arthrodesis surgery. Methods of nonoperative care include epidural injections, physical therapy, pain medications, radiofrequency ablation, and pain medications. Despite the fact that these nonoperative therapies are less invasive, they are of limited benefit because they do not address the fundamental cause of the pain but rather only relieve the symptoms of SI joint pain. Despite these limitations, nonoperative care such as epidural steroid injections, as well as facet joint and sacroiliac joint interventions, increased an average of 16.5% annually from 2000 to 2008.Citation14 When SI joint pain is unmanageable with nonoperative therapies, open SI joint arthrodesis has been the only alternative. Unfortunately, open SI joint surgery is invasive, requiring bone harvesting and large incisions, and necessitates hospital stays and lengthy periods of non-weight bearing.Citation15–Citation17
To address the need for additional treatment options for patients with SI joint pain, several minimally invasive surgery (MIS) arthrodesis systems have been developed. Minimally invasive surgical procedures achieve permanent linkage by inserting implants to stabilize the SI joint affected by SI joint disruption and/or degenerative sacroiliitis. MIS systems involve a smaller incision size and do not require bone grafting, which in turn curtails hospital length of stay and recovery time. Recent studies of MIS have demonstrated their clinical safety and effectiveness, including 4-year safety surveillance from a database of 5,319 MIS-treated patients and two retrospective studies of 12- and 40-month follow-up, respectively.Citation19–Citation21 Despite the advent of new MIS technologies and techniques, the economic implications of new MIS SI joint treatments have not yet been explored from a US private health insurance perspective. This economic model evaluates the cost to the US commercial payer of MIS SI joint fusion compared to continued nonoperative care in patients with chronic LBP caused by SI joint disruption and degenerative sacroiliitis. We assessed whether and over what period of time the higher initial MIS SI joint fusion procedure costs were offset by decreased nonoperative care costs.
Methods
This research was performed according to guidelines (GPP2) established to minimize conflict of interest in pharmacoeconomic studies.Citation22,Citation23 The coauthors of the present study (clinicians and methodologists) formed a multidisciplinary panel that provided the framework for the economic analysis and made all decisions about the model inputs, assumptions, analyses, and interpretation of the results.
The economic model was used previously to compare the costs of MIS SI joint fusion to nonoperative care for the treatment of SI joint disruption in the hospital inpatient setting among the US Medicare population (beneficiaries 65 years of age and older). The methods described below are similar to those in the previously published model.Citation24 The methods are repeated herein, with relevant adaptations for the US commercial payer population. The economic model estimated the cost differential (2012 US dollars [USD]) associated with treating commercially insured patients with MIS SI joint fusion in the hospital inpatient and hospital outpatient settings compared to the cost of nonoperative care in the same patients. The cost differential to the commercial insurer (that is, difference in total insurance payments) was estimated by subtracting the cost of treating patients with MIS SI joint fusion from the cost of nonoperative care among commercial insurance beneficiaries. Data from multiple sources were incorporated in the economic model. These sources include Truven Health MarketScan® (Truven Health Analytics Inc., Ann Arbor, MI, USA) data, Premier’s Perspective™ Comparative Database (Charlotte, NC, USA) data, the published literature, and clinical expert judgment. The costs included in the analysis were medical treatments, follow-up care, diagnostic tests, and retail pharmacy pain medication. The base-case analysis simulated the cost differential over a period of 3 years. This time period was selected based on the International Society for Pharmacoeconomics and Outcomes Research (ISPOR) Task Force recommendation of a 1- to 5-year time horizon for budget impact analyses for the United States.Citation25 Furthermore, a 3-year time horizon was selected to correspond with the available 3-year Truven Health commercial payer data to avoid extrapolation assumptions in the base-case analysis. Outcomes were discounted at 3.0% per annum and are reported in 2012 USD.
Assumptions
As previously noted, the assumptions described below are similar to those in the previously published economic model among the US Medicare population.Citation24 The primary assumptions are repeated herein, with relevant adaptations for the US commercial payer population: 1) the base-case analysis applies only to commercially insured patients in the US who suffer from chronic LBP due to SI joint disruption and degenerative sacroiliitis and who are eligible for MIS; 2) this analysis applies to unilateral MIS procedures performed in the hospital inpatient or hospital outpatient settings; 3) MIS patients who were classified as clinical failures undergo additional treatment, as described in , where MIS treatment failure was defined as having one or more of the following: implant failure, loosening, and/or malpositioning; failure to relieve pain requiring repeat intervention; and/or infection requiring reoperation; 4) MIS patients who were classified as clinical successes incur minimal additional medical resources, such as a reduced class of pain medications or a reduced dose; 5) late complications of MIS such as infection or loosening requiring revision were reflected in the 1-year treatment failure rate for MIS; 6) the health-related quality-of-life (HRQoL) effects of MIS and nonoperative care have not been included in the present analysis; 7) the indirect costs associated with lost productivity and intangible costs of pain and suffering related to treatment morbidity have not been included in the present analysis; and 8) the analysis assumed that a single cohort of patients were followed over several years with no new patients entering or leaving the cohort in subsequent years.
Table 1 Minimally invasive surgery values used in the economic model
Not all patients with SI joint pain and dysfunction necessarily have chronic pain and dysfunction despite medical intervention. However, it remains unknown how many patients truly seek care as little data exist on the effectiveness of nonoperative treatment. To estimate the population size, we assumed the percentage of SI joint disruption patients who experience chronic pain despite medical treatment strategies is 50%. Further, not all patients with SI joint pain and dysfunction are candidates for surgery. Because illness precludes some patients from general anesthesia, we have assumed that 95% of patients are eligible for MIS.
Medical resource utilization and costs: nonoperative care
The medical resource utilization and costs associated with nonoperative care was sourced from a previously published health insurance claims data analysis using the Truven Health MarketScan® database.Citation11,Citation26 In this US commercial payer population (N=78,533), the mean age was 45.2 years (SD [standard deviation] 12.6) and approximately two-thirds (63.7%) were female. The most common diagnoses were sacroiliac subluxation (33.9%), followed by sacroiliitis (25.7%), and disorders of the sacrum (25.0%). These data represent commercial insurance payments (including retail pharmacy), which increased year-over-year. The cumulative commercial payer costs of beneficiaries with SI joint disruption and/or degenerative sacroiliitis at 1, 2, and 3 years were $6,418, $11,540, and $16,789 per patient, respectively (inflated from 2011 to 2012 USD using the Medical Care component of the Consumer Price Index).Citation27 In the subgroup of patients who underwent lumbar spinal fusion (0.6%), the cumulative commercial payer costs at 1, 2, and 3 years were $37,456, $62,104, and $95,081 per patient, respectively (2012 USD). In the subgroup of patients who did not undergo lumbar spinal fusion (99.4%), the cumulative commercial payer costs at 1, 2, and 3 years were $6,246, $11,259, and $16,354 per patient, respectively (2012 USD).
Medical resource utilization and costs: minimally invasive surgery
The sources of parameter estimates are shown in and include the Premier database and Medicare claims data. Previously, 50 patients treated with MIS (iFuse Implant System®; SI-BONE, Inc.)Citation28 experienced early and sustained clinically significant improvements in HRQoL (seven of nine domains) at 12-month follow-up.Citation29 At a mean follow-up of 40 months post-implant, the majority (82%) had a >2 point change in pain score,Citation20 which is the criteria for minimal clinically important difference.Citation29 Similarly, a clinically significant improvement was observed in all but one patient at 1-year follow-up in a retrospective analysis of 40 patients with MIS treatment using the same device.Citation21 Thus, an 82% 1-year treatment success rate for MIS was assumed for the economic model.
Sacroiliac joint fusion with MIS is performed in both the hospital inpatient (84%) and hospital outpatient (16%) settings.Citation30 The MIS index stay was defined as the hospital stay during which the patient underwent the MIS SI joint fusion. The cost of the MIS index stay was sourced from the Premier database, which contains a descriptor field that identifies a MIS SI joint fusion device (). The cost of the MIS index stay reflects hospital costs during the stay in which a unilateral MIS SI joint fusion procedure (with the iFuse Implant System in particular) was performed between January 2010 and February 2013 for patients with commercial insurance. The MIS index stay costs include costs associated with managing clinical, device-related, or procedure-related events that occurred during the index stay or within the assumed 90-day global period. Global periods are typically negotiated with commercial payers on a facility-by-facility basis. MIS procedures with clinical, device-related, or procedure-related events following the index stay and 90-day global period yet during year 1 are reflected in the costs associated with MIS revisions or other subsequent treatments such as lumbar spinal fusion or nonoperative care. Among commercially insured patients, the mean costs of hospital inpatient and hospital outpatient MIS SI joint fusion procedures (from a total of eleven sites) were estimated to be $18,710 (N=24) and $18,580 (N=9), respectively (2012 USD). These figures represent the actual costs for the hospital to provide the care to the patients from a hospital cost-accounting perspective and, therefore, do not reflect the cost to the commercial payer via insurance payments. To inflate hospital-based costs to commercial insurance payments, these figures were multiplied by 1.25 based on recent publications reporting the relationship between US Medicare fee-for-service payments and hospital costs for orthopedic procedures.Citation31,Citation32
Table 2 Minimally invasive surgery: estimated commercial insurance payment used in the economic model (2012 USD)
The Medicare professional fee for the MIS procedure ($1,033.38) was based on the 2012 payment for Current Procedural Terminology code 27280 (arthrodesis, sacroiliac joint – including obtaining graft);Citation33 it was then multiplied by 1.25 based on the 2011 Medicare Payment Advisory Commission report to Congress, which reports the relationship between Medicare and commercial payer professional fees.Citation34
The medical resource use associated with follow-up care for MIS SI joint fusion (including pain medications) was sourced from Ackerman et al,Citation24 with relevant adaptations for the commercial payer population (). Given that Current Procedural Terminology global periods are negotiated with commercial payers on a facility-by-facility basis, two physician office visits in year 1 were assumed to be included under the postsurgical global period and would not incur additional cost, according to guidance and regulations issued by Centers for Medicare and Medicaid Services.Citation35,Citation36 Follow-up costs were again multiplied by 1.25 to reflect commercial insurance payments.Citation31,Citation32
Sensitivity analysis
Similar to a previously described economic model that compares costs of nonoperative care to MIS among Medicare beneficiaries,Citation24 sensitivity analyses were performed in the present commercial payer analysis to determine the consequences of making alternative assumptions for model parameters, including: the inclusion of ICD-9-CM code 721.3 (lumbosacral spondylosis); the setting of care (hospital inpatient versus hospital outpatient); the durability of the MIS treatment success rate at year 1 (inclusive of the percentage of MIS procedures with clinical, device-related, or procedure-related events); the distribution of subsequent treatments for MIS failures; the MIS index stay costs; the multiplier to convert hospital costs for the MIS index stay to estimated commercial insurer payments; the percentage of patients with lumbar spinal fusions performed within 1 year before receiving a diagnosis of SI joint disruption and/or degenerative sacroiliitis;Citation37 the time horizon; and the discount rate for extrapolation. The robustness of the model results was assessed by varying the model inputs over plausible ranges to reflect realistic scenarios.
For the sensitivity analysis conducted on the time horizon of the model, assumptions for extrapolation were made. Specifically, the cumulative cost of nonoperative care was assumed to increase linearly from year 4 to year 10. The ongoing costs associated with MIS in year 4 to year 10 of the economic model were assumed to be the costs of pain medications and continued nonoperative care among MIS treatment failures; these ongoing costs were assumed to remain constant over time.
In addition, two threshold analyses were performed: 1) to estimate at what year cost neutrality was achieved following the MIS index stay; and 2) to estimate the MIS index stay commercial insurer payment that results in cost neutrality for the overall group by year following the MIS index stay. Cost neutrality is achieved when the cost of nonoperative care equals the cost of MIS.
Of note, for the base-case analysis, we adjusted the commercial payer population size to reflect patients who suffer from chronic LBP due to SI joint disruption and degenerative sacroiliitis who are eligible for MIS. Sensitivity analyses were performed for the percentage of patients with chronic pain and the percentage of patients who are eligible for MIS surgery.
Results
In the overall group, the estimated cumulative 3-year commercial insurance payments for patients treated with nonoperative care were $16,339 per patient compared to $30,884 per patient for MIS, resulting in a per-patient differential of $14,545 as shown in . For patients with lumbar spinal fusion (N=553), the per-patient differential was $54,817, due to higher cumulative 3-year costs for nonoperative care of $92,470 per patient compared to cumulative 3-year costs for MIS at $37,653 per patient. For patients without lumbar spinal fusion (99.4% of the sample population), the per-patient differential of $14,931 was similar to that of the overall group.
Table 3 Commercial payer population results from the economic model, cumulative 3-year and 5-year costs, excluding ICD-9-CM diagnosis code 721.3 (2012 USD)
Sensitivity analyses
Sensitivity analyses were performed to address uncertainty in the economic model and to determine which variables substantially affected the results. When key model parameters were varied, such as the durability of MIS treatment success at year 1 and the percentage of MIS procedures with clinical, device-related, or procedure-related events, the costs fell within a relatively narrow range, suggesting that the economic model is robust to plausible parameter values based on realistic clinical scenarios. As expected, the results were sensitive to extending the time horizon, modifying the MIS index stay costs, and changing the multiplier to convert hospital costs for the MIS index stay to estimated commercial insurance payments ( and ). The results were less sensitive to changes in the distribution of subsequent treatments for MIS failures, setting of care, and discount rate.
Figure 1 Sensitivity analysis of 3-year cost differentials between nonoperative care and minimally invasive surgery (2012 USD).
Abbreviations: clin, clinical; FFS, fee-for-service; ICD-9-CM, International Classification of Diseases, Ninth Revision, Clinical Modification; MIS, minimally invasive surgery; pts, patients; PT, physical therapy; SD, standard deviation; SI, sacroiliac; USD, United States dollars.
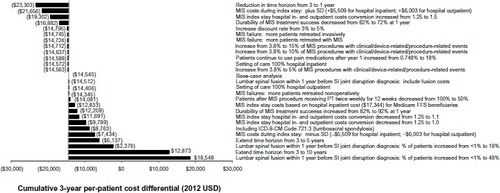
Table 4 Sensitivity analysis for minimally invasive surgery compared with nonoperative care (2012 USD), cumulative 3-year costs, excluding ICD-9-CM diagnosis code 721.3
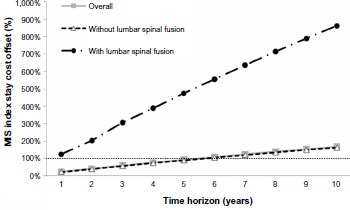
In the base-case analysis that evaluated cumulative 3-year costs, the differential in commercial insurance payments (calculated as cost of nonoperative care − cost of MIS) was $14,545 per patient whereas, in the sensitivity analysis that estimated cumulative 5-year costs, the differential was $6,137 per patient (). A threshold analysis was performed to estimate at what year cost neutrality was achieved following the MIS index stay. By extending the time horizon, MIS treatment achieved cost neutrality in the overall group at approximately 6 years (), whereby much of the costs for MIS accrued in year 1, whereas the costs of nonoperative care accrued over time with 92% of up-front MIS procedure costs being offset by year 5 (). For patients with lumbar spinal fusion, cost neutrality was achieved in year 1.
Figure 2 Per-patient cost differential over time (2012 USD).
Abbreviations: MIS, minimally invasive surgery; USD, United States dollars.
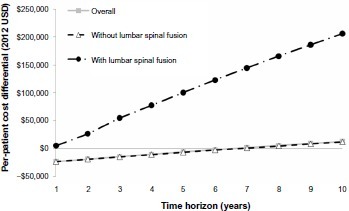
Figure 3 MIS index stay cost offset (%).
Abbreviation: MIS, minimally invasive surgery.
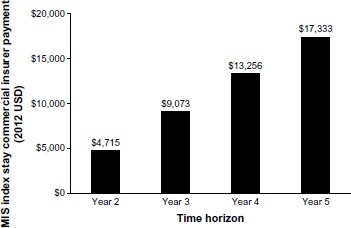
A threshold analysis also was performed to estimate the MIS index stay commercial insurer payment that results in cost neutrality for the overall group by year following the MIS index stay. The MIS index stay was defined as the hospital stay in which the MIS SI joint fusion procedure was performed. The MIS index stay commercial insurance payment that achieved cost neutrality at year 3 (the base-case time horizon) was $9,073, whereas the amount that achieved cost neutrality at year 5 (the ISPOR Task Force recommended time horizon for chronic conditions) was $17,333 ().
Figure 4 MIS index stay insurer payment that results in cost neutrality for the overall group by year following the MIS index stay (2012 USD).
Abbreviations: MIS, minimally invasive surgery; SI, sacroiliac; USD, United States dollars.
Discussion
US commercial payers have traditionally focused on 1- to 3-year timeframes for economic models, which correspond to their budget and contracting cycles. However, the information gleaned from economic models extends beyond forecasting the fiscal impact of a new medical technology on health plan budgets.Citation38 Rather, economic models facilitate: 1) exploring the extent to which costs of a new intervention may be offset by reductions in other medical costs; and 2) identifying subpopulations that benefit most.Citation38
This study demonstrates that cumulative 3-year costs associated with MIS SI joint fusion are higher than with nonoperative care where cost neutrality is achieved at approximately 6 years in the overall group and during year 1 for patients with lumbar spinal fusion. The base-case time horizon of 3 years was chosen based on available Truven Health commercial payer data in addition to the ISPOR Task Force guidelines on conducting budget impact analyses, which recommend a 1- to 5-year time horizon, with longer and shorter time horizons included to provide more complete information of budgetary consequences.Citation25 For chronic conditions with longer-term consequences, it has been argued that employers and private health insurers should be interested in time horizons longer than 3 years,Citation38 particularly when one considers conditions that affect working age individuals, such as SI joint disruption, because productivity gains may offset increased health care expenditures.Citation8,Citation25,Citation39 Several recent economic models evaluating treatments for chronic conditions, including chronic low back pain, from the US private payer perspective have included longer timeframes, such as a lifetime.Citation40,Citation41
MIS costs accrue largely in year 1, whereas the costs of nonoperative care accrue over time so that, as noted by the ISPOR Task Force, a longer time horizon is oftentimes required to capture the cost offsets from new interventions for chronic health conditions such as MIS SI joint fusion. Importantly, sensitivity analyses were conducted by varying the time horizon from 1 to 10 years and are shown annually to provide the most complete and useful set of results. As shown in and , longer time horizons may be required to capture the costs and benefits that accrue over time due to ongoing costs associated with chronic conditions. In addition, a threshold analysis was conducted to estimate the commercial insurance payment for the MIS index stay that results in cost-neutrality over a 5-year time horizon, and the values were reported by year (). The MIS index stay commercial insurance payment that achieved cost neutrality at year 5 (the ISPOR Task Force recommended time horizon for chronic conditions) was $17,333, which is similar to the hospital inpatient MIS index stay costs among Medicare fee-for-service beneficiaries of $17,344 from the Premier database.
The mean age in the Truven Health commercial payer data used here was 45.2 years (SD =12.6) and approximately two-thirds of the population (63.7%) were female.Citation11 While some SI joint disruption patients are of child bearing age, the effect of MIS SI joint fusion on vaginal delivery and whether caesarean would be needed is not known. More broadly, SI joint disruption affects a working-age population. Approximately 61% of covered workers in the US are in a self-insured health plan.Citation42,Citation43 In response to the Patient Protection and Affordable Care Act, health insurers are predicting an increase in self-insured health insurance plans by US employers. In addition to direct medical costs, patients are subject to lost wages, and employers are subject to the indirect costs of lost productivity and lost time from work (for example, due to recurring nonoperative interventions), which have not been included in the present analysis. The substantial absenteeism, lost productivity, and lost wages in this working-age populationCitation5,Citation6 are particularly relevant to employers given that productivity gains may offset increased health care expenditures.Citation8,Citation39 Further, the average duration of employment at a given company in the US is 4.6 years,Citation44 which makes a longer (eg, 5-year) time horizon particularly relevant when considering treatment of chronic conditions such as SI joint disruption.
In the economic analysis, MIS costs accrued largely in year 1, whereas the costs of nonoperative care accrued over time with 59% and 92% of initial MIS procedure costs being offset by year 3 and year 5, respectively (). As noted earlier, the HRQoL effects of MIS treatment and nonoperative care were not included in this analysis. Yet, early and sustained clinical improvement through 1-year follow-up were reported among MIS patients in the following HRQoL domains: pain; pain effect on social interest; sleep; activities (light, moderate, and vigorous); and overall happiness.Citation20 In addition, Duhon et al reported improvements in HRQoL (6.7 point improvement in short form 36, P=0.003) at 6-months’ follow-up with MIS.Citation45 Compared to nonoperative care, long-term costs of MIS may be lower and HRQoL improvements of MIS may be greater due to the need for continued nonoperative therapy over time.Citation24
Because of the difficulty in diagnosing SI pathology, lumbar spinal fusion is known to be performed on patients who actually have SI pathology. In the present analysis, less than 1% of commercial payer patients underwent lumbar spinal fusion in the year before or 3 years after receipt of a SI joint disruption diagnosis. In contrast, 3.7% of Medicare patients diagnosed with SI joint disruption and/or degenerative sacroiliitis underwent lumbar spinal fusion within 1 year before or 5 years after diagnosis.Citation26 Previous lumbar spinal fusion has been reported in 18% and 48% of patients treated with MIS SI joint fusion (mean ages 54 years and 58 years, respectively),Citation20,Citation21 suggesting that the 4-year window based on the Truven Health data that informed the present analysis may have been too short to completely capture the patients who underwent lumbar spinal fusion before or after MIS SI joint fusion.
Limitations
The study has a number of limitations. First, the MIS treatment success rate at 1 year (82%) is based on two retrospective studies with 50 and 40 consecutive patients, respectively.Citation20,Citation21 In the first retrospective study by Rudolf, 82% of patients reached minimal clinically important difference in pain score at a mean follow-up of 40 months post-implant. These patients also experienced improvements in seven of nine HRQoL domains at 1-year follow-up; the improvements were both statistically significant and clinically relevant despite the small sample size (N=50).Citation20 The same MIS system was evaluated in a retrospective study of 40 patients; 39 out of 40 patients achieved clinically significant improvements at 1-year follow-up.Citation21 In the Rudolf study, half of perioperative complications were minor (mild hematoma at the incision site and superficial cellulitis) and required little to no intervention.Citation20 The other perioperative complications (N=5) were major, with three patients requiring retraction of a misplaced implant in the operating room, one patient experiencing a nondisplaced fracture that healed without intervention, and one patient experiencing a deep soft tissue wound infection that resolved with a course of intravenous antibiotics. The 20% rate of perioperative complications resembles previously published rates.Citation20 The 50-patient cohort experienced a revision rate of 8% after 3 years,Citation20 which was also comparable to revision rates for other MIS treatments (8%–15%).Citation16,Citation18,Citation46–Citation49 A recent post-market complaints database analysis for a new MIS system reported a complication rate of 3.8% (204 of 5,319 patients) over a 4-year period.Citation19 In that study, 96 revision surgeries (94 patients [1.8%]) were performed at a median follow-up time of 4 months. A total of 56 revisions were performed in the early postoperative period due to either a symptomatic malpositioned implant (N=46) or an improperly sized implant in an asymptomatic patient (N=10).Citation19 Late revisions were primarily to treat symptom recurrence (N=34).Citation19 Preliminary results of a prospective, single-arm, multicenter study (N=26) further support the effectiveness data described above.Citation45 At 6-months post-implant, significant improvements were noted in pain (49-point improvement in visual analog pain scale score, P<0.0001) and disability (15.8 point improvement in Oswestry Disability Index, P<0.0001).Citation45
Similar to the previously published economic model among Medicare beneficiaries,Citation24 we have defined MIS treatment failure as having one or more of the following: implant failure, loosening, and/or malposition; failure to relieve pain requiring repeat intervention; and infection requiring reoperations. The findings discussed aboveCitation19–Citation21 suggest that the 82% 1-year MIS treatment success rate is reasonable as a base-case value for the economic model. With that being said, the lasting effects of MIS treatment on symptoms of SI joint disruption can only be estimated because durability data for MIS are only available for up to 4 years.Citation19 Therefore, a MIS failure rate of 18% within the first 12 months has been incorporated in the economic model based on the reported clinical experience to date. Recognizing the small sample sizes in the Rudolf Citation20 and SachsCitation21 studies (50 and 40 patients, respectively) and limited longer-term durability data, we varied the 1-year MIS treatment success rate from 72% to 92% in a sensitivity analysis (). Of note, modifying the MIS treatment success rate at 1 year did not affect the results as much as other factors such as the time horizon.
In the economic model, the multiplier to convert the MIS index stay costs to commercial insurer payments was set at 1.25,Citation31,Citation32 acknowledging that there was substantial variability in the Premier data for estimating the MIS index stay costs and that the sample size was limited. The uncertainty in the relationship between MIS index stay costs and commercial insurance payments was addressed by performing a sensitivity analysis in which the multiplier was varied from 1.0 to 1.5. Furthermore, given that commercial insurer payment changes dynamically with adjustments in Medicare payments, a sensitivity analysis was performed by using Premier data MIS index stay costs based on hospital inpatient costs of $17,344 for Medicare fee-for-service beneficiaries, which is similar to the commercially-insured hospital inpatient and outpatient MIS index stay costs of $18,710 and $18,580, respectively; as such, the results remained similar.
Conclusion
Cost offsets from new interventions for chronic health conditions such as MIS SI joint fusion accrue over time. Despite the higher up-front MIS SI joint fusion procedure costs, the costs of MIS were largely offset by decreased nonoperative care costs over a 5-year time horizon from a US commercial payer perspective. This is particularly relevant to self-insured employers in light of the substantial absenteeism, lost productivity, and lost wages in this working-age population, whereby productivity gains may offset increased health care expenditures.Citation8,Citation39 Optimizing effective resource use in both nonoperative and operative patients will facilitate cost-effective health care delivery and improved HRQoL. The impact of SI joint disruption and degenerative sacroiliitis on direct and indirect costs to commercial insurers, health plan beneficiaries, and employers warrants further consideration.
Acknowledgments
We thank Karen Spach, PhD, of Covance Market Access Services, for her editorial contribution to this manuscript.
Disclosure
This research was performed according to guidelines (GPP2) established to minimize conflict of interest in pharmacoeconomic studies.Citation22,Citation23 A multispecialty panel comprising clinicians and methodologists (the coauthors) provided the framework for the economic analysis and completed the data analysis and interpretation of the results. The sponsor, SI-BONE, Inc., did not participate in the data analysis, interpretation of the results, or writing of the manuscript. SI-BONE was provided a final version of the manuscript for informational purposes only. It did not provide comments or influence the content or writing of the manuscript. SJA, KS, and TK are consultants to SI-BONE through their employment at Covance. DWP has not received any financial support from SI-BONE. DWP receives research support from the Department of Defense, Orthopaedic Research and Education Foundation, Minnesota Medical Foundation, and Chest Wall and Spine Deformity Foundation. TH and JC are paid teaching and clinical research consultants for SI-BONE. The authors report no other conflicts of interest.
References
- Committee on Advancing Pain Research Care and Education [webpage on the Internet]Board on Health Science Policy. Pain as a Public Health ChallengeRelieving Pain in America: A Blueprint for Transforming Prevention, Care, Education, and ResearchWashington, DCThe National Academies Press2011 Available from: http://www.painsproject.org/documents/iom_report.pdfAccessed April 28, 2014
- FreburgerJKHolmesGMAgansRPThe rising prevalence of chronic low back painArch Intern Med2009169325125819204216
- DagenaisSCaroJHaldemanSA systematic review of low back pain cost of illness studies in the United States and internationallySpine J20088182018164449
- ThorpeKEFlorenceCSHowardDHJoskiPThe rising prevalence of treated disease: effects on private health insurance spendingHealth Aff (Millwood)2005 Suppl Web ExclusivesW5-317W5-32515983005
- KatzJLumbar disc disorders and low-back pain: socioeconomic factors and consequencesJ Bone Joint Surg Am200688Suppl 2212416595438
- MurrayWSacroiliac joint dysfunction: a case studyOrthop Nurs2011302126131 quiz 132–12321422895
- JanickiHEmployment-Based Health Insurance: 2010Suitland, MDUnited States Census Bureau2013
- Worker Productivity [webpage on the Internet]Atlanta, GACenters for Disease Control and Prevention2013 Available from: http://www.cdc.gov/workplacehealthpromotion/businesscase/reasons/productivity.htmlAccessed March 6, 2014
- SembranoJNPollyDWJrHow often is low back pain not coming from the back?Spine (Phila Pa 1976)2009341E27E3219127145
- SchwarzerACAprillCNBogdukNThe sacroiliac joint in chronic low back painSpine (Phila Pa 1976)199520131377709277
- AckermanSJPollyDWJrKnightTHoltTCummingsJManagement of sacroiliac joint disruption and degenerative sacroiliitis with nonoperative care is medical resource-intensive and costly in a United States commercial payer populationClinicoecon Outcomes Res20146637424596468
- LaslettMYoungSBAprillCNMcDonaldBDiagnosing painful sacroiliac joints: A validity study of a McKenzie evaluation and sacroiliac provocation testsAust J Physiother2003492899712775204
- SzadekKMvan der WurffPvan TulderMWZuurmondWWPerezRSDiagnostic validity of criteria for sacroiliac joint pain: a systematic reviewJ Pain200910435436819101212
- ManchikantiLPampatiVFalcoFJHirschJAGrowth of spinal interventional pain management techniques: analysis of utilization trends and Medicare expenditures 2000 to 2008Spine (Phila Pa 1976)201338215716822781007
- GiannikasKAKhanAMKarskiMTMaxwellHASacroiliac joint fusion for chronic pain: a simple technique avoiding the use of metalworkEur Spine J200413325325614648303
- MooreJDJrUnder new authority. KU Hospital joins movement toward independenceMod Healthc199727744 48
- MorganPMAndersonAWSwiontkowskiMFSymptomatic sacroiliac joint disease and radiographic evidence of femoroacetabular impingementHip international: the journal of clinical and experimental research on hip pathology and therapyMar-Apr201323221221723417531
- BuchowskiJMKebaishKMSinkovVCohenDBSieberANKostuikJPFunctional and radiographic outcome of sacroiliac arthrodesis for the disorders of the sacroiliac jointSpine J200555520528 discussion 52916153580
- MillerLERecklingWCBlockJEAnalysis of postmarket complaints database for the iFuse SI Joint Fusion System®: a minimally invasive treatment for degenerative sacroiliitis and sacroiliac joint disruptionMed Devices (Auckl)20136778423761982
- RudolfLSacroiliac joint arthrodesis-MIS Technique with titanium implants: report of the first 50 patients and outcomesOpen Orthop J2012649550223284593
- SachsDCapobiancoRMinimally invasive sacroiliac joint fusion: one-year outcomes in 40 patientsAdv Orthop2013201353612823997957
- GrafCBattistiWPBridgesDResearch Methods and Reporting. Good publication practice for communicating company sponsored medical research: the GPP2 guidelinesBMJ2009339b433019946142
- SchulmanKARubensteinLEGlickHAEisenbergJMRelationships between sponsors and investigators in pharmacoeconomic and clinical researchPharmacoeconomics19957320622010155310
- AckermanSJPollyDWKnightTSchneiderKHoltTCummingsJComparison of cost of non-operative care to minimally invasive surgery for sacroiliac joint disruption and degenerative sacroiliitis in a United States Medicare population: potential economic implications of a new minimally-invasive technologyClinicoecon Outcomes Res2013557558724348055
- SullivanSDMauskopfJAAugustovskiFBudget impact analysis-principles of good practice: report of the ISPOR 2012 Budget Impact Analysis Good Practice II Task ForceValue Health20141751424438712
- AckermanSJPollyDWJrKnightTHoltTCummingsJJrNonoperative care to manage sacroiliac joint disruption and degenerative sacroiliitis: high costs and medical resource utilization in the United States Medicare populationJ Neurosurg Spine April201420435436324527824
- Consumer Price Index – All Urban Consumers [webpage on the Internet]Washington DCBureau of Labor and Statistics2013 Available from: http://data.bls.gov/timeseries/CUUR0000SAM?include_graphs=false&output_type=column&years_option=all_yearsAccessed November 4, 2013
- US Food Drug AdministrationSI-Bone’s iFuse SI Fusion System 501(k) Summary LetterSilver Spring MDUS Food and Drug Administration2011 Available from: http://www.accessdata.fda.gov/cdrh_docs/pdf11/K110838.pdfAccessed September 13, 2012
- CopayAGGlassmanSDSubachBRBervenSSchulerTCCarreonLYMinimum clinically important difference in lumbar spine surgery patients: a choice of methods using the Oswestry Disability Index, Medical Outcomes Study questionnaire Short Form 36, and pain scalesSpine J20088696897418201937
- LorioMPPollyDWAndressonGPrevalence of Minimally Invasive Sacroiliac Joint Fusions and Site of Service8th Interdisciplinary World Congress Lower Back and Pelvic PainDubaiUnited Arab Emirates October27312013
- HealyWLRanaAJIorioRHospital economics of primary total knee arthroplasty at a teaching hospitalClin Orthop Relat Res20114691879420694537
- RanaAJIorioRHealyWLHospital economics of primary THA decreasing reimbursement and increasing cost, 1990 to 2008Clin Orthop Relat Res2011469235536120809168
- National Physician Fee Schedule Relative Value File July Release [webpage on the Internet]Baltimore, MDCenters for Medicare and Medicaid Services2012 Available from: http://www.cms.gov/Medicare/Medicare-Fee-for-Service-Payment/PhysicianFeeSched/PFS-Relative-Value-Files-Items/RVU12C.htmlAccessed September 11, 2012
- Medicare Payment Advisory CommissionReport to the Congress: Medicare Payment PolicyWashington DCMedPAC2011
- Department of Health and Human ServicesGlobal Surgery Fact SheetBaltimore, MDCenters for Medicare and Medicaid Services2012 Available from: http://www.cms.gov/Outreach-and-Education/Medicare-Learning-Network-MLN/MLNProducts/downloads/GloballSurgery-ICN907166.pdfAccessed February 17, 2012
- Medicare Claims Processing ManualBaltimore, MDCenters for Medicare and Medicaid Services2012 Available from: http://www.cms.gov/Regulations-and-Guidance/Guidance/Manuals/downloads/clm104c12.pdfAccessed February 12, 2013
- AckermanSJHoltTAPollyDWKnightTHow Often Is Lumbar Spinal Fusion Performed Prior to Diagnosis of Sacroiliac Joint Disruption? Paper presented atInternational Society for the Advancement of Spine Surgery 2014 Annual MeetingMay 2, 2014Miami Beach, FL
- WatkinsJBMinshallMESullivanSDApplication of economic analyses in US managed care formulary decisions: a private payer’s experienceJ Manag Care Pharm200612972673517249905
- Partnership for Prevention [webpage on Internet]Leading by Example: CEOs on the business case for worksite health promotionWashington DC2005 Available from: http://www.prevent.org/data/files/initiatives/lbe_smse_2011_final.pdfAccessed April 28, 2014
- WielageRCBansalMAndrewsJSKleinRWHappichMCost-utility analysis of duloxetine in osteoarthritis: a US private payer perspectiveAppl Health Econ Health Policy201311321923623616247
- WielageRCBansalMAndrewsJSWohlreichMMKleinRWHappichMThe cost-effectiveness of duloxetine in chronic low back pain: a US private payer perspectiveValue Health201316233434423538186
- Kaiser Family Foundation 2012Employer Health Benefits Survey Available from: http://kff.org/private-insurance/report/employer-health-benefits-2012-annual-survey/Accessed November 6, 2013
- ebri.orgSelf-insured Health Place: State Variation and Recent Trends by Firm SizeWashington DCebri.org2012 Available from: http://www.ebri.org/pdf/notespdf/EBRI_Notes_11_Nov-12.Slf-Insrd1.pdfAccessed November 6, 2013
- Employment Tenure Summary [webpage on the Internet]Washington, DCBureau of Labor Statistics2012 Available from: http://www.bls.gov/news.release/tenure.nr0.htmAccessed February 18, 2014
- DuhonBSCherDJWineKDLockstadtHKovalskyDSooCLSafety and 6-month effectiveness of minimally invasive sacroiliac joint fusion: a prospective studyMed Devices (Auckl)2013621922924363562
- KibsgårdTJRøiseOSudmannEStugeBPelvic joint fusions in patients with chronic pelvic girdle pain: a 23-year follow-upEur Spine J201322487187723001416
- Al-KhayerAHegartyJHahnDGrevittMPPercutaneous sacroiliac joint arthrodesis: a novel techniqueJ Spinal Disord Tech200821535936318600147
- WiseCLDallBEMinimally invasive sacroiliac arthrodesis: outcomes of a new techniqueJ Spinal Disord Tech200821857958419057252
- WaisbrodHKrainickJUGerbershagenHUSacroiliac joint arthrodesis for chronic lower back painArch Orthop Trauma Surg198710642382402956935