
Abstract
Background
Since the burden of neuropathic pain (NeP) increases with pain severity, it is important to characterize and quantify pain severity when identifying NeP patients. This study evaluated whether painDETECT, a screening questionnaire to identify patients with NeP, can distinguish pain severity.
Materials and methods
Subjects (n=614, 55.4% male, 71.8% white, mean age 55.5 years) with confirmed NeP were identified during office visits to US community-based physicians. The Brief Pain Inventory – Short Form stratified subjects by mild (score 0–3, n=110), moderate (score 4–6, n=297), and severe (score 7–10, n=207) average pain. Scores on the nine-item painDETECT (seven pain-symptom items, one pain-course item, one pain-irradiation item) range from −1 to 38 (worst NeP); the seven-item painDETECT scores (only pain symptoms) range from 0 to 35. The ability of painDETECT to discriminate average pain-severity levels, based on the average pain item from the Brief Pain Inventory – Short Form (0–10 scale), was evaluated using analysis of variance or covariance models to obtain unadjusted and adjusted (age, sex, race, ethnicity, time since NeP diagnosis, number of comorbidities) mean painDETECT scores. Cumulative distribution functions on painDETECT scores by average pain severity were compared (Kolmogorov–Smirnov test). Cronbach’s alpha assessed internal consistency reliability.
Results
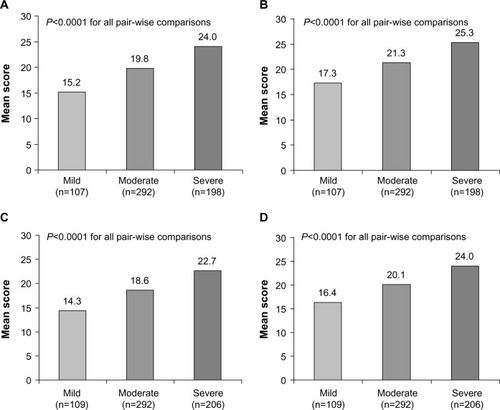
Unadjusted mean scores were 15.2 for mild, 19.8 for moderate, and 24.0 for severe pain for the nine items, and 14.3, 18.6, and 22.7, respectively, for the seven items. Adjusted nine-item mean scores for mild, moderate, and severe pain were 17.3, 21.3, and 25.3, respectively; adjusted seven-item mean scores were 16.4, 20.1, and 24.0, respectively. All pair-wise comparisons of scores between pain-severity groups showed sizable and statistically significant differences (P<0.0001). Cumulative distribution functions showed distinct separation between severity (P<0.0001). Cronbach’s alphas were 0.76 and 0.80 for the nine- and seven-item scales, respectively.
Conclusion
This study provides strong psychometric evidence on the validity and reliability of painDETECT for distinguishing average pain severity in patients with NeP.
Introduction
Neuropathic pain (NeP), a common cause of chronic pain, results from a variety of diseases and medical conditions, and is defined as pain caused by a lesion or disease of the peripheral somatosensory nervous system.Citation1 Although heterogeneity in epidemiologic studies has been a limitation in estimating its presence in the population, best estimates suggest that the overall prevalence of pain with neuropathic characteristics is between 7% and 10%.Citation2 However, when NeP is present, it is associated with a substantial socioeconomic burden that has been characterized not only for conditions that are well recognized (eg, painful diabetic peripheral neuropathy and chronic low-back pain) but also for several that are less frequent (eg, small-fiber neuropathy).Citation3–Citation7 Furthermore, evidence suggests that the patient and economic burdens are higher at greater pain-severity levels.Citation3–Citation7
Because there is only weak evidence for interventional management of NeP,Citation8 treatment relies on a pharmacologic approach, and guidelines for pharmacologic management of NeP have been published.Citation9,Citation10 Despite these recommendations and the availability of medications from several drug classes, NeP management remains challenging, not least because of the need for appropriate identification of NeP when making treatment decisions.
To identify the presence of NeP in patients reporting chronic pain, differences in the symptoms and descriptions of NeP relative to nociceptive pain were investigated to develop various instruments to screen for the likelihood that pain is of neuropathic rather than nociceptive origin.Citation11 While some instruments, such as the DN4 (Douleur Neuropathique 4)Citation12 and the original Leeds Assessment of Neuropathic Symptoms and Signs (LANSS)Citation13 include a requirement for clinical examination, other instruments, such as a patient self-report version of the LANSS (S-LANSS),Citation14 as well as painDETECT,Citation15 do not require clinical examination. In particular, painDETECT is a simple, fully patient-reported questionnaire that has been validated for screening and identification of components of NeP.Citation15 In contrast to S-LANSS, which evaluates sensory symptoms based on a dichotomous response (yes/no), painDETECT consists of 6-point Likert-type scales, which provide a broader range or continuum of assessment. Since pain severity is not only of immediate importance to patients but also increases the overall burden, characterizing pain-severity levels when identifying patients with NeP can help inform treatment decisions. Although an association between pain severity and painDETECT scores was suggested in several studies, including the original painDETECT-validation study,Citation15–Citation17 this relationship has not been psychometrically evaluated with the goal of differentiating NeP severity. Therefore, the purpose of this study was to determine whether painDETECT can differentiate among levels of average pain severity in patients with NeP.
Materials and methods
Data source
Data for this analysis were obtained during a cross-sectional, observational study on the burden of NeP across six NeP conditions: painful diabetic peripheral neuropathy,Citation4 human immunodeficiency virus-related peripheral NeP,Citation18 posttrauma/postsurgical NeP,Citation5 spinal cord injury-related NeP,Citation6 chronic low-back pain-associated NeP,Citation19 and small-fiber neuropathy.Citation7 The study was approved by a central institutional review board (Concordia Clinical Research, Cedar Knolls, NJ, USA), and collection and analysis of data were compliant with the Health Insurance Portability and Accountability Act.
Subjects
Subjects with a confirmed diagnosis of any of the six conditions were identified during routine office visits at 33 community-based physician practices across the US between September 2011 and June 2012. Study sites included general practitioners (n=9), neurologists (n=7), pain specialists (n=6), endocrinologists (n=3), and other specialists (eg, orthopedist, infectious disease specialist, podiatrist, rheumatologist; n=8).
For inclusion, subjects were required to be adults (≥18 years old) diagnosed with their NeP at least 6 months prior to enrollment, managed by the physician’s practice for at least 6 months, and had experienced NeP symptoms for at least the prior 3 months. Exclusion criteria were participation in an investigational drug study in the past 6 months; presence of a serious or unstable medical or psychological condition that in the opinion of the physician would compromise participation in the study; or having a concomitant illness unrelated to NeP that could have confounded the assessment of NeP.
Outcomes
Subjects were asked to complete a series of self-administered, one-time questionnaires during the office visit that included patient-reported measures of pain, function, quality of life, and productivity, as previously described.Citation4,Citation6,Citation7 Of relevance to the current analysis, the questionnaire included the Brief Pain Inventory – Short Form (BPI-SF)Citation20 and the painDETECT questionnaire.Citation15
Patients were stratified based on their level of average pain within the past 24 hours using the average pain item from the BPI-SF, which consists of an 11-point numeric rating scale (0= no pain to 10= pain as bad as you can imagine). Pain-severity levels based on previously established cut points were defined as mild (score 0–3), moderate (score 4–6), and severe (score 7–10).Citation21
painDETECT is a nine-item questionnaire that consists of seven sensory symptom items for pain that are graded from 0= never to 5= strongly, one temporal item on pain-course pattern graded −1 to +1, and one spatial item on pain radiation graded 0 for no radiation or +2 for radiating pain. A total score that ranges from −1 to 38 can be calculated from the nine items, with higher scores indicating higher levels of NeP. Although the nine-item questionnaire demonstrated strong predictive ability for NeP, principal-component analysis identified the seven sensory items as driving the data structure of the questionnaire.Citation15 Therefore, the seven-item version of painDETECT that only includes the sensory symptom items and a total score that ranges from 0 to 35 was also evaluated for its ability to differentiate pain severity.
Statistical analyses
Scores on painDETECT were derived for subjects who had no missing responses on the sensory items (seven- and nine-item scales), and response was also required on the pain-course item on the nine-item scale. Scale-level discrimination was evaluated using unadjusted and adjusted models.Citation22 The ability of painDETECT to discriminate between average pain-severity levels of mild, moderate, and severe, based on the average pain item from the BPI-SF as described earlier, was determined using analysis of variance or covariance models (both models used Tukey’s adjustment for pair-wise comparisons) to obtain, respectively, unadjusted and adjusted mean painDETECT scores. Factors in the adjusted models were age, sex, race, ethnicity, time since NeP diagnosis, and number of comorbidities.
The corresponding mean scores on painDETECT between pairs of severity groups were translated into standardized effect sizes,Citation22 derived by taking the difference between pair-wise means and dividing them by the pooled standard deviation on painDETECT across the three severity groups. By convention, a standardized effect size of 0.20 is considered “small”, while 0.50 and 0.80 are “medium” and “large”, respectively.Citation23 Additionally, cumulative distribution of painDETECT scores by (average) pain severity were plotted and compared using the Kolmogorov–Smirnov test.Citation24
Scale-level reliability was evaluated using Cronbach’s alpha (covariance-based formula)Citation22 to determine the internal consistency reliability of the nine- and seven-item versions of painDETECT. Assessment of item-level discrimination was performed using corrected item-to-total correlationsCitation22 to determine how well each item discriminated across neuropathic levels of pain as measured by painDETECT.Citation22 These were “corrected” to account for item overlap by deleting the item under consideration from the total score. All analyses and statistics were performed using SAS version 9.2 (SAS Institute, Cary, NC, USA).
Results
Subject characteristics
The study enrolled 624 subjects who were identified with the NeP conditions, with approximately the same number of subjects from each NeP condition. Data on average pain severity were available for 614 subjects, with an average pain-severity distribution of 17.9%, 48.4%, and 33.7% for mild, moderate, and severe pain, respectively (). These subjects were 55.4% male and predominantly white (71.8%), with a mean (standard deviation) age of 55.5 (13.7) years (). However, with increasing levels of pain severity, significant trends were observed across severity levels (P<0.05) toward younger age, higher proportion of females, longer duration since NeP diagnosis, and more comorbid conditions ().
Table 1 Demographic and clinical characteristics by neuropathic pain severity
Among the 614 subjects with pain-severity data, the response rate for the painDETECT questionnaire was 96.9% and 98.7% for the nine- and seven-item versions, respectively; only two subjects (one mild and one moderate pain) had nine-item scores despite a missing pain-radiation item (which was taken to indicate no radiating pain and hence given a value of 0). Similar proportions of subjects across the pain-severity categories completed both versions ().
Scale-level discrimination
On the nine-item version of painDETECT, unadjusted mean scores were 15.2, 19.8, and 24.0, for mild, moderate, and severe pain, respectively (). These scores differentiated between levels of average reported pain, with all pair-wise comparisons statistically significant (P<0.0001). The significant differentiation between all pair-wise comparisons was maintained for the adjusted mean scores of 17.3 (mild), 21.3 (moderate), and 25.3 (severe) (P<0.0001) (). Similarly, for the seven-item version, both the unadjusted () and adjusted painDETECT () scores differentiated between average pain-severity levels, as indicated by the statistical significance for all pair-wise comparisons (P<0.0001).
Figure 1 (A–D) Mean painDETECT scores across pain-severity categories for average pain. (A) Nine-item unadjusted scores; (B) nine-item adjusted scores; (C) seven-item unadjusted scores; (D) seven-item adjusted scores.
Standardized effect sizes were slightly lower (with no practical importance) for adjusted mean scores relative to unadjusted mean scores, and if anything slightly lower for the seven-item version than the nine-item version (). Both the nine-item scores and the seven-item scores showed separation with respect to the three levels of average pain severity, with strength of differentiation that was at least medium (effect sizes ≥0.50) across all comparisons, even after adjustment (). While the magnitude of separation was in the medium range for mild versus moderate pain and moderate versus severe pain, it was consistently large for mild versus severe pain.
Table 2 Standardized effect sizes for pair-wise comparisons of painDETECT scores
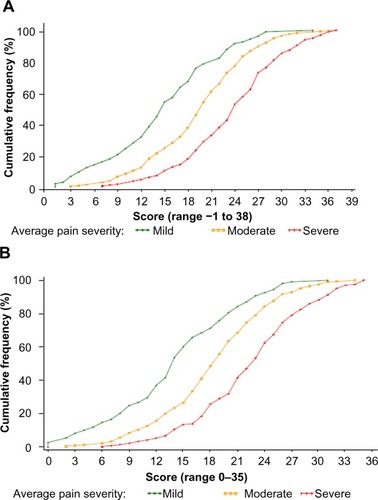
The cumulative frequency-distribution plots for painDETECT scores are shown in for the nine-item version () and the seven-item version (). Both versions demonstrated differentiation between pain-severity levels that was statistically significant for all pair-wise comparisons (P<0.0001); for each painDETECT score, the proportion of patients at that score or lower (more favorable score) was greater at lower levels of pain severity. For example, for the seven-item score, approximately 20% of subjects in the severe group had scores of 18 or lower (better), compared with approximately 45% and 70% in the moderate and mild pain groups, respectively.
Figure 2 Cumulative frequency distribution by average pain severity for (A) nine-item painDETECT scores and (B) seven-item painDETECT scores.
Scale-level reliability
Across all subjects and pain-severity categories, corrected item-to-total correlations showed discernible and sizable amounts of item discrimination for all items on the seven-item version, which ranged from 0.49 for “slight pressure triggers pain” to 0.62 for “light touching painful” (). The same set of items on the nine-item version was equally discriminating, as indicated by similar values for the corrected item-to-total correlation (). However, the two additional items showed low or no discrimination (pain radiation, 0.21; pain course, −0.08). Despite having two fewer items, the seven-item version gave a slightly higher Cronbach’s alpha (0.80) than the nine-item version (0.76).
Table 3 Corrected item-to-total correlations for the nine- and seven-item painDETECT
Discussion
This study compellingly demonstrated the psychometric validity and reliability of painDETECT for distinguishing mild, moderate, and severe levels of average pain in subjects with NeP, with pain severity rated using the average pain item from the BPI-SF. Specifically developed screening instruments, such as painDETECT, have been shown to be useful in identifying the likelihood that pain is of neuropathic origin.Citation11 Although there is a need for characterizing and quantifying NeP concurrently with its identification in patients with various NeP conditions, to our knowledge, no other NeP instrument has yet been specifically validated for distinguishing between levels of average pain severity. These results therefore complement and extend studies that have suggested that NeP-screening instruments may help distinguish among sensory symptom profiles and pain-severity levels.Citation16,Citation17,Citation25–Citation27
Both the seven-item and nine-item scores of painDETECT provided good discrimination (known-group validity) of average pain severity, with significant differentiation (P<0.0001) for all pair-wise comparisons between mild, moderate, and severe pain. The extent of the separation was substantial based on estimation of standardized effect sizes: medium magnitude for mild versus moderate pain and for moderate versus severe pain, and large magnitude for mild versus severe pain. Although it can be expected that a similar set of results would apply to the similarly phrased BPI-SF questions on worst pain, least pain, and current pain, further research would be needed for their confirmation.
These findings, while new and clinically relevant, are not entirely unexpected, given the previously observed relationship between painDETECT and pain severity. The initial painDETECT-validation study reported a significant association (P<0.001) between pain severity (average over the past 4 weeks) and painDETECT scores,Citation15 and other studies have confirmed that higher painDETECT scores were significantly associated with greater average pain severity over the previous 4 weeks (P<0.05).Citation16,Citation17 However, those studies evaluated the relationship within the framework of the painDETECT cutoff values for differentiating NeP from nociceptive pain. In contrast, the current study started with a large and varied NeP population, and quantified both unadjusted and adjusted mean painDETECT values based on pain-severity levels.
Two previous studies have also suggested that pain-symptom descriptors may be significant predictors of NeP severity.Citation28,Citation29 In those studies, the presence of a higher number of descriptors, as well as specific descriptor qualities, had greater predictive value for more severe pain.Citation28,Citation29 The range of descriptors constituting painDETECT overlaps with those descriptors that have shown predictive ability for pain severity. Taken in context, the current results confirm and supplement the relevance of using descriptors for characterizing NeP, including for quantifying severity, and provide reassuring evidence that the observed results enhance the clinical usefulness of painDETECT in ways not previously validated.
Both the seven-item version and the nine-item version demonstrated internal consistency reliability that was acceptable (above 0.70). However, the seven-item version resulted in a slightly higher reliability (Cronbach’s α=0.80) than the nine-item version (Cronbach’s α=0.76) and more consistent item-level discrimination. The reliability of the seven-item version is not only similar to that reported in the validation study (Cronbach’s α=0.83),Citation15 but its higher value than the nine-item version is also in concordance with previous observations,Citation27 suggesting that the two nonsensory items are not psychometrically compatible with the sensory items. While further confirmation for the greater reliability of the seven-item version is needed, it can nevertheless be recommended that the seven sensory items be used together; the two nonsensory items, on temporal and spatial characterization of the pain pattern, that are included in the nine-item version can be analyzed and interpreted separately.
It should also be noted that since the population in the current study consisted of patients with confirmed NeP, the cumulative distribution curves are in marked contrast to those in studies evaluating discrimination between main pain subtypes (nociceptive, pure neuropathic, mixed) where the nociceptive group clearly resulted in lower (more favorable) scores on painDETECT.Citation15,Citation27 In addition, in the current study, the cumulative distributions convincingly showed that painDETECT scores were dependent on the degree of average pain severity for patients with confirmed NeP; fitting only one curve for all patients with NeP (ie, without regard to average pain severity), as has been done previously,Citation15,Citation27 would mask this finding.
At least two possible limitations of this research should be noted. One is that the study was cross-sectional rather than longitudinal. The opportunity to link changes in painDETECT scores to changes in average pain severity was not available. However, painDETECT has generally been used as a screening tool at a single time point, since its responsiveness to change over time or with treatment has not been adequately evaluated.
The second limitation is that this study could be potentially criticized for evaluation of a population that included different NeP conditions, since it can be argued that there may be differences among the conditions resulting from their various etiologies. However, it has been reported that there appear to be greater similarities than differences overall with regard to NeP regardless of etiology.Citation25,Citation26
Furthermore, a recent study suggested that there may be up to four distinct pain-characteristic profiles that are independent of etiology.Citation26 Therefore, since the scoring of painDETECT is based on an amalgam of frequency and severity for relevant individual sensory symptoms, severity discrimination will likely be maintained even across the different sensory symptom profiles, supporting a robust ability of painDETECT to both identify NeP and profile its sensitivity with respect to average pain regardless of the etiology or sensory profile. It could be argued that the wide range of average pain severity and NeP across etiologies is intended to foster a diverse and expansive base of patients that resounds in drawing stronger psychometric results and inferences to patients with NeP regardless of etiology.
Conclusion
This study provides strong psychometric evidence on the validity of painDETECT for distinguishing scores on NeP based on scores of average pain severity for patients with NeP. Therefore, the ability of painDETECT to discriminate among mild, moderate, and severe levels of average pain further supports the measurement properties and clinical relevance of this instrument for identifying and characterizing NeP. The nine-item and seven-item versions of painDETECT also show satisfactory reliability, but the higher reliability of the seven-item version suggests it may be more prudent to use this version, with the two nonsensory items used separately to further characterize NeP. Additional investigation of the psychometric properties of painDETECT and other NeP-screening instruments are warranted, since more comprehensive characterization of NeP at screening can inform management strategies that may help improve outcomes and reduce the disease burden.
Disclosure
This study was funded by Pfizer. Joseph C Cappelleri and Alesia Sadosky are employees and shareholders of Pfizer, the sponsor of this study; Vijaya Koduru is an employee of the Eliassen Group, who were paid consultants to Pfizer in connection with the analysis described in this study; E Jay Bienen is an independent scientific consultant who was funded by Pfizer in connection with manuscript development.
References
- International Association for the Study of PainIASP taxonomy2012 Available from: https://www.iasp-pain.org/Education/Content.aspx?ItemNumber=1698Accessed April 5, 2014
- van HeckeOAustinSKKhanRASmithBHTorranceNNeuropathic pain in the general population: a systematic review of epidemiological studiesPain2014155465466224291734
- Taylor-StokesGPikeJSadoskyAChandranAToelleTAssociation of patient-rated severity with other outcomes in patients with painful diabetic peripheral neuropathyDiabetes Metab Syndr Obes2011440140822253538
- SadoskyASchaeferCMannRBurden of illness associated with painful diabetic peripheral neuropathy among adults seeking treatment in the US: results from a retrospective chart review and cross-sectional surveyDiabetes Metab Syndr Obes20136799223403729
- ParsonsBSchaeferCMannREconomic and humanistic burden of post-trauma and post-surgical neuropathic pain among adults in the United StatesJ Pain Res2013645946923825931
- MannRSchaeferCSadoskyABurden of spinal cord injury-related neuropathic pain in the United States: retrospective chart review and cross-sectional surveySpinal Cord201351756457023588572
- SchaeferCMannRSadoskyAHealth status, function, productivity, and costs among individuals with idiopathic painful peripheral neuropathy with small fiber involvement in the United States: results from a retrospective chart review and cross-sectional surveyJ Med Econ201417639440724673364
- DworkinRHO’ConnorABKentJInterventional management of neuropathic pain: NeuPSIG recommendationsPain2013154112249226123748119
- DworkinRHO’ConnorABAudetteJRecommendations for the pharmacological management of neuropathic pain: an overview and literature updateMayo Clin Proc201085Suppl 3S3S1420194146
- AttalNCruccuGBaronREFNS guidelines on the pharmacological treatment of neuropathic pain: 2010 revisionEur J Neurol20101791113112320402746
- BennettMIAttalNBackonjaMMUsing screening tools to identify neuropathic painPain2007127319920317182186
- BouhassiraDAttalNAlchaarHComparison of pain syndromes associated with nervous or somatic lesions and development of a new neuropathic pain diagnostic questionnaire (DN4)Pain20051141–2293615733628
- BennettMThe LANSS Pain Scale: the Leeds assessment of neuropathic symptoms and signsPain2001921–214715711323136
- BennettMISmithBHTorranceNPotterJThe S-LANSS Score for identifying pain of predominantly neuropathic origin: validation for use in clinical and postal researchJ Pain20056314915815772908
- FreynhagenRBaronRGockelUTölleTRpainDETECT: a new screening questionnaire to identify neuropathic components in patients with back painCurr Med Res Opin200622101911192017022849
- OhtoriSOritaSYamashitaMExistence of a neuropathic pain component in patients with osteoarthritis of the kneeYonsei Med J201253480180522665349
- EliasLAYilmazZSmithJGPainDETECT: a suitable screening tool for neuropathic pain in patients with painful post-traumatic trigeminal nerve injuries?Int J Oral Maxillofac Surg201443112012623928156
- MannRBergstromFSchaeferCCharacteristics of subjects with human immunodeficiency virus-related neuropathic pain in the United States: BEAT Neuropathic Pain Observational StudyPoster presented at: American Society of Regional Anesthesia and Pain Medicine 11th Annual Pain Medicine MeetingNovember 15–18, 2012Miami, FL
- SadoskyASchaeferCParsonsBCharacteristics of subjects with chronic low back pain-related neuropathic pain (CLBP-NeP) in the US: BEAT Neuropathic pain observational study [abstract]Ann Neurol201272Suppl117
- CleelandCSRyanKMPain assessment: global use of the Brief Pain InventoryAnn Acad Med Singapore19942321291388080219
- ZelmanDDukesEBrandenburgNBostromAGoreMIdentification of cut-points for mild, moderate and severe pain due to diabetic peripheral neuropathyPain20051152293615836967
- CappelleriJCZouKHBushmakinAGAlvirJMAlemayehuDSymondsTPatient-Reported Outcomes: Measurement, Implementation and InterpretationBoca Raton (FL)Chapman and Hall/CRC2014
- CohenJStatistical Power Analysis for the Behavioral Sciences2nd edHillsdale (NJ)Lawrence Erlbaum Associates1988
- GibbonsJCChakrabortiSNonparametric Statistical Inference5th edBoca Raton (FL)Chapman and Hall/CRC2011
- BaronRForsterMBinderASubgrouping of patients with neuropathic pain according to pain-related sensory abnormalities: a first step to a stratified treatment approachLancet Neurol20121111999100523079556
- FreemanRBaronRBouhassiraDCabreraJEmirBSensory profiles of patients with neuropathic pain based on the neuropathic pain symptoms and signsPain2014155236737624472518
- De AndrésJPérez-CajaravilleJLopez-AlarcónMDCultural adaptation and validation of the painDETECT scale into SpanishClin J Pain201228324325321926908
- BackonjaMMStaceyBNeuropathic pain symptoms relative to overall pain ratingJ Pain20045949149715556827
- ButlerSJonzonBBranting-EkenbackCWadellCFarahmandBPredictors of severe pain in a cohort of 5271 individuals with self-reported neuropathic painPain2013154114114623140908