
 ?Mathematical formulae have been encoded as MathML and are displayed in this HTML version using MathJax in order to improve their display. Uncheck the box to turn MathJax off. This feature requires Javascript. Click on a formula to zoom.
Abstract
Background
Ranibizumab and aflibercept are alternative anti-vascular endothelial growth factor agents approved for the treatment of visual impairment (VI) due to diabetic macular edema (DME).
Objective
To estimate, from a UK healthcare perspective, the cost-effectiveness of ranibizumab 0.5 mg pro re nata (PRN) and ranibizumab 0.5 mg treat and extend (T&E) compared with aflibercept 2 mg every 8 weeks after five initial monthly doses (2q8) in the treatment of VI due to DME.
Methods
A Markov model previously reviewed by the National Institute for Health and Care Excellence was used to simulate the long-term outcomes and costs of treating DME. Health states were defined by increments of ten letters in best-corrected visual acuity (BCVA), with a 3-month cycle length. Patients could gain (or lose) a maximum of two health states between cycles. A 3-year treatment time frame and a lifetime horizon were used. Future costs and health outcomes were discounted at 3.5% per annum. Patient baseline characteristics and the efficacy of ranibizumab PRN were derived using data from the RESTORE study. The relative efficacies of ranibizumab PRN, ranibizumab T&E, and aflibercept were assessed with a network meta-analysis. Different utilities were assigned based on BCVA and whether the treated eye was the better- or the worse-seeing eye. Sensitivity analyses tested the robustness of the model.
Results
Lifetime costs per patient of treating DME were £20,019 for ranibizumab PRN, £22,930 for ranibizumab T&E, and £25,859 for aflibercept 2q8. Ranibizumab was dominant over aflibercept, with an incremental gain of 0.05 quality-adjusted life-years (QALYs) and cost savings of £5,841 (PRN) and £2,930 (T&E) compared with aflibercept. Ranibizumab PRN and ranibizumab T&E had 79% and 67% probability, respectively, of being cost-effective relative to aflibercept at a willingness-to-pay threshold of £20,000/QALY. When assuming the higher end of PRN injection frequency (15.9 over 3 years), the cost savings associated with ranibizumab were £3,969.
Conclusion
From a UK healthcare perspective, ranibizumab provides greater health gains with lower overall costs than aflibercept in patients with VI due to DME.
Introduction
Diabetic macular edema (DME) is the leading cause of blindness in patients with diabetic retinopathy.Citation1 It is characterized by vascular leakage, tissue edema, and the deposition of hard exudates in the central retina.Citation2–Citation4 With regard to the socioeconomic burden of the disease, DME can lead to visual impairment (VI) with consequent reduction in quality of life,Citation5–Citation7 and patients with DME consume significantly more healthcare resources than diabetic patients without retinal complications.Citation8 The Pan-European Prevalence Assessment of Diabetic Macular Edema with Visual Impairment (PREVAIL) study reported an overall prevalence (among diabetic patients) of DME of 5.4%, with a prevalence of VI due to DME of 1.9%.Citation9 Given that the prevalence of diabetes mellitus has already reached epidemic proportions worldwide, and is projected to increase further over the next 20 years,Citation10 it is expected that VI due to DME will continue to be a significant public health problem for the foreseeable future.
The etiology of DME is complex and has not been fully elucidated. Chronic hyperglycemia, the accumulation of oxygen free radicals and advanced glycation end products, and high cholesterol levels have all been implicated as risk factors for the development of DME.Citation11 However, the breakdown of the blood−retinal barrier (BRB) has been recognized as a defining event in the disease process.Citation12 In addition, vascular endothelial growth factor (VEGF)-A has been identified as a key vascular permeability factor that contributes to neovascularization and BRB dysfunction,Citation13 making it an attractive target for pharmaceutical intervention.
Ranibizumab is a monoclonal anti-VEGF-A antibody fragment administered by intravitreal injection. The results of the RIDE and RISE studies, two randomized, multicenter, phase 3 trials, showed that ranibizumab improved visual acuity and retinal anatomy in patients with DME when compared with sham injections.Citation14,Citation15 In the RIDE study, 19.2% of patients in the sham injection group gained at least 15 letters, compared with 36.8% of patients in the ranibizumab 0.3 mg group (P<0.0001) and 40.2% of patients in the ranibizumab 0.5 mg group (P<0.001). In RISE, the proportions were 22.0%, 51.2%, and 41.6%, respectively. In the phase 3 RESTORE study, ranibizumab monotherapy and ranibizumab combined with laser therapy provided greater gains in visual acuity than standard laser treatment in patients with VI due to DME.Citation16
Based on these results, ranibizumab became the first drug to receive approval from the European Medicines Agency (EMA) for the treatment of VI due to DME.Citation17 A second anti-VEGF agent, aflibercept, recently received EMA approval for the treatment of VI due to DMECitation18 based on results from two phase 3 trials, the VEGF Trap-Eye in Vision Impairment Due to DME (VIVID-DME) study and the study of Intravitreal Administration of VEGF Trap-Eye in Patients with DME (VISTA-DME), which demonstrated significant (P<0.0001) superiority in functional and anatomic endpoints over laser therapy.Citation19
Given the substantial socioeconomic burden of VI due to DME, it is important to evaluate the cost-effectiveness of novel therapies for this condition. The objective of this study was to compare, from a UK healthcare perspective, the cost-effectiveness of ranibizumab 0.5 mg pro re nata (PRN) and ranibizumab 0.5 mg treat and extend (T&E) with 2 mg aflibercept every 8 weeks after five initial monthly doses (2q8).
Methods
Model structure
A Markov decision-analytical model that was submitted to the UK National Institute for Health and Care Excellence (NICE) was updated and revised to predict the long-term costs and health outcomes of ranibizumab treatment for VI due to DME.Citation20,Citation21 The model submitted to NICE was populated using data from the RESTORE study.Citation16 The model followed a cohort of patients whose baseline characteristics were derived from those of patients in the RESTORE study,Citation16 in which 66% of individuals had a baseline best-corrected visual acuity (BCVA) between 56 and 75 letters (). As per the RESTORE population, it was assumed that 60% of patients were treated in their worse-seeing eye (WSE), 18% were treated in their better-seeing eye (BSE), and 22% were treated in both eyes (ie, in both BSE and WSE). In the Markov model, patients cycled between eight health states, defined by BCVA intervals ranging from ≤25 letters to 86–100 letters in the treated eye, and a ninth, absorbing, “death” state (). illustrates that patients could move up or down a maximum of two health states within each cycle (3 months) over a lifetime horizon. The lifetime horizon is defined as the time period over which the cost and benefits of the 3-year treatment is evaluated. A half-cycle correction was applied to each cycle.
Figure 1 Markov model structure showing health states and possible patient transitions between states.
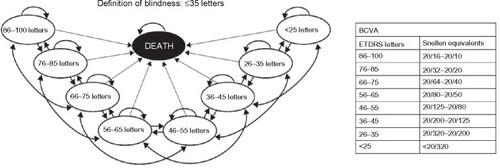
Table 1 Baseline ocular characteristics of patients followed in the model
The timeframe of anti-VEGF treatments was assumed to be 3 years. In the first, second, and third year, transition probabilities (TPs) were calculated for ranibizumab 0.5 mg PRN using the full analysis set with 3 years of data from the RESTORE study. From year 4 onward, patients were assumed to not receive any ranibizumab or aflibercept treatment, and TPs were calculated using data from the Wisconsin Epidemiologic Study of Diabetic Retinopathy (WESDR)Citation22,Citation23 to capture the natural decline in BCVA without treatment. As there are no published head-to-head trials comparing the efficacy of ranibizumab and aflibercept, the first-year TPs for aflibercept-treated patients gaining ten or more letters (ie, one or two health states) were calculated using data from a published network meta-analysis.Citation24 In this analysis of eight randomized clinical trials, the efficacy of ranibizumab PRN, as measured by the percentage of patients who gained at least ten letters, was numerically superior to aflibercept (odds ratio [OR], 1.59; 95% credible interval [CrI], 0.61–5.37). The analysis adjusted for different baseline BCVAs across clinical trials. The percentages of patients losing ten or more letters between two cycles were assumed to be the same in the aflibercept and ranibizumab PRN groups. This assumption was justified by the low number of patients in the VIVID-DME, VISTA-DME,Citation19 and RESTORECitation16 clinical trials who lost significant vision (one patient in the aflibercept 2q8 arms in VIVID-DME and VISTA-DME, and one patient in the ranibizumab 0.5 mg PRN arm in RESTORE lost 15 or more letters). From year 1 onward, the same TPs were assumed for aflibercept and ranibizumab PRN because no meta-analysis was available after year 1. To assess the sensitivity of the results to this assumption, we also assumed, in the sensitivity analysis, a treatment timeframe of 1 year followed by natural decline in BCVA without treatment.Citation22,Citation23 The calculations of aflibercept TPs are sum-marized in .
For the ranibizumab 0.5 mg T&E regimen, the previously published network meta-analysis was updated by adding the results from the RETAIN studyCitation25 to the network. The primary objective of RETAIN was to demonstrate non-inferiority, measured by mean change from baseline in BCVA over a 12-month treatment period, of either ranibizumab 0.5 mg T&E or the combination of ranibizumab T&E and laser versus ranibizumab 0.5 mg PRN. In the study, a patient receiving the T&E regimen (and PRN regimen) received monthly injections of ranibizumab 0.5 mg until BCVA was stabilized (with a minimum of three initial monthly injections). At the visit at which stabilization was confirmed, the patient received no treatment. The first T&E visit followed 1 month after the visit at which stabilization was confirmed. If there was no loss of BCVA that could be attributed to DME, the treatment-free period was increased by one more month. The maximal time between injection visits was 3 months. If visual acuity decreased due to DME, the patient resumed monthly treatment and BCVA stability was required before re-entering the extension treatment phase. An approach similar to that used for aflibercept was used to calculate TPs for the ranibizumab T&E regimen.
Utilities
Utilities for each health state were assigned based on BCVA and whether the treated eye was the BSE or WSE, as defined by Bressler et al.Citation26 The assumptions made in calculating utilities were based on the 2013 ranibizumab for DME appraisal by NICE.Citation21 Data from Czoski-Murray et alCitation27 were used for the BSE, with a utility range of 0.497 between best and worst possible states; for the WSE, a utility decrement of 0.1 was assumed between the best and worst possible states. The mapping between utilities, BSE/WSE, and BCVA is presented in . Consistent with the NICE assessment of aflibercept in neovascular age-related macular degeneration, it was assumed that the rate of adverse events (AEs) for ranibizumab and aflibercept was equal.Citation28 This assumption is reviewed in the “Discussion” section.
Table 2 Utilities used by BCVA level and eye status
Resource use
Ranibizumab and aflibercept treatment and monitoring frequencies are summarized in . Ranibizumab PRN treatment frequencies in years 1, 2, and 3 (and monitoring frequencies in year 1) were taken from the RESTORE study.Citation16 Ranibizumab monitoring frequencies in years 2 and 3 were obtained from the Diabetic Retinopathy Clinical Research Network (DRCR.net) study.Citation29 The rationale for using the monitoring data from DRCR.net instead of RESTORE is that the RESTORE protocol used monthly monitoring, which is no longer required by the updated European label.Citation30 The impact of assuming monthly monitoring rather than monitoring as per the DRCR.net study was assessed and presented in the sensitivity analyses. Aflibercept treatment frequencies in year 1 were the mean frequencies in VIVID-DME and VISTA-DME.Citation19 Mean treatment frequencies in year 2 were calculated using the VISTA-DME study.Citation19 To our best knowledge, the mean frequency in year 2 of the VIVID-DME study was not published at the time this manuscript was written. Ranibizumab T&E injection frequency was taken from RETAIN.Citation25 Aflibercept and ranibizumab T&E treatment frequency in year 3 was assumed to be the same as in year 2 because no clinical data were available at the time of the analysis. No additional monitoring visits were assumed for aflibercept and ranibizumab T&E.
Table 3 Key model inputs for the base-case scenario
Costs
The model estimated the costs and clinical benefits of ranibizumab and aflibercept treatment from the perspective of the UK National Health Service. Future costs and health outcomes were discounted at 3.5% per annum, according to the NICE reference case. The costs used in this analysis are summarized in . The cost of blindness was associated with individuals whose BCVA was less than 35 letters ().
Table 4 Key treatment cost assumptions
Economic analysis
The incremental cost-effectiveness ratio (ICER) was calculated as the ratio of the mean incremental cost and the mean number of incremental quality-adjusted life-years (QALYs) for ranibizumab regimens compared with aflibercept. Net monetary benefit (NMB) was calculated assuming a willingness to pay £20,000/QALY.Citation32 The NMB is equal to the sum of cost savings (or incremental costs) plus QALY gains multiplied by £20,000. A higher NMB indicates greater value: an NMB greater than £0 is equivalent to an ICER <£20,000/QALY. Thus, in the context of this analysis, cost-effective is defined as meeting the accepted standards of cost-effectiveness based on a willingness-to-pay threshold of £20,000/QALY.
Sensitivity analyses
Deterministic sensitivity analysis was used to explore uncertainty around individual input values to the model, and the effect on the resultant NMB was calculated. In particular, since net drug prices are not publicly available, the impact of a price discount was analyzed. Probabilistic sensitivity analysis (PSA) (1,000 iterations) was used to model joint parameter uncertainty, enabling cost-effectiveness acceptability curves (CEACs) to be calculated. The probability distributions chosen for the PSA were based on those recommended for health economic analysis.Citation33 Standard errors of aflibercept injections were not known in year 2 and year 3, and the same standard deviation as ranibizumab PRN was assumed. The variables with varying values in the PSA are included in .
Results
Health outcomes
Based on the published (PRN) and updated network meta-analysis (T&E), the ranibizumab 0.5 mg PRN and ranibizumab 0.5 mg T&E regimens were both numerically favored over aflibercept 2q8 in terms of the percentage of patients who gained at least ten letters in BCVA: OR, 1.59 (95% CrI, 0.61–5.37) and OR, 1.65 (95% CrI, 0.38–8.94), respectively.
Base case
Ranibizumab PRN and T&E regimens were associated with a QALY gain per patient of 0.05 over aflibercept (). Lifetime costs per patient were substantially lower for ranibizumab PRN (−£5,841) and ranibizumab T&E (−£2,930) than for aflibercept. Ranibizumab led to greater health gains at lower cost and was therefore dominant over aflibercept. The NMB was £6,768 for ranibizumab PRN and £3,934 for ranibizumab T&E at a willingness-to-pay threshold of £20,000/QALY (). The main drivers of the base-case results were the greater number of aflibercept injections required compared with ranibizumab injections, the higher efficacy assumptions of ranibizumab (PRN and T&E) relative to aflibercept, and higher costs associated with aflibercept compared with ranibizumab regimens.
Table 5 Base-case cost-effectiveness results per patient
Sensitivity analyses
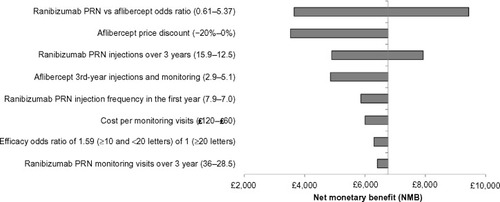
Deterministic sensitivity analysis showed that the results were robust to variations in key model parameters (). The parameter with the most impact was the OR for the percentage of patients gaining ten or more letters. However, even by using the lower end of the CrI from the network meta-analysis (0.61), the NMB of ranibizumab PRN was positive (£3,592). Similarly, the NMB was positive even if the higher end of the 95% confidence interval (CI) of the injection frequency (15.9 injections over 3 years) was assumed for ranibizumab PRN (£4,897) representing a cost saving of £3,969. Under the assumption that the price of aflibercept was 20% lower than assumed in the base case (ie, £653 vs £742/dose for ranibizumab), ranibizumab PRN still provided a positive NMB compared with aflibercept bimonthly (£3,530). Ranibizumab PRN remained dominant when a higher number of PRN injections were assumed: eg, 7.9 instead of 7.0 injections resulted in an NMB of £5,863 in the first year (). Using monthly monitoring instead of DRCR.netCitation29 monitoring assumptions for ranibizumab PRN, changing the cost of monitoring visits, and changing the aflibercept injection frequency in the third year (post-VISTA-DME results) all had limited impact on the results. Specifically, monthly monitoring decreased the NMB of ranibizumab PRN by £354, while doubling the monitoring costs reduced the NMB of ranibizumab PRN by £764.
Figure 2 Tornado plots of one-way sensitivity analyses for ranibizumab 0.5 mg PRN compared with aflibercept 2q8.
Assumptions used to determine the input range for the tornado plot: Ranibizumab PRN versus aflibercept OR values are based on the 95% CrI from the published network meta-analysis.Citation24 The range in the number of ranibizumab PRN injections over 3 years was based on the 95% confidence interval from the RESTORE 36-month data.Citation40 The range in the number of PRN injections in the first year was based on the weighted injection average across RESTORECitation16 and RESPOND.Citation41 The lower value for the number of aflibercept injections assumed the same injection frequency as the ranibizumab PRN regimen. Ranibizumab maximal monitoring frequency assumed monthly monitoring (as described in the RESTORE protocol).Citation16
Abbreviations: PRN, pro re nata; 2q8, 2 mg every 8 weeks after five initial monthly doses; NMB, net monetary benefit; CrI, credible interval.
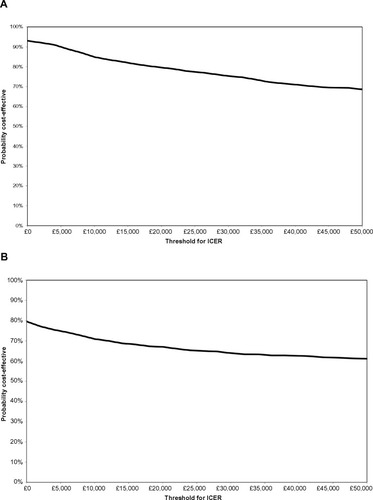
The PSA showed that ranibizumab PRN had a 79% probability () and ranibizumab T&E a 67% probability () of being cost-effective compared with aflibercept at a willingness-to-pay threshold of £20,000/QALY. There were no simulations in which ranibizumab PRN was found to be more effective and more costly than aflibercept (upper-right quadrant). In the PSA, we allowed the natural history curves after year 3 to be different for ranibizumab and aflibercept. If we impose the constraint that the curves should be the same, then ranibizumab PRN has a 99% probability of being cost-effective compared with aflibercept at a willingness-to-pay threshold of £20,000/QALY (result not shown). Ranibizumab PRN had a 74% probability of being cost-effective compared with aflibercept when 7.9 PRN injections instead of 7.0 were assumed in the first year. The CEACs comparing ranibizumab PRN and ranibizumab T&E with aflibercept are relatively flat ( and b, respectively), indicating that the cost-effectiveness conclusions are independent of the cost-effectiveness threshold. This is driven by the high proportion of simulations (65% in ) that are located in the bottom-right (always cost-effective) or upper-left (never cost-effective) quadrants, which are not impacted by the level of the cost-effectiveness threshold.
Figure 3 Scatter plots for probabilistic sensitivity analysis showing cost-effectiveness of (A) ranibizumab 0.5 mg PRN and (B) ranibizumab 0.5 mg T&E compared with aflibercept 2q8.
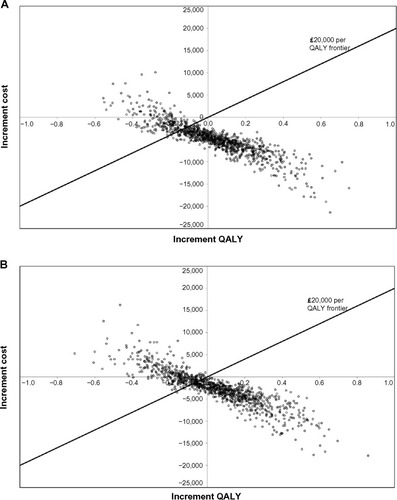
Figure 4 Cost-effectiveness acceptability curves for (A) ranibizumab 0.5 mg PRN and (B) ranibizumab 0.5 mg T&E compared with aflibercept 2q8.
When we assumed that ranibizumab 0.5 mg PRN and aflibercept 2q8 were only injected for 1 year (followed by natural progression of the disease), we also found that ranibizumab 0.5 mg PRN dominated aflibercept 2q8 (incremental QALY gained of 0.1 with incremental savings of £3,079 per patient). Approximately, two-third of the savings of £3,079 are generated by lower injection costs in the first year (1.54 less injections per eye or 1.9 less injections per patient with ranibizumab). Approximately, one-third of the savings are generated by lowering the number of blindness cases.
Discussion
To our knowledge, this is the first study to compare the cost-effectiveness of ranibizumab and aflibercept in the treatment of patients with VI due to DME. Our analyses showed that ranibizumab 0.5 mg PRN and ranibizumab 0.5 mg T&E (both licensed posologies) were both dominant over aflibercept 2q8, by demonstrating lower lifetime costs for UK healthcare providers as well as higher QALY gains for patients receiving ranibizumab than for those taking aflibercept. The main drivers of the results were the higher probability of gaining ten or more letters in BCVA with ranibizumab regimens compared with aflibercept 2q8,Citation24 the greater number of injections required, and higher costs associated with aflibercept compared with ranibizumab treatment. The results were demonstrated to be robust by a number of univariate sensitivity analyses. In particular, the results were robust to a number of assumptions relating to ranibizumab PRN injection frequency. Ranibizumab 0.5 mg PRN and ranibizumab 0.5 mg T&E are individualized dosing regimens based on BCVA stability and disease progression criteria.Citation16 Therefore, these results show the importance of an individualized regimen for the treatment of VI due to DME, because, on average, patients require fewer injections in the second and third years of treatment than in the first year.
Costs are mainly driven by injection frequencies and cost of blindness. Since the 95% CI for the number of injections is narrow, the uncertainty around the number of injections has a limited impact on the sensitivity results. Since higher BCVA leads to lower VI costs, the relationship between incremental costs and QALYs is downward sloping (). In other words, while numerous variables were included in the PSA (), the PSA results are mainly driven by TPs. For interventions that are more cost-effective than their comparators, CEACs from PSAs are typically upward sloping (ie, the higher the cost-effectiveness threshold, the higher the probability that a technology is cost-effective). This was not the case in this analysis because the only simulations impacted by a cost-effectiveness threshold were located in the bottom-left quadrant of the scatter plots (representing simulations in which ranibizumab was cheaper and less effective than aflibercept; ). In that quadrant, a higher cost-effectiveness threshold reduces the probability of being cost-effective.
A 0.05 QALY difference would yield a cost difference of £1,000 (assuming a cost per QALY gained of £20,000). Therefore, most of the NMB stems from cost reductions (including the cost of blindness) and not QALY gains. Real-world injection frequencies and net prices will be the key drivers of the real-world cost-effectiveness.
It was assumed that the frequency of AEs for ranibizumab and aflibercept was equal. However, in the VIVID-DME and VISTA-DME studies, five of 287 (1.7%) patients in the aflibercept 2q8 group experienced ocular serious AEs (SAEs),Citation19 whereas, in RESTORE, no ocular SAEs were reported in the first 12 months.Citation16 Therefore, this assumption may be conservative. A meaningful comparison of the incidence of other SAEs in VIVID-DME, VISTA-DME, and RESTORE is difficult, because VIVID-DME and VISTA-DME reported systemic SAEs while RESTORE reported non-ocular SAEs.
Sensitivity analyses demonstrated that the model was robust to reasonable variations in model parameters and assumptions. A notable finding was that ranibizumab was still cost saving compared with aflibercept if the price of aflibercept was assumed to be the same as that of ranibizumab. The sensitivity analyses also showed that the results held even if we assumed that ranibizumab and aflibercept were only administered for 1 year (ie, if we did not make assumptions on the relative efficacy of the treatments after year 1).
This analysis assessed the cost-effectiveness of ranibizumab and aflibercept using regimens pre-defined in clinical trials. However, in real-world practice, physicians may use different treatment regimens.Citation34,Citation35
A major limitation of this analysis is the lack of comparative efficacy data between ranibizumab 0.5 mg PRN and aflibercept 2q8 after year 1, due to the difficulties of updating the published network meta-analysis,Citation24 because half of the studies in the meta-analysis network did not report results after 1 year. Therefore, our model assumed an equivalent efficacy for ranibizumab and aflibercept after year 1. This assumption seems reasonable because, in VIVID-DME/VISTA-DME, the percentage of aflibercept 2q8 patients who gained ≥15 letters at year 2 was similar to the percentage of aflibercept 2q8 patients who gained ≥15 letters in year 1. The percentage of ranibizumab PRN patients who gained ≥15 letters was also similar in year 2 and year 1 (29% vs 26%, respectively).Citation16,Citation36 In addition, the rate of AEs with ranibizumab and aflibercept was assumed to be equal. This assumption is supported by a systematic review of the efficacy and safety of aflibercept, ranibizumab, and bevacizumab in neovascular age-related macular degeneration, which reported a similar frequency of SAEs for all three drugs.Citation37
While the VIVID/VISTA studies used a bimonthly aflibercept regimen in the second year, aflibercept has a T&E label in Europe.Citation38 We assumed 5.1 aflibercept injections in years 2 and 3 (as reported in VIVID/VISTA and in the ranibizumab T&E arm of RETAIN) but the lack of aflibercept injection data is a limitation of the current study.
A further limitation is that NICE recommends the use of ranibizumab 0.5 mg for the treatment of DME for eyes with a central retinal thickness of ≥400 μM at the start of treatment, whereas our analysis included the whole patient population. The reason for this was that the published clinical data did not provide subgroup analyses for patients with a central retinal thickness ≥400 μM. It should be noted that the analysis did not include bevacizumab, a full-length anti-VEGF-A antibody developed for the treatment of cancer that is not licensed for VI due to DME. This is consistent with NICE guidance, which indicates that there is currently no robust evidence with which to assess the clinical effectiveness or safety of bevacizumab in the treatment of DME.Citation21 Finally, the analysis did not include laser therapy because it has already been shown that ranibizumab provides superior visual acuity gain over standard laser treatment.Citation16
Conclusion
In this economic analysis from a UK healthcare perspective, ranibizumab 0.5 mg PRN and T&E regimens were dominant over aflibercept 2q8 for the treatment of VI due to DME. Ranibizumab therapy resulted in lower lifetime costs and higher QALY gains than treatment with aflibercept, indicating that ranibizumab should be viewed as the new standard of care for DME. Cost-effectiveness evidence of the type presented here is valuable for formulary decision making in the UK National Health Service.
Acknowledgments
The authors would like to thank Fernando Gibson, PhD, from PharmaGenesis™, London, UK, for editorial support in developing the manuscript. This project was funded by Novartis Pharma AG, Basel, Switzerland.
Supplementary materials
Table S1 Calculation of aflibercept transition probabilities
Table S2 Costs of visual impairment
Table S3 Key variables with varying value in the probability sensitivity analysis
Disclosure
Stephane Régnier is an employee of Novartis Pharma AG and William Malcolm is an employee of Novartis Pharmaceuticals UK Ltd; Jennifer Haig and Weiguang Xue are employees of Optum and received payment from Novartis Pharma AG for this work. The abstract of this paper was presented at the 2014 ISPOR conference in Amsterdam, the Netherlands, as a poster presentation with interim findings. The poster’s abstract was published in “Poster Abstracts” in the November 2014 issue of Value in Health. (http://www.valueinhealthjournal.com/article/S1098-3015(14)04062-5/pdf). The actual paper, however, has never been published.
References
- DingJWongTYCurrent epidemiology of diabetic retinopathy and diabetic macular edemaCurr Diab Rep201212434635422585044
- BosciaFCurrent approaches to the management of diabetic retinopathy and diabetic macular oedemaDrugs201070162171220020964459
- CheungNMitchellPWongTYDiabetic retinopathyLancet2010376973512413620580421
- CiullaTAAmadorAGZinmanBDiabetic retinopathy and diabetic macular edema: pathophysiology, screening, and novel therapiesDiabetes Care20032692653266412941734
- DavidovEBreitscheidelLClouthJReipsMHappichMDiabetic retinopathy and health-related quality of lifeGraefes Arch Clin Exp Ophthalmol2009247226727218925408
- LamoureuxELTaiESThumbooJImpact of diabetic retinopathy on vision-specific functionOphthalmology2010117475776520122736
- MatzaLSRousculpMDMalleyKBoyeKSOglesbyAThe longitudinal link between visual acuity and health-related quality of life in patients with diabetic retinopathyHealth Qual Life Outcomes200869518992161
- ChenELoomanMLaouriMBurden of illness of diabetic macular edema: literature reviewCurr Med Res Opin20102671587159720429823
- DelcourtCSivaprasadSBandelloFPrevalence of diabetic macular edema (DME) in Europe: the Pan European Prevalence Assessment of DME with Visual Impairment (PREVAIL) study Submitted
- ShawJESicreeRAZimmetPZGlobal estimates of the prevalence of diabetes for 2010 and 2030Diabetes Res Clin Pract201087141419896746
- BhagatNGrigorianRATutelaAZarbinMADiabetic macular edema: pathogenesis and treatmentSurv Ophthalmol200954113219171208
- KlaassenIVan NoordenCJSchlingemannROMolecular basis of the inner blood-retinal barrier and its breakdown in diabetic macular edema and other pathological conditionsProg Retin Eye Res201334194823416119
- ZhangXBaoSHamblyBDGilliesMCVascular endothelial growth factor-A: a multifunctional molecular player in diabetic retinopathyInt J Biochem Cell Biol200941122368237119646547
- NguyenQDBrownDMMarcusDMRISE RIDE Research GroupRanibizumab for diabetic macular edema: results from 2 phase III randomized trials: RISE and RIDEOphthalmology2012119478980122330964
- BrownDMNguyenQDMarcusDMRISE RIDE Research GroupLong-term outcomes of ranibizumab therapy for diabetic macular edema: the 36-month results from two phase III trials: RISE and RIDEOphthalmology2013120102013202223706949
- MitchellPBandelloFSchmidt-ErfurthURESTORE Study GroupThe RESTORE study: ranibizumab monotherapy or combined with laser versus laser monotherapy for diabetic macular edemaOphthalmology2011118461562521459215
- European Medicines AgencyAssessment Report for Lucentis (Ranibizumab). EMA/13901/20112010 Available from: http://www.ema.europa.eu/docs/en_GB/document_library/EPAR_-_Assessment_Report_-_Variation/human/000715/WC500101009.pdfAccessed October 7, 2014
- European Medicines AgencyAssessment Report for Eylea (Aflibercept). EMA/430291/20142014 Available from: http://www.ema.europa.eu/docs/en_GB/document_library/EPAR_-_Assessment_Report_-_Variation/human/002392/WC500172846.pdfAccessed October 7, 2014
- KorobelnikJFDoDVSchmidt-ErfurthUIntravitreal aflibercept for diabetic macular edemaOphthalmology2014121112247225425012934
- MitchellPAnnemansLGallagherMCost-effectiveness of ranibizumab in treatment of diabetic macular oedema (DME) causing visual impairment: evidence from the RESTORE trialBr J Ophthalmol201296568869322399690
- National Institute for Health and Care ExcellenceRanibizumab for Treating Diabetic Macular Oedema (Rapid Review of Technology Appraisal Guidance 237) [TA274]2013 Available from: http://www.nice.org.uk/guidance/ta274Accessed October 7, 2014
- KleinRKleinBEMossSEDeMetsDLKaufmanIVossPSPrevalence of diabetes mellitus in southern WisconsinAm J Epidemiol1984119154616691336
- KleinRKleinBEMossSEDavisMDDeMetsDLThe Wisconsin epidemiologic study of diabetic retinopathy. II. Prevalence and risk of diabetic retinopathy when age at diagnosis is less than 30 yearsArch Ophthalmol198410245205266367724
- RegnierSMalcolmWAllenFWrightJBezlyakVEfficacy of anti-VEGF and laser photocoagulation in the treatment of visual impairment due to diabetic macular edema: a systematic review and network meta-analysisPLoS One201497e10230925029255
- PruenteCGroupRSEfficacy and safety of ranibizumab in two treat-and-extend versus pro-re-nata regimes in patients with visual impairment due to diabetic macular edema: 24-month results of RETAIN studyInvest Ophthalmol Vis Sci201455 E-Abstract 1700
- BresslerNMChangTSSuñerIJMARINA and ANCHOR Research GroupsVision-related function after ranibizumab treatment by better- or worse-seeing eye: clinical trial results from MARINA and ANCHOROphthalmology20101174747.e756.e20189654
- Czoski-MurrayCCarltonJBrazierJYoungTPapoNLKangHKValuing condition-specific health states using simulation contact lensesValue Health200912579379919490557
- National Institute for Health and Care ExcellenceAflibercept Solution for Injection for Treating Wet Age-Related Macular Degeneration [TA294]2013 Available from: http://www.nice.org.uk/guidance/ta294Accessed October 7, 2014
- ElmanMJQinHAielloLPBeckRWIntravitreal ranibizumab for diabetic macular edema with prompt versus deferred laser treatment: three-year randomized trial resultsOphthalmology2012119112312231822999634
- European Medicines AgencyLucentis: EPAR – Product Information2014 Available from: http://www.ema.europa.eu/docs/en_GB/document_library/EPAR_-_Product_Information/human/000715/WC500043546.pdfAccessed March 4, 2015
- CampochiaroPASophieRPearlmanJRETAIN Study GroupLong-term outcomes in patients with retinal vein occlusion treated with ranibizumab: the RETAIN studyOphthalmology2014121120921924112944
- ClaxtonKMartinSSoaresMMethods for the Estimation of the NICE Cost Effectiveness ThresholdNew YorkUniversity of York, Centre for Health Economics2013
- BriggsAClaxtonKSculpherMDecision Modelling for Health Economic EvaluationOxfordOxford University Press2006
- JusufbegovicDMugavinMOSchaalSEvolution of controlling diabetic retinopathy: changing trends in the management of diabetic macular edema at a single institution over the past decadeRetina Epub1142015
- PetrellaRJBlouinJDaviesBBarbeauMPrevalence, demographics, and treatment characteristics of visual impairment due to diabetic macular edema in a representative Canadian cohortJ Ophthalmol2012201215916723304447
- LangGEBertaAEldemBMRESTORE Extension Study GroupTwo-year safety and efficacy of ranibizumab 0.5 mg in diabetic macular edema: interim analysis of the RESTORE extension studyOphthalmology2013120102004201223725735
- SchmidMKBachmannLMFäsLKesselsAGJobOMThielMAEfficacy and adverse events of aflibercept, ranibizumab and bevacizumab in age-related macular degeneration: a trade-off analysisBr J Ophthalmol201599214114625271911
- European Medicines AgencyEylea: EPAR – Product Information2014 Available from: http://www.ema.europa.eu/docs/en_GB/document_library/EPAR_-_Product_Information/human/002392/WC500135815.pdfAccessed March 5, 2014
- Early Treatment Diabetic Retinopathy Study Research GroupTreatment techniques and clinical guidelines for photocoagulation of diabetic macular edema. Early Treatment Diabetic Retinopathy Study Report Number 2Ophthalmology19879477617743658348
- Schmidt-ErfurthULangGEHolzFGRESTORE Extension Study GroupThree-year outcomes of individualized ranibizumab treatment in patients with diabetic macular edema: the RESTORE extension studyOphthalmology201412151045105324491642
- Efficacy and safety of ranibizumab monotherapy or combined with laser versus laser monotherapy in diabetic macular edema: the RESPOND studyCan J Ophthalmol2015In press
- BakshiNKUpdate on the VIVID-DME and VISTA-DME trialsOphthalmol Sci Update2014 Available from: http://www.ophthalmologyupdate.ca/crus/230-015%206-pages%20English.pdfAccessed October 15, 2014
- UK Department of Health2011–2012 NHS Reference Costs2014 Available from: https://www.gov.uk/government/publications/nhs-reference-costs-financial-year-2011-to-2012Accessed October 7, 2014
- ShyangdanDCumminsELoisNRoylePWaughNDexamethasone Implants in the Treatment of Macular Oedema Due to Retinal Vein Occlusion: A Single Technology AppraisalAberdeen Health Technology Assessment Group 20102014 Available from: http://www.nice.org.uk/nicemedia/live/13037/52883/52883.pdfAccessed October 7, 2014
- Hospital and Community Health ServicesHCHS Pay and Prices Series 2010–20112014 Available from: http://www.info.doh.gov.uk/doh/finman.nsf/af3d43e36a4c8f8500256722005b77f8/276315c0677bf5478025796b00418a4d?OpenDocumentAccessed October 16, 2014
- Personal Social Services Research UnitUnit Costs of Health and Social Care 20112014 Available from: http://www.pssru.ac.uk/project-pages/unit-costs/2011/Accessed October 7, 2014
- Personal Social Services Research UnitUnit Costs of Health and Social Care 20032014 Available from: http://www.pssru.ac.uk/project-pages/unit-costs/2003/Accessed October 7, 2014
- McCronePDhanasiriSPatelAKnappMLawton-SmithSPaying the Price (2008): the Cost of Mental Health Care in England to 20262014 Available from: http://www.kingsfund.org.uk/publications/paying-priceAccessed October 7, 2014
- ApplebyJPoteliakhoffEShahKDevlinNUsing patient-reported outcome measures to estimate cost-effectiveness of hip replacements in English hospitalsJ R Soc Med2013106832333123759892