
 ?Mathematical formulae have been encoded as MathML and are displayed in this HTML version using MathJax in order to improve their display. Uncheck the box to turn MathJax off. This feature requires Javascript. Click on a formula to zoom.
Abstract
Background
Several biologic medicines are available to treat rheumatoid arthritis (RA), and they differ in administration method (subcutaneous or intravenous [IV]). We analyzed a pharmacy benefit manager database to estimate claims-based, algorithm-determined effectiveness and cost per effectively treated patient for biologics used to treat RA.
Methods
We analyzed the Medco Health Solutions pharmacy benefit manager database to identify patients with one or more claims for a biologic used to treat RA from 2007 to 2012. The first observed claim defined the index date, the previous 180 days were the pre-index period, and follow-up was 365 days after the index date. Effectiveness of a biologic was determined by a validated, published algorithm designed for use in claims database analyses. Cost per effectively treated patient as determined by the algorithm was calculated as the total annual cost of the biologic therapy divided by the number of effectively treated patients. Analyses were conducted for subcutaneous, IV, and individual biologics.
Results
The analysis population was 1,090 patients (subcutaneous: 785, IV: 305; etanercept: 440, adalimumab: 345, infliximab: 201, abatacept: 104). The mean age was 49.7±9.4 years, and 78% of the patients were female. Effectiveness according to the algorithm was higher in subcutaneous (36%) versus IV biologics (23%; P<0.001), and in etanercept (36%) versus infliximab (22%; P<0.001) and versus abatacept (24%; P=0.02). Etanercept and adalimumab were similar (35%; P=0.77). The cost per effectively treated patient according to the algorithm was $64,738 for subcutaneous biologics, $80,408 for IV biologics, $62,841 for etanercept, $67,226 for adalimumab, $90,696 for infliximab, and $62,303 for abatacept.
Conclusion
Effectiveness according to a validated, claims-based algorithm was higher in subcutaneous versus IV biologics. Cost per effectively treated patient according to the algorithm was approximately $16,000 less in subcutaneous versus IV biologics.
Introduction
Rheumatoid arthritis (RA) is a chronic immune-mediated condition that leads to significant disability if not sufficiently treated. Biologic drugs are recommended for treating RACitation1 if nonbiologic disease-modifying antirheumatic drugs (DMARDs) are not tolerated by the patient or do not induce low disease activity or remission. Approved and widely used biologics for treating RA include the tumor necrosis factor inhibitors etanercept,Citation2 adalimumab,Citation3 and infliximab,Citation4 and the selective T-cell costimulation modulator abatacept.Citation5 Etanercept and adalimumab are administered subcutaneously; infliximab and abatacept are administered via intravenous (IV) infusion. The adult dose for RA is fixed in the etanercept label; adult RA dosing can be changed for weight or to address loss of efficacy in the adalimumab, infliximab, and abatacept labels.Citation2–Citation5
Because of the high yearly cost of biologics and the prevalence of RA (approximately 1.3 million US adultsCitation6), the cost-effectiveness of biologics for treating RA is of interest to payers in general and pharmacy benefit managers (PBMs) in particular. According to the Pharmaceutical Care Management Association (a PBM trade group), PBMs administer drug plans for more than 210 million Americans in both government-sponsored and private contexts.Citation7 Analyses of PBM data are likely to be highly generalizable within the population under study, because multiple health plans are represented. PBMs negotiate drug pricing and design formularies on behalf of the health plans they contract with.Citation7 Therefore, PBM analyses are particularly relevant in determining the cost-effectiveness of high-cost, frequently used medications such as biologics for treating RA. Formulary decisions by PBM stakeholders are guided primarily by clinical trial results, but they also consider data from other sources such as observational research and internal analyses.Citation8 Clinical trial,Citation9 observational,Citation10 and meta-analyticCitation11 evidence indicates that biologics for treating RA are similar to one another in efficacy. The differences between drugs in dosing and administration, however, may lead to differences in cost-effectiveness. PBMs and the broader payer community will therefore benefit from cost-effectiveness analysis from other sources – including claims from PBM plans – to guide their formulary decisions regarding biologics for RA.
Analyses of biologic claims in PBM databases have yielded insights on costs per treated patientCitation12 and dose escalation,Citation13 but these analyses have not included estimates of effectiveness. An analysis of PBM data that incorporates estimations of both cost and effectiveness of biologics for treating RA would, therefore, provide a fuller picture of what this type of payer can expect in different formulary scenarios. One method for achieving this sort of analysis is to measure the effectiveness of biologics according to a validated algorithm; one can then calculate the cost per effectively treated patient.
A validated algorithm applied to medical claims data that classifies a biologic as effective based on six medication-related criteria has been developed to measure the effectiveness of biologics for RA.Citation14 The algorithm determines a biologic to be not effective if any of the following occur: low medication adherence, biologic switch or addition, addition of a new nonbiologic DMARD, increase in biologic dose or frequency, one or more glucocorticoid joint injections, and increase in dose of oral glucosteroid.Citation14 The algorithm was developed to address a key limitation of claims data, which is that it does not contain direct measurement of patient response to treatment. The algorithm was validated against a standard, quantitative measure of RA remission or disease improvement (designated the gold standard) using linked claims and outcomes data from the Veteran’s Administration RA registry.Citation14 Effectiveness according to the algorithm had high performance characteristics against the gold standard: positive predictive value, 76%; negative predictive value, 90%; sensitivity, 72%; and specificity, 91%.Citation14 Similar results were observed in a separate analysis using linked medical records and claims from a commercial health plan database (positive predictive value, 87%).Citation15
Application of the validated algorithm to commercial insurer databases (IMS PharMetrics Plus, MarketScan, and Optum Research) has found effectiveness rates ranging from 27.7% to 33% with etanercept, adalimumab, and abatacept, and from 19.0% to 21.9% with infliximab.Citation16–Citation18 The analysis of the Optum database also found higher algorithm-defined effectiveness in biologics administered subcutaneously (30.6%) than those administered via IV infusion (22.1%).Citation16
In these analyses, the cost per effectively treated patient according to the algorithm was also calculated. The analyses found that etanercept had the lowest year 1 cost per effectively treated patient according to the algorithm, followed by adalimumab, abatacept, and infliximab.Citation16–Citation18 Differences in cost per effectively treated patient were driven by similar algorithm-defined effectiveness with etanercept, adalimumab, and abatacept; lower total cost with etanercept; and fewer algorithm-defined effectively treated patients with infliximab. No published analysis has been performed using these methods in a PBM database.
Therefore, in the present study we analyzed claims from the Medco PBM database to estimate effectiveness according to the validated algorithm. We used algorithm-defined effectiveness to calculate the cost per effectively treated patient and conducted analyses by biologic and method of administration (subcutaneous and IV).
Methods
Study design
The present study was an analysis of linked medical and pharmacy claims from the Medco Health Solutions PBM database.
Medco Health Solutions (Franklin Lakes, NJ, USA), which was acquired by Express Scripts (St. Louis, MO, USA) in 2012, has pharmacy claims data for over 60 million covered lives and medical claims data for 12.7 million covered lives. The database includes different types of insurance plans with varying formularies. Pharmacy claims data are available within weeks and medical claims data within 3–4 months of filing. Laboratory results are not available in the Medco PBM database. All patient records were de-identified, and the study complied with the Health Insurance Portability and Accountability Act of 1996.
For the present study, the data-cleaning algorithm checked and cleaned the biologic dose per dispensing field based on the plan paid amount, biologic dose, injection frequency, and wholesale acquisition cost (WAC; AnalySource, First DataBank Inc., South San Francisco, CA, USA).
We identified patients included in the Medco PBM database with one or more claims for a biologic of interest (abatacept, adalimumab, anakinra, certolizumab, etanercept, golimumab, infliximab, rituximab, or tocilizumab) from July 1, 2007, to July 31, 2012. The first observed claim during the patient identification period defined the index date; the previous 180 days were defined as the pre-index period; and the follow-up period was the 365 days after the index date. Patients were included in the analysis if they had continuous health plan enrollment during the pre-index period, index date, and follow-up period; were aged 18–63 years on the index date; and had a diagnosis of RA during the pre-index period or on the index date (International Classification of Diseases, Ninth Edition, Clinical Modification [ICD-9-CM] diagnosis code 714.0x).
Patients were excluded if they had claims for more than one biologic of interest on the index date or any biologics in the pre-index period; an index claim for a biologic that had not received US Food and Drug Administration approval; and a diagnosis during the pre-index period for a non-RA condition for which any of the biologics of interest are approved (plaque psoriasis, ICD-9-CM 696.1; psoriatic arthritis, 696.0; ankylosing spondylitis, 720.0; juvenile idiopathic arthritis, 714.3x; Crohn’s disease, 555.xx; ulcerative colitis, 556.xx; non-Hodgkin’s lymphoma, 200.xx or 202.xx; or chronic lymphocytic leukemia, 204.1x). Biologics of interest with <100 eligible patients were excluded from the final analysis because of small sample size.
We collected key baseline characteristics and nonbiologic DMARD use during the pre-index period.
Study outcomes
The validated algorithmCitation14 for effectiveness evaluated each patient’s treatment as effective or not effective (). Briefly, a patient’s treatment was determined by the algorithm to be effective if none of the following occurred: low adherence to drug (defined as medication possession ratioCitation19 <80%, or <80% of the minimum recommended number of infusions); addition or switch of biologic; addition of a new nonbiologic DMARD; increase in biologic dose or frequency; more than one glucocorticoid joint injection from 91 days to 1 year after the index date; and increase in dose of oral glucocorticoid (no pre-index prescription: received for ≥30 days from 91 days to 1 year after the index date; with pre-index prescription: cumulative dose >120% of pre-index).Citation14
Table 1 Components of the effectiveness algorithm, assessed between the index date and the outcome visit date approximately 1 year later
Annual biologic costs were calculated based on the total dose of biologics that patients received and the WAC price as of January 1, 2013. Annual cost per effectively treated patient was calculated by dividing the total cost of biologic treatment of the cohort by the number of effectively treated patients according to the validated algorithm. The formula for this calculation is as follows:
Statistical analysis
Descriptive analysis was conducted for all patients in the analysis data set, by method of administration (subcutaneous or IV) and by index biologic. Method of administration and index biologic were compared in baseline characteristics, pre-index nonbiologic DMARD use, and effectiveness according to the algorithm. Statistical comparisons were conducted using the Student’s t-test for continuous variables and chi-square or Fisher’s exact test for categorical variables. Statistical significance was P<0.05. All analyses were conducted using SAS version 9.21 (SAS Institute Inc., Cary, NC, USA).
Results
Patients
Out of 97,816 patients with one or more RA diagnosis codes from January 1, 2007, to July 31, 2013, 11,693 (12%) had claims for biologics. Of these, 1,236 remained after applying inclusion and exclusion criteria (). There were 146 patients who were subsequently excluded because their index biologic had a sample size <100 (anakinra, certolizumab, golimumab, rituximab, and tocilizumab). The analysis population was 1,090 patients, of whom 785 were taking subcutaneous biologics (etanercept, n=440; adalimumab, n=345) and 305 were taking IV biologics (infliximab, n=201; abatacept, n=104) (). Etanercept was the most commonly used biologic, so it served as the comparator in index biologic analyses.
Table 2 Population attrition by application of inclusion and exclusion criteria
The mean ± standard deviation age was 49.7±9.4 years, which was significantly higher in patients taking IV compared to subcutaneous biologics, and in abatacept compared to etanercept ().
Table 3 Baseline characteristics
The mean ± standard deviation Charlson comorbidity index (CCI) of the study sample was 0.8±1.2, and the most common comorbidities found were hypertension (27.4%), diabetes (11.7%), and chronic pulmonary disease (10.8%). The mean CCI was similar between patients taking subcutaneous and IV biologics, etanercept and adalimumab, and etanercept and infliximab (). Proportions of patients with individual comorbidities were similar between those taking subcutaneous and IV biologics, except for malignancy (1.3% versus 3.6%; P=0.02). The CCI (1.1±1.3 versus 0.8±1.2; P=0.047) and proportion with hypertension (41% versus 27%; P=0.004) were higher in patients taking abatacept compared to etanercept. All other individual comorbidities were similar between patients taking abatacept compared to etanercept.
Most patients (72%) used DMARDs in the 180-day pre-index period, and the most commonly prescribed DMARD was methotrexate (58%) (). The proportion of patients taking DMARDs in the 180-day pre-index period was significantly higher among patients taking subcutaneous compared to IV biologics (P<0.001). This statistically significant difference was maintained in both IV biologics individually compared to etanercept (P<0.001 for infliximab and abatacept) ().
Table 4 DMARD use during the pre-index period (180 days)
Effectiveness according to the validated algorithm
The overall rate of effectiveness according to the validated algorithm was 32% and was significantly higher among patients taking subcutaneous (36%) compared to IV biologics (23%; P<0.001) ( and ). Effectiveness according to the validated algorithm was higher in patients taking etanercept (36%) compared to infliximab (22%; P<0.001) and abatacept (24%; P=0.02) but similar compared to adalimumab (35%; P=0.77) ( and ). Low adherence was the most common reason for a biologic to be considered not effective by the algorithm; the rate for this criterion was highest among patients taking abatacept (versus etanercept, P=0.02). There was a significantly higher proportion of patients meeting the increased biologic dose criterion in IV compared to subcutaneous biologics (P<0.001), and in adalimumab, infliximab, and abatacept compared to etanercept (P<0.001 for all) (). The proportion of patients meeting the multiple joint injections criterion was higher among patients taking IV compared to subcutaneous biologics (P=0.002) and for abatacept compared to etanercept (P<0.001) ().
Figure 1 Effectiveness according to the algorithm in percentage of patients.
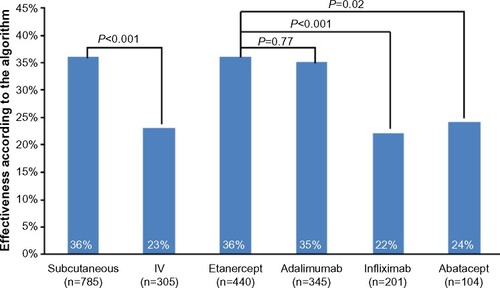
Table 5 Effectiveness according to the validated algorithm
Cost per effectively treated patient according to the validated algorithm
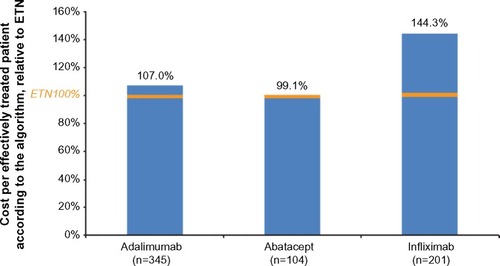
The annual cost per effectively treated patient according to the algorithm was $67,819 overall, $64,738 for subcutaneous biologics, and $80,408 for IV biologics. By individual biologic, the cost per effectively treated patient according to the algorithm was $62,841 for etanercept, $67,226 for adalimumab, $90,696 for infliximab, and $62,303 for abatacept (). The cost per effectively treated patient according to the algorithm relative to etanercept (100%) was 107% with adalimumab, 99% with abatacept, and 144% with infliximab ().
Figure 2 Cost per effectively treated patient according to the algorithm in US dollars for all patients, by method of administration and by biologic.
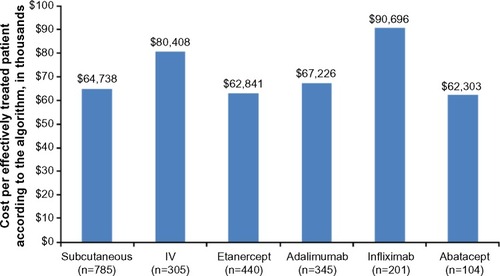
Figure 3 Cost per effectively treated patient according to the algorithm as a percentage in relation to ETN by biologic.
Discussion
In an analysis of PBM claims data, we found that patients with RA who took subcutaneous biologics experienced a higher rate of effectiveness according to a validated algorithm and lower cost per algorithm-defined effectively treated patient. Patients taking etanercept and adalimumab experienced similar algorithm-defined effectiveness rates, while the rates were higher with etanercept compared to infliximab and abatacept. The cost per effectively treated patient according to the algorithm was lowest with abatacept and etanercept followed by adalimumab and infliximab.
Most of the results of our analysis are consistent with those observed in previous analyses of commercial claims databases. Some of the differences between our analysis and those previously reported may derive from the differences between PBM and commercial claims databases. It is important to note, however, that other commercial claims databases may include PBM data; in discussing the results of our analysis and those that have been previously reported, we are not making an exact PBM versus non-PBM comparison. Nevertheless, we have observed results that distinguish our study results from those already reported.
Rates of algorithm-defined effectiveness in our study were significantly higher with subcutaneous compared to IV biologics, confirming a finding from an analysis of the Optum Research database (30.6% versus 22.1%, no P-value given).Citation16 The present analysis found higher etanercept and adalimumab and lower IV biologic effectiveness than other analyses using the validated algorithm we applied to our analysis.Citation16–Citation18 The difference may be due to better compliance with the subcutaneous biologics, which could have been identified because of PBM data use. Consistent with previous analyses,Citation16–Citation18 we found adherence to be the primary reason for a treatment to be deemed not effective according to the validated algorithm. The pattern by biologic in those analyses, however, differed from what we observed in the current study. Previous analyses found infliximab to have the highest adherence rate followed by abatacept; adherence for subcutaneous biologics was approximately 45%.Citation16–Citation18 In our study, etanercept, adalimumab, and infliximab all had an adherence of about 50%, while abatacept had the lowest rate (36.5%). The PBM data we analyzed may have captured more adherence data for subcutaneous biologics than other commercial claims databases. It is unclear, however, why both abatacept and infliximab had lower rates of adherence in our analysis than in previous analyses of other commercial claims databases.
Also, the proportion of patients with an increased biologic dose as defined by the algorithm was higher among those taking IV compared to subcutaneous biologics, and for adalimumab, abatacept, and infliximab compared to etanercept. As noted above, the algorithm deemed treatment that met the increased dose criterion to be not effective. A similar pattern was seen in similar analyses of other commercial claims databases, with etanercept having the lowest and infliximab the highest proportions of patients whose biologic therapy met the algorithm’s criterion for increased biologic dose.Citation16–Citation18 Dose escalation is permitted by the infliximab and adalimumab labelsCitation3,Citation4 but not by the etanercept label.Citation2 Accordingly, higher rates of dose escalation with infliximab and adalimumab compared to etanercept have been observed in claims analyses.Citation13,Citation20–Citation27
Biologic effectiveness, adherence, and dosing all have significant cost implications for formularies. Cost per effectively treated patient according to the algorithm incorporates these variables and provides a method to compare both biologic administration methods and individual drugs. In the current study, this outcome was lower in subcutaneous compared to IV biologics; by biologic, abatacept and etanercept were lowest, followed by adalimumab and infliximab (). Previous studies of cost per effectively treated patient according to the algorithm, all in other commercial payer databases, have shown etanercept to be lowest, followed by adalimumab, abatacept, and infliximab.
Notably, we derived these cost estimates from a PBM database and applied WAC pricing. PBM data show drug utilization across various plans and formulary types, possibly increasing the generalizability of our results. Similarly, applying WAC pricing assigns costs as the highest possible amount and avoids the often-significant variability in paid amounts across different plan types. Of course, a key disadvantage would be the inability to conduct a plan-level analysis because no plan paid amounts were available. Overall, however, our analysis provides estimates of algorithm-defined effectiveness and cost per effectively treated patient that may allow plan managers to predict their formulary costs for biologics used to treat RA.
We acknowledge several limitations to our study. Our study was retrospective, and bias may have been introduced by factors we did not identify or measure. Moreover, the choice of a biologic for RA could have been influenced by channeling bias owing to patient, disease, or labeling characteristics. For example, we observed that patients taking IV biologics as a group and abatacept in particular were older than those taking subcutaneous biologics and etanercept, respectively. We also observed a greater proportion of patients taking DMARDs in the pre-index period among IV compared to subcutaneous, and for both IV biologics – infliximab and abatacept – compared to etanercept. The infliximab indication for RA requires that it be taken with methotrexate.Citation4 Therefore, patients who could not tolerate methotrexate therapy may have been directed to biologics that are labeled for biologic monotherapy in RA.
The dose increase criterion of the effectiveness algorithm could have introduced bias in favor of etanercept, which does not include dose escalation or weight-based dosing in its label. The amount of dose escalation required to deem the biologic therapy ineffective, however, would most likely be employed in the event of clinically meaningful loss of efficacy.
Finally, our use of PBM data to estimate algorithm-defined effectiveness has important limitations. We did not directly assess clinical effectiveness or quality of life. The algorithm that we applied to the claims data in the study database, however, has been validated against the Disease Activity Score in 28 joints (DAS28), a widely used and accepted assessment of RA disease activity.Citation28 The validation studyCitation14 found that the algorithm’s positive predictive value (ie, for finding a patient’s treatment effective) was 75% (95% confidence interval, 62%–86%) and negative predictive value was 90% (95% confidence interval, 84%–94%). The gold standard was clinically meaningful (low disease activity defined as DAS28 ≤3.2 or improvement by >1.2 units by 12±2 months), suggesting that most patients whose treatment courses were deemed ineffective by the algorithm did not experience a significant clinical benefit from the index biologic during the follow-up period. A similar result was observed in an analysis using a commercial databaseCitation15 (positive predictive value, 86.6%). We acknowledge that the algorithm has not been validated against a quality of life measure, and DAS28 focuses exclusively on joint counts and the global assessment of disease activity.Citation28
Conclusion
In a US PBM setting, effectiveness according to a validated, claims-based algorithm was higher in subcutaneous versus IV biologics. Algorithm-defined effectiveness was highest for etanercept and adalimumab. Dose escalation and low adherence led to lower algorithm-defined effectiveness for infliximab and abatacept. Cost per effectively treated patient according to the algorithm was approximately $16,000 lower in subcutaneous versus IV biologics. The latter outcome was lowest with etanercept and abatacept among the subcutaneous and IV biologics, respectively. The results of our study suggest that patients and PBMs may benefit from a formulary-driven strategy to encourage subcutaneous over IV biologic use in treating RA.
Acknowledgments
We thank Tim Peoples, MA, ELS, CMPP (employee and stockholder, Amgen Inc.), for medical writing assistance. Assistance with formatting the manuscript to meet journal specifications was provided by Gurpreet Kaur (CACTUS Communications, on behalf of Amgen Inc.).
Disclosure
Evidera conducted the study, which was sponsored by Amgen Inc. NW is a former employee of Evidera, and SB is an employee of Evidera. NS and DJH are employees and stockholders of Amgen Inc. The authors report no other conflicts of interest in this paper.
References
- SinghJAFurstDEBharatA2012 update of the 2008 American College of Rheumatology recommendations for the use of disease-modifying antirheumatic drugs and biologic agents in the treatment of rheumatoid arthritisArthritis Care Res (Hoboken)201264562563922473917
- Enbrel® (etanercept) [package insert]Thousand Oaks, CAAmgen Inc2013
- Humira® (adalimumab) [package insert]North Chicago, ILAbbVie Inc2014
- Remicade® (infliximab) [package insert]Horsham, PAJanssen Biotech Inc2013
- Orencia® (abatacept) [package insert]Princeton, NJBristol-Myers Squibb Co2013
- HelmickCGFelsonDTLawrenceRCEstimates of the prevalence of arthritis and other rheumatic conditions in the United States. Part IArthritis Rheum2008581152518163481
- About PCMA [webpage on the Internet]Washington, DCPharmaceutical Care Management Association (PCMA) Available from: http://www.pcmanet.org/about-pcma/about-pcmaAccessed February 26, 2015
- LeungMYHalpernMTWestNDPharmaceutical technology assessment: perspectives from payersJ Manag Care Pharm201218325626422468734
- Drug therapy for rheumatoid arthritis in adults: an update [webpage on the Internet]Rockville, MDAgency for Healthcare Research and Quality2013 Available from: http://www.effectivehealthcare.ahrq.gov/search-for-guides-reviews-and-reports/?pageaction=displayproduct&productid=1795Accessed February 26, 2015
- GreenbergJDReedGDecktorDA comparative effectiveness study of adalimumab, etanercept and infliximab in biologically naive and switched rheumatoid arthritis patients: results from the US CORRONA registryAnn Rheum Dis20127171134114222294625
- SinghJAChristensenRWellsGAA network meta-analysis of randomized controlled trials of biologics for rheumatoid arthritis: a Cochrane overviewCMAJ20091811178779619884297
- WuNLeeYCShahNHarrisonDJCost of biologics per treated patient across immune-mediated inflammatory disease indications in a pharmacy benefit management setting: a retrospective cohort studyClin Ther20143681231124125062652
- BlumeSWFoxKMJosephGChuangCCThomasJGandraSRTumor necrosis factor-blocker dose escalation in rheumatoid arthritis patients in a pharmacy benefit management settingAdv Ther201330551752723740359
- CurtisJRBaddleyJWYangSDerivation and preliminary validation of an administrative claims-based algorithm for the effectiveness of medications for rheumatoid arthritisArthritis Res Ther2011135R15521933396
- CurtisJRChastekBBeckerLFurther evaluation of a claims-based algorithm to determine the effectiveness of biologics for rheumatoid arthritis using commercial claims dataArthritis Res Ther201315240423472737
- CurtisJRChastekBBeckerLCost and effectiveness of biologics for rheumatoid arthritis in a commercially insured populationJ Manag Care Spec Pharm201521431832925803765
- CurtisJRSchabertVFHarrisonDJEstimating effectiveness and cost of biologics for rheumatoid arthritis: application of a validated algorithm to commercial insurance claimsClin Ther2014367996100425012729
- CurtisJRSchabertVFYeawJUse of a validated algorithm to estimate the annual cost of effective biologic treatment for rheumatoid arthritisJ Med Econ201417855556624754646
- SikkaRXiaFAubertREEstimating medication persistency using administrative claims dataAm J Manag Care200511744945716044982
- BonafedeMMGandraSRFoxKMWilsonKLTumor necrosis factor blocker dose escalation among biologic naïve rheumatoid arthritis patients in commercial managed-care plans in the 2 years following therapy initiationJ Med Econ201215463564322332705
- FisherMDWatsonCFoxKMChenYWGandraSRDosing patterns of three tumor necrosis factor blockers among patients with rheumatoid arthritis in a large United States managed care populationCurr Med Res Opin201329556156823489410
- GilbertTDJrSmithDOllendorfDAPatterns of use, dosing, and economic impact of biologic agent use in patients with rheumatoid arthritis: a retrospective cohort studyBMC Musculoskelet Disord2004513615485582
- HarrisonDJHuangXGlobeDDosing patterns and costs of tumor necrosis factor inhibitor use for rheumatoid arthritisAm J Health Syst Pharm201067151281128720651319
- HuangXGuNYFoxKMHarrisonDJGlobeDComparison of methods for measuring dose escalation of the subcutaneous TNF antagonists for rheumatoid arthritis patients treated in routine clinical practiceCurr Med Res Opin20102671637164520429830
- JoyceATGandraSRFoxKMSmithTWPillMWNational and regional dose escalation and cost of tumor necrosis factor blocker therapy in biologic-naïve rheumatoid arthritis patients in US health plansJ Med Econ201417111024131136
- SchabertVFBruceBFerrufinoCFDisability outcomes and dose escalation with etanercept, adalimumab, and infliximab in rheumatoid arthritis patients: a US-based retrospective comparative effectiveness studyCurr Med Res Opin201228456958022236091
- CannonGWDuVallSLHaroldsenCLPersistence and dose escalation of tumor necrosis factor inhibitors in US veterans with rheumatoid arthritisJ Rheumatol201441101935194325128516
- AndersonJCaplanLYazdanyJRheumatoid arthritis disease activity measures: American College of Rheumatology recommendations for use in clinical practiceArthritis Care Res (Hoboken)201264564064722473918