
Abstract
Weights associated with the EuroQol 5-Dimension 3-Level (EQ-5D-3L) instrument represent preferences for health states elicited from general population’s samples. Weights have not been calculated for every country; however, empirical research shows that cross-country differences exist. This empirical study aims at investigating the impact of recently developed Italian weights in comparison with UK and US scores on health-related utility calculation using a sample of patients with Crohn’s disease. The study is based on a survey on health-related quality of life in patients (n=552) affected by active Crohn’s disease conducted in Italy from 2012 to 2013. Utilities computed through the Italian algorithm (mean: 0.76; SD: 0.20; median: 0.81) are generally higher than US (mean: 0.69; SD: 0.22; median: 0.77) and UK (mean: 0.57; SD: 0.32; median: 0.69) utilities, except for extremely severe health states where US values outweigh the Italian ones. UK preference weights generate the highest number of negative results. All the three value distributions are left-skewed due to very low scores associated with the most serious health states (ie, three or four levels equal to 3). As expected, despite the tariff set considered, more severe disease (Harvey Bradshaw Index >16) reduces the mean conditional EQ-5D-3L index (P<0.0001). Kendall’s rank correlation between EQ Visual Analog Scale score and EQ-5D-3L index is positive (P<0.0001), even though patients tend to value their health-related quality of life more when responding to EQ-5D-3L questions than on EQ Visual Analog Scale. Regardless of the tariff set considered, ordinary least-square results highlight that more severe disease (Harvey Bradshaw Index >16) reduces the mean conditional EQ-5D-3L index (P<0.0001). Results reveal remarkable differences among the three national tariff sets and especially when severe health states occur, suggesting the need for country-specific preference weights when evaluating utilities, which can be problematic since they have not been calculated for every country yet.
Introduction
Modern medicine rapidly advances and, as a consequence, a huge number of new and expensive medical treatments become available. In a context in which national health care systems need to reduce their spending while improving people’s health and health-related quality of life (HRQoL), economic evaluations of health care programs are becoming increasingly important.
Currently, the EuroQol 5-Dimension 3-Level (EQ-5D-3L) questionnaire is one of the most adopted instruments to measure HRQoL (also known as utility) in patient groups or general population.Citation1,Citation2 Utility is a prerequisite for calculation of quality-adjusted life-years (QALYs).
The EQ-5D instrument is composed of two tools: a descriptive system and a Visual Analog Scale (VAS).
The EQ-5D-3L descriptive system allows the subject to report her/his health state with respect to five dimensions (mobility, self-care, usual activities, pain/discomfort, and anxiety/depression). Each dimension has three severity levels: 1 (no problem), 2 (some problems), or 3 (severe problems). There are (3Citation5=243) possible health states that derive from the combination of the severity levels for each dimension (from 11111 to 33333 representing the best and the worst health state, respectively); two more health states, such as “unconscious” and “dead” are considered for an overall number of 245. An algorithm enables the researcher to compute a final score (ie, utility index) ranging from minus infinity to 1 by attributing specific weights to each health state.
With the EQ VAS, the subject scores her/his health state between 0 (the worst imaginable health state) and 100 (the best imaginable health state) on a 20 cm-long, vertically oriented graphic graduated scale.
Weights associated with EQ-5D-3L represent preferences for health states elicited from samples of the general population through different techniques (ie, time trade-off, VAS).Citation3
Preference weights have not yet been calculated for every country. Until recently, as many other developed countries, Italy has adopted UK weights. However, empirical research shows that cross-country differences exist, even when the same study protocol is appliedCitation4 and/or the sampled population data are adjusted for demographic differences.Citation5 These differences are often reconducted to cultural issues and may have relevant effects on QALYs calculation and, thus, on priority setting in health care.
Up to now, a few studies have compared the impact of different country-based preference weights on given patient populations. A literature search in PubMed (keywords: “health utility”, “preference weight”, and “EQ-5D”) performed on September 10, 2014, yielded only three studies on this topic: a comparison of UK, US, and Danish utilities in south Swedish patients with rheumatoid arthritis,Citation6 a comparison of utility weights for pneumococcal and human papillomavirus diseases in Argentina, Chile, and UK,Citation7 and a comparison of EQ-5D-3L index using UK, US, and Japan preference weights in a sample of Thai patients with type 2 diabetes.Citation8 To the best of our knowledge, no research of this kind has been conducted in Italy so far.
This study aims at filling this gap by estimating the impact of three different country-specific (Italy, UK, and US) EQ-5D preference weights on the health utilities of a convenience sampleCitation9 of Italian patients with Crohn’s disease (CD).
CD is a gastrointestinal chronic condition affecting about 100,000 individuals in Italy, with an incidence of approximately three to four new cases per 100,000 inhabitants per year.Citation10 The peak age of Crohn’s onset is 20–25 years,Citation10 which, combined with low fatality, means that patients live with the disease for decades experiencing substantial HRQoL impairment and financial burden.Citation11
Methods
Study sample
The study is based on a survey on HRQoL (Survey on Quality of Life in Crohn’s Patients, SOLE) that was carried out in Italy from 2012 to 2013.
SOLE has been conducted on a large cohort of patients (n=552) with active CD to assess disease activity and its relationship with various aspects, such as workability, patient satisfaction, and compliance with the treatment.
Patients enrolled in SOLE survey were referred to a convenience sampleCitation9 of 38 Italian gastroenterological centers at the forefront in dealing with CD during four per protocol visits that were spaced out in a time frame of 1 year.
For the purpose of this study, only 500 EQ-5D-3L questionnaires and 497 EQ VAS collected during the first visit were included in the analysis.
As per SOLE survey’s inclusion criteria, only adult patients (>18 years) affected by moderate or severe CD (Harvey Bradshaw Index [HBI] ≥8) were eligible for the study.Citation12 HBI quantifies CD activity according to five dimensions: general well-being, abdominal pain, number of liquid stools per day, abdominal mass, and further complications. A score of <5 is usually considered clinical remission. Scores between 5 and 7 represent a mild level of disease, whereas scores between 8 and 16 indicate a moderate burden. Scores >16 are symptomatic of severe disease.
SOLE study obtained approval/authorization by the ethics committees (“Comitati Etici”, one per clinical center involved in the study), as requested by local regulations. Prior to the inclusion in the study, all patients in each center provided to the principal investigator a signed informed consent form for personal data treatment.
Italian, UK, and US preference weights
EQ-5D-3L indexes have been calculated by applying Italian,Citation4 US,Citation13 and UKCitation14 general population-based preference weights. Preferences for the scoring function were measured using the time trade-off technique on adults randomly sampled from the general population.Citation3 The scoring function was obtained as coefficients of econometric models.Citation3 The three country-specific algorithms differ not only in preference weights derived from individuals’ answers but also in the number and type of variables considered in the formulas ().
Table 1 Italian, UK, and US algorithms used for EQ-5D-3L index calculation
In general, in order to calculate utilities, all coefficients are subtracted from 1; the five dimensions (mobility, self-care, usual activities, pain/discomfort, anxiety/depression) are converted into dummy variables, which assume value 1 if the dimension considered is at level 2 or 3 (depending on the variable considered) and 0 otherwise.
In order to better fit general population’s preferences, the formulas also consider additional variables. The UK algorithm includes a dummy variable indicating the presence of “any dimension at level 3” (N3).Citation14 The Italian formula includes the “number of dimensions at level 2 or 3 beyond the first” (D1).Citation4 The US formula considers, besides D1, the “number of dimensions at level 3 beyond the first” (I3), the “square of I3” (I3-squared), and the “square of number of dimensions at level 2 beyond the first” (I2-squared).Citation13
Data analysis
Descriptive statistics (mean, SD, median, minimum [min], maximum [max]) on country-specific utility sets have been calculated.
The strength of the association between EQ-5D-3L index – calculated via the Italian, UK, and US utility values – and VAS scores has been investigated by Kendall’s tau rank correlation coefficients.Citation15
An ordinary least-square (OLS) regression has been performed in order to assess the effect of a set of predictors on the conditional mean EQ-5D-3L index. As patients were not independent observations, OLS standard errors have been clustered on them.
No imputation procedure was applied for replacing missing values.
Statistical analyses have been conducted using Stata13.1 software (StataCorp LP, College Station, TX, USA).
Results
Sample characteristics
Sociodemographic and clinical characteristics of the sample are shown in .
Table 2 Sociodemographic and clinical characteristics of the patients’ sample (n=500)
Patients’ mean age was 41.18 years (SD: 13.77; median: 41; min: 18; max: 84), and a slight male prevalence (50.2%) was observed. The mean HBI was 10.31 (SD: 3.28; min: 8; max: 39). The great majority of patients (n=389; 77.8%) scored an HBI between 8 and 11 and 84 subjects (16.8%) were between 12 and 16, while the remaining 27 (5.4%) over 16.
Mean years from CD onset were 2.19 (SD: 4.44). Most patients (n=436; 87.2%) had a history of CD ≤5 years, whereas the disease history was ≥26 years for three patients only (0.6%).
shows the answers given to the EQ-5D-3L questionnaire. In particular, most of the patients experience more severe limitations regarding d3 (usual activities), d4 (pain/discomfort), and d5 (anxiety/depression) rather than d1 (mobility) and d2 (self-care). shows the scores given through the VAS. Approximately 75% of patients gave a score on their perceived health higher than 40.
Table 3 EQ-5D-3L questionnaire results of the patients sample (N=500)
Table 4 VAS results of the patients sample (N=497)Table Footnotea
Italian, UK, and US utility sets
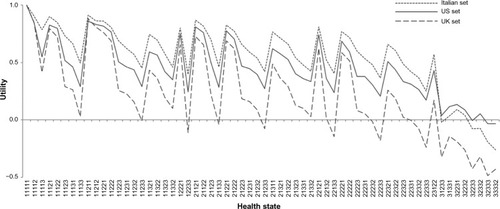
shows utility values associated with each one of the 62 health states that occurred in the sample. The maximum utility value (1, ie, perfect health state [11,111]) obviously overlaps, irrespective of the algorithm adopted. Conversely, the minimum utility value drops to −0.26, −0.48, and −0.04 when applying Italian, UK, and US weights, respectively. In the Italian and US models, the lowest utility score refers to the health state 33332 (severe problems related to mobility, self-care, usual activities, and pain/discomfort, and moderate problems regarding anxiety/depression), whereas in the UK formula it is associated with the health state 32333. These findings may suggest that, other things being equal, Italian and US people consider a deficiency in their self-care abilities worse than anxiety/depression (and vice versa for UK population).
Figure 1 Italian, UK, and US value sets per health state (n=62) occurred in the sample.
Statistical analysis
presents the descriptive statistics for EQ-5D-3L index according to the country-specific formula adopted. The highest mean utility value occurs when Italian weights are applied (mean: 0.76; SD: 0.20; median: 0.81; min: −0.26; max: 1.00), followed by US (mean: 0.69; SD: 0.22; median: 0.77; min: −0.04; max: 1.00) and UK ones (mean: 0.58; SD: 0.32; median: 0.69; min: −0.48; max: 1.00).
Table 5 Descriptive statistics of EQ-5D-3L index using Italian, UK, and US preference weights
All the three value distributions are left-skewed (mean < median), as mean values are dragged down by low scores associated with the most severe health states (ie, three or four levels equal to 3).
Considering the 62 health states that occurred in the sample, Italian utilities are always higher than UK utilities with the exclusion of the perfect health state where both are equal to 1 (). US utilities are generally lower than Italian ones and higher than UK utilities. However, US utilities become higher than Italian ones in correspondence of a group of eight severe health states (31233, 31331, 32231, 32232, 32233, 32332, 32333, and 33332). UK values assume a negative sign much more frequently and, when it happens, their magnitude is also higher than in the Italian and US sets.
When using Italian preference weights, the great majority (89.8%) of health values fall in the range between 0.50 and 1.00, while only 1.6% of the scores are negative utilities. Conversely, 75% of UK values fall in the range between 0.50 and 1.00, and 8.8% of the observations present a negative utility value. US utilities distribution is similar to the Italian one, despite having more utilities falling in the range 0.00–0.50 (18%) and fewer negative values (1%).
Finally, the distance between the curves, considered in pairs, increases as the health states become worse (ie, they are characterized by the prevalence of levels 2 and 3 in the five dimensions).
Mean EQ VAS scores equal 58.50 (SD: 18.72; median: 60; range: 0–100) when HBI is between 8 and 11, and 42.57 (SD: 21.35; median: 49; range: 0–80) when HBI is between 12 and 16. Patients with HBI >16 express a mean EQ VAS score of 29.96 (SD: 21.88; median: 30; range: 0–90).
Consistently with the existing literature,Citation16 VAS scores given by respondents tend to be multiples of 5 (347/508, or 69.29%) or 10 (273/508, or 54.60%).
Finally, a ceiling effect for EQ-5D-3L index has been shown.Citation17,Citation18 EQ-5D-3L index reached 1.00 (ie, no problems in any of the five dimensions) for 7% of the sample (35 out of 500 responders), whereas the percentage of patients reporting full health dramatically drops to 0.4% (two out of 497 responders) for EQ VAS score.
Due to missing values, the correlation between EQ-5D-3L index and EQ VAS score has been studied in 497 patients only ().
Table 6 Rank correlation between EQ-5D-3L index and EQ VAS
Regardless of the tariff sets, Kendall’s tau rank correlation coefficients show a positive (and highly statistically significant; P<0.0001) association between the two EQ instruments meaning that the higher the EQ-5D-3L index, the higher the EQ VAS score related to the same health state (and vice versa).
Other things being equal, OLS results show that mean conditional EQ-5D-3L index for patients with HBI 8–11 is higher when calculated with the Italian set vs both UK (+0.17; P<0.0001) and US (+0.07; P<0.0001) ones ().
Table 7 Ordinary least-square regression
Moreover, a country-specific main effect in favor of the Italian utility weights was found for baseline HBI level (8–11). When the EQ-5D-3L index was calculated on the grounds of the UK and US tariffs, the predicted difference vs the Italian ones reaches −0.172 (P<0.0001) and −0.073 (P<0.0001), respectively.
As expected, for all the tariff sets considered, when adjusted for the other predictors, increased HBI reduces mean conditional EQ-5D-3L index.
Others things being equal, when the Italian utility weights were considered, an increase in HBI from 8–11 to 9–16 predicts a variation of −0.114 (P<0.0001) in mean conditional EQ-5D-3L index; the predicted decrease in EQ-5D-3L index is more than doubled (−0.265; P<0.0001) if HBI worsens from 8–11 to >16. Interestingly, there is also a statistical significant interaction between the UK utility set and both the HBI categories different from the reference one, whereas this finding does not hold for US tariffs.
Eventually, when contrasted against female, ceteris paribus males are predicted a higher mean conditional EQ-5D-3L index (+0.06; P=0.003).
Discussion
To the best of our knowledge, this is the first study that examines the differences between Italian, UK, and US EQ-5D-3L preference weights on a patient’s sample.
Results reveal remarkable differences among the three national tariff sets (especially when severe health states occur) suggesting the need for country-specific preference weights when evaluating health-related utilities.Citation4,Citation14,Citation19,Citation20 This also leads to the question of which preference weights should be used in cost-effectiveness analyses in those countries where a national utility set is not available yet.
Interestingly, results show that people tend to judge their health state in a more negative way when using the EQ VAS compared to the EQ-5D-3L index. This effect is known as “end-point aversion,” a measurement bias that occurs when people are not likely to use the extreme ends of the scales, compromising the integrity of the measurement itself.Citation21
Conversely, unlike EQ-5D-3L index, which allows for disutilities in extremely severe health states, the minimum EQ VAS score is zero; as a consequence, health states perceived as worse than death do not have a proper representation on the EQ VAS.
Hence, understanding the functioning of these instruments for the measurement of HRQoL is vital for policy-makers in order to make evidence-based and thoughtful decisions in health care planning and resource allocation.
It is also noteworthy that, other things being equal, HBI remarkably affects EQ-5D-3L index differences for patients with CD, especially when UK weights were applied. Hence, when adopting a given national set of EQ-5D weights for QALYs calculation, policy-makers should be aware of possible multiplicative effects on the predicted mean conditional EQ-5D-3L index played by disease-specific features and country-specific tariff set.
The results from this study need to be interpreted in the light of some limitations. First of all, the old version of EQ-5D questionnaire was administered to patients with CD, as the new five-level version (EQ-5D-5L) was not available at the time the SOLE study started out. In addition, we considered a convenience sample of patients with moderate-to-severe CD (HBI ≥8), which is not representative of the entire CD population.
A third issue relates to the fact that the EQ-5D-3L results in this study were calculated for patients with CD; hence, they cannot be generalized to other patient populations. However, methodological issues regarding the calculation of utilities attached to each health state occurred in the sample can be generalized to other diseases.
As a fourth limitation, some concerns arise around the validity of the EQ instruments to estimate HRQoL in patients with CD.Citation22 Since CD is a cyclical medical condition that alternates between periods of activity and remission,Citation10 questionnaire results may vary according to the disease status respondents are living at that moment. Moreover, people who have experienced a certain health state for a longer time tend to evaluate their HRQoL in a more positive way than those just hit by the disease.Citation23 In addition, patients undergoing surgery might have a different perception of their HRQoL due to either physical or psychological distress related to the intervention and depending on the outcome of the procedure.Citation24 These adaptation-related issuesCitation25 might have influenced the answers of the sampled individuals, and thus, the study results.
General population weights on samples with a specific condition have been tested by several authors in different contexts.Citation26 However, some authors claim the need for patient-specific preference weights when considering particular health conditions.Citation27 Since CD-specific preference weights are not available at present, disease-unspecific weights derived from general population have been used in this study.
Obviously, the process of developing disease-specific weights is very time- and resource consuming.
Thus, it would be interesting to compare national tariff sets for at least the most frequent diseases (eg, cancer and cardiovascular diseases) in order to widen the applicability of this approach. For instance, specific weights for inflammatory bowel disease might be applied to both CD and ulcerative colitis patients. At the same time, the use of disease-specific tariffs would reduce the comparability of health outcomes (ie, QALYs) across different therapeutic areas.
The scope of this study was to compare three tariff sets for the EQ-5D-3L descriptive system. However, it would be interesting to correlate the results of this study with those achievable from other generic health utility instruments such as the Short-Form 36Citation28 or disease-specific HRQoL questionnaires (ie, the Rating Form of Inflammatory Bowel Disease Patient Concerns).Citation29
Finally, more research is needed to explore the impact of clinical and sociodemographic variables, as well as cultural differences, on the country-specific utility sets and to investigate the real causes of the divergence of national value sets.
Conclusion
This study shows remarkable differences among health-related utilities calculated by using Italian, UK, and US EQ-5D-3L preference weights in a patient’s sample. These differences can potentially influence QALYs via HRQoL calculation and, ultimately, cost-effectiveness analyses results.
The results provided in this paper suggest the need for using country-specific weights when conducting cost-effectiveness analyses, which can be problematic since they have not been calculated for every country. Moreover, given that the EQ-5D questionnaire is currently one of the most adopted methods to measure the HRQoL,Citation1,Citation2 national sets of tariffs are particularly important when considering critical medical conditions, since differences among models tend to increase when severe health states occur.
Given the potential differences explained above, others things being equal, rationing choices concerning the introduction of an innovative medical technology in a given country may end up with different decisions on allocation of resources, conditional on the applied preference weights set. This consideration is valid for all countries for which, like Italy until few years ago, national preference weights have not been calculated and, thus, EQ-5D sets elicited from other countries have been used. Hence, the risk of cross-country health disparities and equity issues concerning the availability of innovative medical technologies cannot be safely ignored.
However, more research is needed to actually quantify the real impact on cost-effectiveness analyses based on the use of different EQ-5D tariffs.
Acknowledgments
The SOLE study was sponsored by AbbVie.
Disclosure
AbbVie contributed to the study design, research, and interpretation of data and writing, reviewing, and approving the publication. VT and MB are employees of AbbVie. CL is a consultant in AbbVie. AbbVie has a contract with Centre for Research on Health and Social Care Management for consultancies. No payments were made for drafting or reviewing this publication. All authors have accepted direct responsibility for the paper. The authors report no other conflicts of interest in this work.
References
- StamuliEHealth outcomes in economic evaluation: who should value health?Br Med Bull200197119721021285110
- EuroQol GroupEuroQol-a new facility for the measurement of health-related quality of lifeHealth Policy199016319920810109801
- DrummondMFSculpherMJTorranceGWO’BrienBJStoddartGLMethods for the Economic Evaluation of Health Care Programmes3rd edOxfordOxford University Press2005
- ScaloneLCortesiPACiampichiniRItalian population-based values of EQ-5D health statesValue Health201316581482223947975
- EuroQol Group [webpage on the Internet]Measuring Self-Reported Population Health: An International Perspective Based on EQ-5D. [Report on the Internet]2004115 [cited September 10, 2015]. Available from: http://www.euroqol.org/fileadmin/user_upload/Documenten/PDF/Books/Measuring_Self-Reported_Population_Health_-_An_International_Perspective_based_on_EQ-5D.pdfAccessed March 17, 2016
- KarlssonJANilssonJANeoviusMNational EQ-5D tariffs and quality-adjusted life-years estimation: comparison of UK, US and Danish utilities in south Swedish rheumatoid arthritis patientsAnn Rheum Dis201170122163216621859684
- GalanteJAugustovskiFColantonioLEstimation and comparison of EQ-5D health states’ utility weights for pneumococcal and human papillomavirus diseases in Argentina, Chile, and the United KingdomValue Health20111456064
- SakthongPCharoenvisuthiwongsRShabunthomRA comparison of EQ-5D index scores using the UK, US, and Japan preference weights in a Thai sample with type 2 diabetesHealth Qual Life Outcomes20086717518811935
- LohrSLSampling: Design and Analysis2nd edBostonBrooks/Cole2010
- BenediniVCaporasoNCorazzaGRBurden of Crohn’s disease: economic and quality of life aspects in ItalyClinicoecon Outcomes Res2012420921822866007
- SonciniMTriossiOLeoPMagniGRING Study GroupInflammatory bowel disease and hospital treatment in Italy: the RING multi-centre studyAliment Pharmacol Ther2004191636814687167
- HarveyRFBradshawJMA simple index of Crohn’s-disease activityLancet19803158167499556
- ShawJWJohnsonJACoonsJSUS valuation of EQ-5D health states: development and testing of the D1 valuation modelMed Care200543320322015725977
- BadiaXRosetMHerdmanMKindPA comparison of United Kingdom and Spanish general population time trade-off values for EQ-5D Health StatesMed Decis Making200121171611206949
- KendallMA new measure of rank correlationBiometrika1938301–28189
- JensenMPTurnerJARomanoJMWhat is the maximum number of levels needed in pain intensity measurement?Pain19945833873927838588
- JanssenMFPickardASGolickiDMeasurement properties of EQ-5D-5L compared to the EQ-5D-3L across eight patient groups: a multi-country studyQual Life Res20132271717172723184421
- BrazierJRatcliffeJSalomonJATsuchiyaAMeasuring and Valuing Health Benefits for Economic Evaluation1st edOxfordOxford University Press2007
- HuangICWillkeRJAtkinsonMJLenderkingWRFrangakisCWuAWUS and UK versions of the EQ-5D preference weights: does choice of preference weights make a difference?Qual Life Res20071661065107217415683
- WuYQLiuKTangXEmpirical research of measuring elderly health utility in the outskirts of Beijing by using European quality of Life 5-dimensionsBeijing Da Xue Xue Bao201244339740222692310
- LeeSWNiilekselaCREcobehavioral Consultation in Schools1st edNew YorkRoutledge2014
- KönigHHUlshöferAGregorMValidation of the EuroQol questionnaire in patients with inflammatory bowel diseaseEur J Gastroenterol Hepatol200214111205121512439115
- JansenSJKievitJNooijMAStiggelboutAMStability of patients’ preferences for chemotherapy: the impact of experienceMed Decis Making200121429530611475386
- McLeodRSBaxterNNQuality of life of patients with inflammatory bowel disease after surgeryWorld J Surg19982243753819523520
- SchwartzBThe Paradox of Choice: Why More is Less1st edNew YorkHarper Perennial2004
- BalabanDJSagiPCGoldfarbNINettlerSWeights for scoring the quality of well-being (QWB) instrument among rheumatoid arthritis: a comparison to general population weightsMed Care198624119739803773579
- PickardASRaySGanguliACellaDComparison of FACT- and EQ- 5D-based utility scores in cancerValue Health201215230531122433762
- WareJEJrSherbourneCDThe MOS 36-item short-form health survey (SF-36): I. Conceptual framework and item selectionMed Care19923064734831593914
- HjortswangHStromMAlmeidaRTAlmerSEvaluation of the RFIPC, a disease-specific health-related quality of life questionnaire, in Swedish patients with ulcerative colitisScand J Gastroenterol19973212123512409438322