
Abstract
Background
Knee pain (KP) causes gait difficulties in older adults and is associated with slow gait speed (GS). Obesity has negative effects on health. GS is an important indicator of health, well-being, and mean life span in older adults and is a strong predictor of future disability and mortality. The relationship between frequent KP, obesity, and GS in older adults remains unclear. Therefore, the present study aimed at examining the relationship between baseline frequent KP and obesity status on GS over time. We hypothesized that frequent KP, obesity, or both would be associated with decreased GS over time.
Methods
The data from the Osteoarthritis Initiative were used for this 6-year longitudinal cohort study. We studied 3,118 adults aged between 45 years and 79 years. We grouped the participants into the following four categories according to KP frequency and obesity status at baseline: 1) no KP and nonobese, 2) frequent KP and nonobese, 3) no KP and obese, and 4) frequent KP and obese. GS measurements were based on a 20 m walking test timed using a stopwatch; testing was performed at baseline and over a 6-year follow-up period. Walk pace (m/sec) was calculated as the average pace over two trials conducted at clinic visits. General linear mixed models were used to examine the relationships between frequent KP, obesity, and GS.
Results
After adjusting for all covariates, at baseline, all the nonobese group with frequent KP (β=−0.06, 95% confidence interval [CI]: −0.07 to −0.04), the obese group with no KP (β=−0.07, 95% CI: −0.1 to −0.04), and the obese group with frequent KP (β=−0.08, 95% CI: −0.1 to −0.05) exhibited decreased GS compared with the nonobese and no KP group. However, the associations between frequent KP, obesity, and GS over time were not statistically significant.
Conclusion
Frequent KP alone, obesity alone, and the combination of frequent KP and obesity were all associated with decreased GS in older adults. These associations did not change in any of the groups longitudinally; as such, the slopes corresponding to the data remained unchanged.
Introduction
Knee pain (KP), the most common symptom of knee osteoarthritis (OA), causes gait difficulties in older adultsCitation1 and is associated with slow gait speed (GS).Citation2 Self-reported KP is the main factor affecting gait and causing gait limitations in older adults.Citation3 Previous studies have reported that older individuals with KP have a slower average GS than those with no KP.Citation4 White et alCitation5 conducted a prospective cohort study of older adults and found that ~5% of individuals experiencing frequent KP exhibited fast declines in GS (3% decline per year).
Obesity, a medical condition defined as abnormal or excessive accumulations of body fat, may negatively impact health.Citation6 Recent studies have indicated that obesity is associated with reduced GS in older adults, particularly among those at high risk for functional decline.Citation7 These findings are of significant concern because the number of obese adults is increasing worldwide.Citation8 Moreover, obese individuals experiencing frequent KP tend to experience higher levels of KP than their nonobese counterparts.Citation9 Previous studies have indicated that obesity is associated with decreased GS compared with normal weight subjects.Citation8
GS is an important indicator of health and a strong predictor of future disabilityCitation10 and mortalityCitation11 in older adults. As such, GS is considered the sixth vital sign and is strongly associated with aging in a manner similar to the other vital signs.Citation12 Previous studies have found that the largest differences in gait occur after the age of 65 years and that GS declines at a rate of 1%–4% per year from ages 65 to 80.Citation13 Frequent KP is a common symptom of knee OA and adversely affects gait mechanics, although little is known about the influence of obesity on GS.Citation14 Strong associations have been found between obesity and frequent KP or knee OA, two conditions that individually affect GS.Citation15 However, the relationship between frequent KP, obesity, and GS in older adults remains unclear. Therefore, the present study aimed at examining the relationship between baseline frequent KP and obesity status on GS over time. We hypothesized that frequent KP, obesity, or both would be associated with decreased GS over time compared with those who have no KP and no obesity.
Methods
Design
This study was a 6-year longitudinal cohort study using data from the Osteoarthritis Initiative (OAI).
Participants
We studied 3,118 adults aged between 45 years and 79 years. All participants in this study were recruited as part of the ongoing, publicly and privately funded, multicenter, and longitudinal OAI study (N=4,796). Patients at high risk of knee OA were recruited from four clinical sites in the US (Baltimore, MD; Pittsburgh, PA; Pawtucket, RI; and Columbus, OH) between February 2004 and May 2006. Details of the OAI study criteria are available at http://oai.ucsf.edu/datarelease. All of the participants provided written informed consent. The OAI study protocol was approved by the institutional review board of the OAI Coordinating Center, University of California at San Francisco.
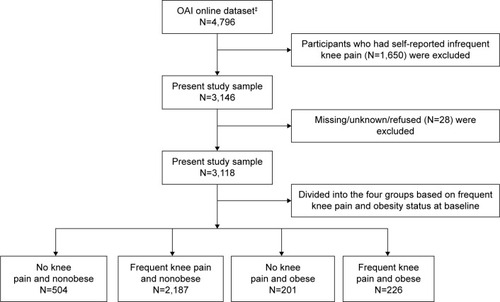
Participants were included if they were aged between 45 years and 79 years, regardless of sex or ethnicity. Participants with the presence or absence of frequent KP and obesity were included in this study (). However, since infrequent KP is common among people of all ages, we decided to exclude them from the analyses (n=1,650). Participants who did not know, were not sure, or refused to answer (0.9% of the 3,118 respondents)Citation16 were also excluded from the analyses (). We used data from 12-, 24-, 36-, 48-, and 72-month follow-ups.
Figure 1 Flow diagram of the selection and classification of the participants enrolled in the Osteoarthritis Initiative study who were included in the present study.
Abbreviation: OAI, Osteoarthritis Initiative.
Measures
Frequent KP was assessed based on answers of “yes” to the following two self-reported questions. 1) During the past 12 months, have you had pain, aching, or stiffness in or around your (right/left) knee? 2) During the past 12 months, have you had pain, aching or stiffness in or around your (right/left) knee on most days for at least 1 month? The frequent KP was defined, and the participants were classified as having frequent KP if they answered “yes” to both questions and as having no KP if they answered “no”. The infrequent KP was defined, and the participants were classified as having infrequent KP if they answered “yes” to the first question and “no” to the second question. Similar classifications were used in the Baltimore Longitudinal Study of AgingCitation17 and in other population-based surveys.Citation18
Obesity was defined based on body mass index (BMI), which is a simple index for classifying body weight status in adults.Citation19 BMI is calculated by dividing body weight in kilograms by the square of body height in meters (weight [kg]/height [m]Citation2). Participants with BMIs ≥30 were classified as obese.
GS was measured via a 20 m walk test that was timed using a stopwatch. GS was assessed at baseline and over a 6-year follow-up with usual walking speed from a standing start. Walk pace (m/sec) was calculated as the average pace over two trials conducted at clinic visits. If one value was missing, then the remaining value was used. The participants walked at a comfortable, self-directed pace in a corridor between two cones spaced 20 m apart and then they returned to sit in a chair at the starting cone. GS was computed as the distance of the test course divided by the time required to complete the test; similar measures have been used in other epidemiological studies.Citation20 The participants wore their usual footwear and used walking aids/devices as needed.
The following covariates were included: 1) sociodemographic characteristics, including age (years), race (nonwhite vs white), sex (women vs men), marital status (unmarried/divorced vs married), education level (≤ high school vs > college), annual income in US dollars (<$50,000 vs ≥$50,000), and household composition (living alone vs living with others); 2) fall status in the past 12 months (yes vs no); and 3) physical composite scale (PCS) score and mental composite scale (MCS) score from the 12-Items Health Outcome Survey Short Form (SF-12).Citation21 Validated general health measures of comorbidity were assessed by calculating modified Charlson comorbidity score (0–32). A higher Charlson comorbidity score indicates an increased severity of condition.Citation22 The presence of depressive symptoms was derived from the 20-item Center for EpidemiologiStudies Depression instrument.Citation23 The range of possible values for scale scores is 0–60, with the higher scores (≥16) indicating more symptoms.Citation23 The SF-12 was used to assess the participant’s physical and mental health. It comprises 12 questions represented by PCS and MCS scores. The range of possible values for SF-12 final scores is 0–100. Higher scores indicate a better health status.Citation24
Statistical analysis
Chi-square, analysis of variance, and post hoc Tukey’s tests were used to examine the covariates of the participants according to KP frequency and obesity status at baseline. General linear mixed models were used to examine the associations of baseline frequent KP and obesity status as independent variables, and GS as a dependent variable (outcome), over a 6-year period. We used autoregressive covariance matrices in a general linear mixed model using MIXED procedure; this approach uses all available data on each subject and allows for the usage of realistic variance and correlation patterns.Citation25 The mixed model allowed us to make inferences about the follow-up by modeling and estimating the components. Furthermore, this model made greater use of incomplete data, such as that obtained from participants who dropped out or missed the scheduled follow-up.Citation26
Two mixed models were constructed to assess the relationship between frequent KP and obesity status at baseline and over a 6-year follow-up period. Model 1 included group, time, age, sex, race, marital status, education, household composition, income, and fall status. Model 2 included all of the variables in Model 1 plus comorbidity, depressive symptoms, PCS score, and MCS score. All models used an interaction term between KP frequency and obesity status and time.
The principal reason to incorporate a covariate in the analysis was the presence of strong or moderate relationship between the covariate and the outcome measure as suggested in the literature.Citation27 The analyses were performed using SAS for Windows, Version 9.2 (SAS Institute, Inc., Cary, NC, USA).
Results
summarizes the demographic characteristics of the study population according to group. The participants were classified (3,118) into four categories according to KP frequency and obesity status at baseline as follows: no KP and nonobese (n=504; 16.2%), frequent KP and nonobese (n=2,187; 70.1%), no KP and obese (n=201; 6.4%), and frequent KP and obese (n=226; 7.3%). The overall mean age and standard deviation were 61.2±9.1 at baseline. Fifty-eight percent of the participants were women, 34% were unmarried or divorced, and 18% had either less than or equal to high school degrees. The average comorbidity score was 0.43±0.9. The average mean PCS and MCS scores were 50.8±8.3 and 53.9±7.6, respectively. Thirty-eight percent of the participants reported incomes of <$50,000 per year, and 33% had fallen in the past 12 months. The participants with frequent KP and obesity were significantly more likely to be younger, to report fewer depressive symptoms, and to have poorer physical health compared with the participants without KP who were nonobese. Four groups were significantly (P<0.0001) different from one another ().
Table 1 Characteristics of the study participants with respect to knee pain and obesity status at baseline (N=3,118)
The general linear mixed model estimates for GS (m/s) over time for the four groups as a function of the presence or absence of frequent KP and obesity status at baseline are presented in . In Model 1, after adjusting for socio-demographic variables (ie, age, sex, race, marital status, household composition, income, and fall status), the obese participants with frequent KP were most significantly associated (P<0.0001) with decreased GS (β [95% CI]: −0.11 [−0.14 to −0.08]), followed by the nonobese participants with frequent KP (β [95% CI]: −0.095 [−0.11 to −0.07]) and the obese participants with no KP (β [95% CI]: −0.094 [−0.12 to −0.06]); the nonobese participants with no KP were not associated with decreased GS. In Model 2, after controlling for depressive symptoms, comorbidity, PCS score, and MCS score, together with the variables in Model 1, the nonobese participants who reported frequent KP (β [95% CI]: −0.06 [−0.07 to −0.04]), the obese participants who had no KP (β [95% CI]: −0.07 [−0.1 to −0.04]), and the participants with both conditions (β [95% CI]: −0.08 [−0.1 to −0.05]) were all significantly associated (P<0.0001) with decreased GS. The interaction term between the groups (nonobese and frequent KP, obese and no KP, and obese and frequent KP) and the time of follow-up (GS score over 6 years) was not statistically significant in any of the models. This lack of significance indicated an unchanged slope, meaning that the average GS of the participants decreased only slightly by 0.002 m/s/yr.
Table 2 General linear mixed models for estimating gait speeds (m/s) over time in four groups as a function of the presence or absence of frequent knee pain and obesity status at baseline (N=3,118)
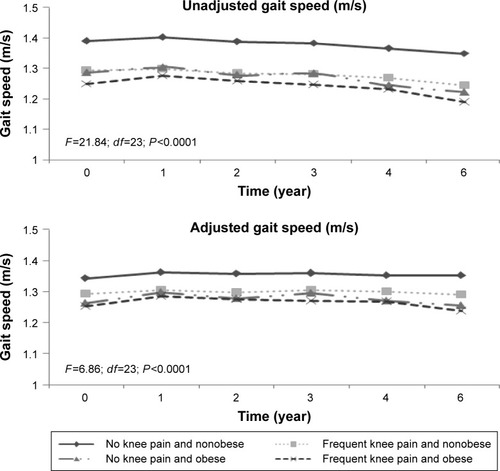
shows the unadjusted and adjusted GSs over the 6-year period according to KP frequency and obesity status at baseline. Over the entire follow-up period, compared with the reference group, the participants with both conditions exhibited the slowest average GS, followed by the nonobese participants with frequent KP and participants with no KP and obese. There was a significant interaction effect between time and GS using the four groups (frequent KP and/or obesity status) on even the adjusted model (F=6.86, P<0.0001). Moreover, the participants in all groups exhibited stable GSs over a 6-year follow-up period ().
Figure 2 Unadjusted and adjusted gait speed scores as a function of the presence or absence of frequent knee pain and obesity status at baseline (N=3,118) over a 6-year follow-up period.
Discussion
The current study aimed to examine the relationship between KP frequency, obesity, and GS over time among adults. We found that older adults who had frequent KP alone, obesity alone, or both conditions at baseline were associated with decreased GS after controlling for all covariates. No association was found between GS and time, even after controlling for all covariates.
We found it noteworthy that those with both conditions were more strongly influenced by decreases in GS than those with no KP and who were not obese. Interestingly, our study finding additionally revealed that the KP frequency and nonobese had a faster GS than those with no KP but who were obese. Evidence backing obesity was associated with comorbidities and excessive load on knee joints that can contrarily influence on shorter step length that prompts slower GS.Citation28 However, previously reported evidence also suggests that obese individuals exhibit slower GSs than nonobese individuals. Other personal and health factors that are known to influence GS include sex, race, depressive symptoms, and comorbidities.Citation29 In our study, the mean age of the participants with both conditions (59 years) was <3 years than that of the nonobese participants with no KP (63 years). Thus, age did not influence estimated GS, possibly because frequent KP and obesity exhibited stronger influences on gait than age.
When interpreting our findings, it should be noted that the outcome rate of change in GS as a function of KP frequency and obesity status at baseline was of small magnitude over time (0.002 m/s/yr). It shows that there was no decrease in GS over time because of either KP frequency or obesity condition in each group was almost just as impacted on GS. Previous studies have demonstrated that a 0.10 m/s decline in GS (1.40–1.30 m/s) is a meaningful decline in older adults.Citation30 In the clinic, GS cutoff values of 0.6–1.0 m/s have been used to categorize older adult patients as slow, intermediate, or fast walkers.Citation31 A GS >1.0 m/s has been identified as an indicator of reduced health risk and better survival in healthy older adults.Citation32 Thus, our study indicated that there was no meaningful decline in GS among older adults with frequent KP, obesity, or both.
Our results are similar to those of previous studies that have demonstrated independent associations between KP, obesity, and GS.Citation33–Citation35 White et al conducted a multicenter OA cohort study and found that obesity has an important association with slow GS independent of KP.Citation33 In a cross-sectional study, Vincent et al found an association between KP, obesity, and fear of movement.Citation34 Metcalf published an article in Everyday Health with findings similar to our own regarding how both KP and obesity influence gait, particularly in women.Citation36 However, to the best of our knowledge, no studies have examined the association of both conditions together (frequent KP and obesity) with GS among older adults.
Implications
GS is a key indicator of health status and a strong predictor of morbidity and mortality in older adults.Citation11 Therefore, identifying risk factors associated with slow GS in older adults is a critical public health priority. A cross-sectional study by Aoyagi et alCitation37 supports a link between obesity and KP. The knee joint is exposed to high compressive loads that can exceed three times those produced by body weight during walking in healthy weight adults.Citation38 The load on the knee joint increases as body weight increases. Thus, multicomponent weight loss interventions (ie, diet plus aerobic exercise plus resistance exercise) have been demonstrated to exhibit beneficial effects in terms of reducing KPCitation39 and improving GS in obese older adults.Citation40 The European League Against Rheumatism encourages weight loss interventions for older adults with KP and obesity; such interventions are effective in reducing adverse joint loading,Citation41 relieving musculoskeletal pain,Citation42 and improving GSCitation43 in older adults with frequent KP, the obese, and those with both conditions.
Study limitations
First, KP was measured based on self-reports and was only assessed at baseline, which raises the possibility of recall bias. Second, most of the participants were Caucasians. Therefore, extrapolation of the results to other races may not be relevant. Third, the participants’ medical records, radiologic imaging results, and blood tests were not available for confirmation purposes.Citation44 Information about muscle strength and efficiency of energy utilization in association with GS in older adults could therefore not be assessed. Finally, our findings apply to older adults and cannot be generalized to a normal young population. The strengths of this study include the diverse and large sample of older adults either with or at high risk of knee OA, the longitudinal and long-term follow-up, and the objective measurement of the outcome. To measure the outcome, we used a 20 m timed walk test, which is widely used to assess GS in older adults and has been validated for patients with self-reported KP as well as those with obesity. Another important strength of our study is its use of mixed models, an analytical approach that facilitated the inclusion of all available data.
Conclusion
The purposes of this study were to examine the relationship between self-reported frequent KP and obesity and to relate the results to objective measures of GS in older adults. The findings suggest that individuals with frequent KP alone, obesity alone, or both conditions combined have significantly reduced GS compared with nonobese individuals with no KP. This was true even after adjusting for sociodemographic and health variables. No association was found between GS and time in any of the four study groups, even after controlling for all covariates. This lack of association indicates an unchanged slope for the data. Additional studies are needed to verify the effects of frequent KP and obesity on GS in older adults.
Acknowledgments
The OAI is a public–private partnership comprised of five contracts (N01-AR-2-2258, N01-AR-2-2259, N01-AR-2-2260, N01-AR-2-2261, and N01-AR-2-2262) funded by the National Institutes of Health, a branch of the Department of Health and Human Services, and conducted by the OAI Study Investigators. This manuscript was prepared using an OAI public use data set and does not necessarily reflect the opinions or views of the OAI investigators, the NIH, or the private funding partners. The author extends his appreciation to the Research Centre, College of Applied Medical Sciences, and the Deanship of Scientific Research at King Saud University for funding this research.
Disclosure
The author reports no conflicts of interest in this work.
References
- FelsonDTLawrenceRCDieppePAOsteoarthritis: new insights. Part 1: the disease and its risk factorsAnn Intern Med2000133863564611033593
- ThiemULamsfussRGuntherSPrevalence of self-reported pain, joint complaints and knee or hip complaints in adults aged >/= 40 years: a cross-sectional survey in Herne, GermanyPLoS One201384e6075323646102
- EttingerWHJrBurnsRMessierSPA randomized trial comparing aerobic exercise and resistance exercise with a health education program in older adults with knee osteoarthritis. The Fitness Arthritis and Seniors Trial (FAST)JAMA1997277125318980206
- AndriacchiTPKooSScanlanSFGait mechanics influence healthy cartilage morphology and osteoarthritis of the kneeJ Bone Joint Surg Am200991suppl 19510119182033
- WhiteDKNiuJZhangYIs symptomatic knee osteoarthritis a risk factor for a trajectory of fast decline in gait speed? Results from a longitudinal cohort studyArthritis Care Res (Hoboken)201365218719422899342
- LeeYKimJHanESRyuMChoYChaeSFrailty and body mass index as predictors of 3-year mortality in older adults living in the communityGerontology201460647548224993678
- NoceraJBufordTWManiniTMThe impact of behavioral intervention on obesity mediated declines in mobility function: implications for longevityJ Aging Res2011201139251022013527
- LaiPPLeungAKLiANZhangMThree-dimensional gait analysis of obese adultsClin Biomech (Bristol, Avon)200823suppl 1S2S6
- SummersMNHaleyWEReveilleJDAlarcónGSRadiographic assessment and psychologic variables as predictors of pain and functional impairment in osteoarthritis of the knee or hipArthritis Rheum19883122042093348824
- GuralnikJMFerrucciLPieperCFLower extremity function and subsequent disability: consistency across studies, predictive models, and value of gait speed alone compared with the short physical performance batteryJ Gerontol A Biol Sci Med Sci2000554M221M23110811152
- StudenskiSPereraSPatelKGait speed and survival in older adultsJAMA20113051505821205966
- FiserWMHaysNPRogersSCEnergetics of walking in elderly people: factors related to gait speedJ Gerontol A Biol Sci Med Sci201065121332133720679072
- LaRocheDPGreenleafBLCroceRVMcGaughyJAInteraction of age, cognitive function, and gait performance in 50–80-year-oldsAge (Dordr)2014364969325073454
- HartzAJFischerMEBrilGThe association of obesity with joint pain and osteoarthritis in the HANES dataJ Chronic Dis19863943113193958117
- MessierSPDaviesABMooreDTDavisSEPackRJKazmarSCSevere obesity: effects on foot mechanics during walkingFoot Ankle Int199415129347981793
- NevittMFelsonDLesterG webpage on the InternetThe Osteoarthritis Initiative: Protocol for the Cohort Study Available from: http://oai.epi-ucsf.org/datarelease/docs/StudyDesignProtocol.pdfAccessed December 27, 2015
- CreamerPLethbridge-CejkuMCostaPTobinJDHerbstJHHochbergMCThe relationship of anxiety and depression with self-reported knee pain in the community: data from the Baltimore Longitudinal Study of AgingArthritis Care Res19991213710513484
- BlakeVAAllegranteJPRobbinsLRacial differences in social network experience and perceptions of benefit of arthritis treatments among New York City Medicare beneficiaries with self-reported hip and knee painArthritis Rheum200247436637112209481
- SahyounNRMaynardLMZhangXLSerdulaMKFactors associated with errors in self-reported height and weight in older adultsJ Nutr Health Aging200812210811518264637
- MansourniaMADanaeiGForouzanfarMHEffect of physical activity on functional performance and knee pain in patients with osteoarthritis: analysis with marginal structural modelsEpidemiology201223463164022415107
- AndresenEMMeyersARHealth-related quality of life outcomes measuresArch Phys Med Rehabil20008112 suppl 2S30S4511128902
- KatzJNChangLCSanghaOFosselAHBatesDWCan comorbidity be measured by questionnaire rather than medical record review?Med Care199634173848551813
- RadloffLThe CES-D Scale: a self-report depression scale for research in the general populationAppl Psychol Meas19771385401
- WareJJrKosinskiMKellerSDA 12-Item Short-Form Health Survey: construction of scales and preliminary tests of reliability and validityMed Care19963432202338628042
- ZegerSLLiangKYLongitudinal data analysis for discrete and continuous outcomesBiometrics19864211211303719049
- BartolucciFFarcomeniAA discrete time event-history approach to informative drop-out in mixed latent Markov models with covariatesBiometrics201471808925227970
- CnaanALairdNMSlasorPUsing the general linear mixed model to analyse unbalanced repeated measures and longitudinal dataStat Med19971620234923809351170
- MessierSPOsteoarthritis of the knee and associated factors of age and obesity: effects on gaitMed Sci Sports Exerc19942612144614527869877
- MarcumZAZhanHLPereraSMooreCGFitzgeraldGKWeinerDKCorrelates of gait speed in advanced knee osteoarthritisPain Med20141581334134225040666
- KwonSPereraSPahorMWhat is a meaningful change in physical performance? Findings from a clinical trial in older adults (the LIFE-P study)J Nutr Health Aging200913653854419536422
- StudenskiSPereraSWallaceDPhysical performance measures in the clinical settingJ Am Geriatr Soc200351331432212588574
- CesariMKritchevskySBPenninxBWPrognostic value of usual gait speed in well-functioning older people – results from the Health, Aging and Body Composition StudyJ Am Geriatr Soc200553101675168016181165
- WhiteDKNeogiTZhangYThe association of obesity with walking independent of knee pain: the multicenter osteoarthritis studyJ Obes2012201226197422645666
- VincentHKLambKMDayTITillmanSMVincentKRGeorgeSZMorbid obesity is associated with fear of movement and lower quality of life in patients with knee pain-related diagnosesPM R20102871372220709300
- BindawasSMVennuVLongitudinal effects of physical inactivity and obesity on gait speed in older adults with frequent knee pain: data from the osteoarthritis initiativeInt J Environ Res Public Health20151221849186325664695
- MetcalfE webpage on the InternetObesity and Knee Pain: Carrying Too Much Body Weight Can Do Real Damage to Your Knees – and Set You Up for a World of Pain. Here’s Why Available from: http://www.everydayhealth.com/knee-pain/obesity-and-knee-pain.aspxAccessed December 27, 2015
- AoyagiKRossPDOkanoKAssociation of body mass index with joint pain among community-dwelling women in JapanAging Clin Exp Res200214537838112602572
- SchippleinODAndriacchiTPInteraction between active and passive knee stabilizers during level walkingJ Orthop Res1991911131191984041
- McGoeyBVDeitelMSaplysRJKlimanMEEffect of weight loss on musculoskeletal pain in the morbidly obeseJ Bone Joint Surg Br19907223223232138158
- ChomentowskiPDubeJJAmatiFModerate exercise attenuates the loss of skeletal muscle mass that occurs with intentional caloric restriction-induced weight loss in older, overweight to obese adultsJ Gerontol A Biol Sci Med Sci200964557558019276190
- MessierSPLoeserRFMitchellMNExercise and weight loss in obese older adults with knee osteoarthritis: a preliminary studyJ Am Geriatr Soc20004891062107210983905
- TaylorCJLayaniLLaparoscopic adjustable gastric banding in patients > or =60 years old: is it worthwhile?Obes Surg200616121579158317217633
- JordanKMArdenNKDohertyMStanding Committee for International Clinical Studies Including Therapeutic Trials ESCISITEULAR Recommendations 2003: an evidence based approach to the management of knee osteoarthritis: report of a Task Force of the Standing Committee for International Clinical Studies Including Therapeutic Trials (ESCISIT)Ann Rheum Dis200362121145115514644851
- OkuraYUrbanLHMahoneyDWJacobsenSJRodehefferRJAgreement between self-report questionnaires and medical record data was substantial for diabetes, hypertension, myocardial infarction and stroke but not for heart failureJ Clin Epidemiol200457101096110315528061