
 ?Mathematical formulae have been encoded as MathML and are displayed in this HTML version using MathJax in order to improve their display. Uncheck the box to turn MathJax off. This feature requires Javascript. Click on a formula to zoom.
Abstract
Objective
This cross-sectional study compared three tools for predicting painful new osteoporotic vertebral fractures (PNOVFs) in older Chinese men: bone mineral density (BMD), the Osteoporosis Self-Assessment Tool for Asians (OSTA), and the World Health Organization fracture risk assessment tool (FRAX) (without BMD).
Methods
Men aged ≥50 years were apportioned to a group for men with fractures who had undergone percutaneous vertebroplasty (n=111), or a control group of healthy men (n=385). Fractures were verified on X-ray and magnetic resonance imaging. BMD T-scores were determined by dual energy X-ray absorptiometry. Diagnosis of osteoporosis was determined by a BMD T-score of ≤2.5 standard deviations below the average for a young adult at peak bone density at the femoral neck, total hip, or L1–L4. Demographic and clinical risk factor data were self-reported through a questionnaire. BMD, OSTA, and FRAX scores were assessed for identifying PNOVFs via receiver-operating characteristic (ROC) curves. Optimal cutoff points, sensitivity, specificity, and areas under the ROC curves (AUCs) were determined.
Results
Between the men with fractures and the control group, there were significant differences in BMD T-scores (at femoral neck, total hip, and L1–L4), and OSTA and FRAX scores. In those with fractures, only 53.15% satisfied the criteria for osteoporosis. Compared to BMD or OSTA, the FRAX score had the best predictive value for PNOVFs: the AUC of the FRAX score (cutoff =2.9%) was 0.738, and the sensitivity and specificity were 82% and 62%, respectively.
Conclusion
FRAX may be a valuable tool for identifying PNOVFs in older Chinese men.
Introduction
Low-trauma fracture, often due to a fall but even occurring during sleep, is the ultimate consequence of osteoporosis. This is a major public health problem not only in postmenopausal women, but also in older men. In particular, the burden of osteoporotic vertebral fractures is substantial to individuals, families, and society.Citation1
Patients with recently acquired painful vertebral compression fractures have a higher rate of morbidity and mortality compared with the general population.Citation1 A person with osteoporosis or fracture is not likely to regain full bone strength, because the loss in bone microarchitecture is irreversible.Citation2 It is therefore of paramount importance to identify individuals, men and women, who are at risk of developing osteoporosis, and to prevent the first fracture.
Male osteoporosis is largely neglected in the People’s Republic of China, although it has been shown in other countries that men suffer a higher mortality rate from hip fractures.Citation3,Citation4 Pharmacological interventions are available to treat postmenopausal osteoporosis,Citation5 but relatively few men are suspected to have the disease – pain may not be recognized as a fracture, and medical imaging may provide too little information or be unavailable.
Many previous studies have shown that osteoporotic fracture is associated with low bone mineral density (BMD), and in current clinical practice BMD measurements are considered the gold standard for determining the degree of bone loss and a diagnosis of osteoporosis.Citation6–Citation8 Unfortunately, not all fractures can be explained by the patient’s BMD, and furthermore a correlation between BMD and future fractures has not been definitively established. In fact, some researchers have found that some fractures occur with BMD values above the osteoporotic range, in both men and women,Citation9–Citation11 and that BMD accounted for only 65% of the observed variation in bone strength.Citation10 Many cases of osteoporosis have been misdiagnosed, escaped diagnosis, or were difficult to diagnose based on the BMD T-score alone (−2.5 or lower).Citation12,Citation13 In particular, although the link between low BMD and risk of fracture holds true for both men and women,Citation14 it remains controversial whether the diagnostic T-score cutoff of −2.5 or lower for osteoporosis is applicable to men. There is also evidence that BMD accounts for only 70% of bone strength, and bone strength is a better criterion for evaluating the risk of osteoporotic fracture.Citation15
It is generally accepted that a history of prior fracture at any site is an important risk factor for subsequent fractures.Citation16 While it is inaccurate to identify the risk of fracture based simply on BMD, the high cost of central dual-energy X-ray absorptiometry (DXA) and magnetic resonance imaging (MRI) prohibit their widespread use for preliminary screening in primary hospitals. An appropriate screening tool is thus urgently needed for identifying osteoporosis in patients, especially to aid physicians with limited professional experience and equipment. The Osteoporosis Self-Assessment Tool for Asians (OSTA) developed by Koh et alCitation17 is based on age and body weight. OSTA is a good and simple tool, with high sensitivity and acceptable specificity, for assessing the risk of osteoporosis in postmenopausal Asian women. In addition, OSTA may be helpful to identify postmenopausal women with vertebral deformity and painful new osteoporotic vertebral fractures (PNOVFs).Citation18,Citation19 However, sufficient confirmed validation of OSTA for identifying PNOVFs in men is lacking.
In 2008, the World Health Organization (WHO) introduced the fracture risk assessment tool (FRAX) (http://www.sheffield.ac.uk/FRAX) to evaluate patients’ absolute risk of osteoporotic fracture. To predict an individual’s 10-year probability of major osteoporotic fractures, or for hip fracture only, FRAX considers the interaction of multiple risk factors such as age, sex, and personal and family history. The risk factors may be analyzed with or without including BMD data.Citation20 Furthermore, fracture rates differ greatly among countries, and FRAX can be calibrated to weigh risk factors according to country.Citation21 Yet, in the few years that FRAX has been available, studies are lacking regarding its ability to predict the 10-year incidence of fractures in men,Citation22,Citation23 including men in the People’s Republic of China.
The present study assessed and compared BMD, OSTA, and FRAX (10-year probability, without BMD) for predicting PNOVFs in an older Chinese male population.
Materials and methods
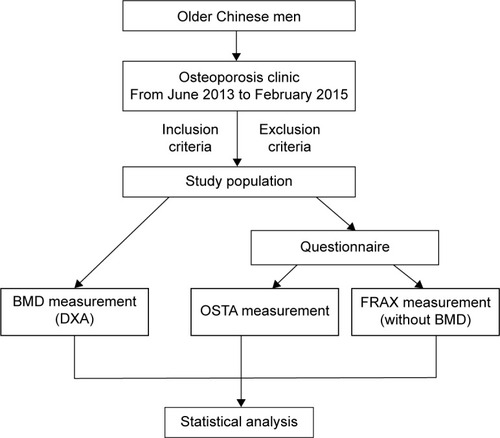
The Ethics Committee of Beijing Friendship Hospital, Capital Medical University approved this cross-sectional study, and all subjects provided signed informed consent. The flow diagram of the study was showed in .
Figure 1 The flow diagram of the study.
Study population
The study population included Chinese men aged ≥50 years consecutively recruited from the Osteoporosis Clinic at Beijing Friendship Hospital from June 2013 to February 2015. The men comprised clinically symptomatic patients with painful vertebral fractures verified by X-ray and MRI within the past 6 months who came for further examination and treatment (the fracture group); and healthy men who came to the hospital for routine health examinations (the control group). Many clinicians consider the presence of a fragility fracture as sufficient for diagnosis of osteoporosis, regardless of the patient’s BMD. Although bone densitometry is useful for assessing disease severity and monitoring therapy in patients with fractures, densitometry is not essential for the diagnosis of osteoporosis in this setting.Citation24 Thus, the men in the fracture group of this study were considered to have osteoporosis and PNOVF regardless of whether the BMD T-score was −2.5 standard deviations or less.
Men in both the fracture and control groups conformed to the following inclusion criteria: aged ≥50 years; Han Chinese nationality; residing in Beijing ≥20 years; willing to participate in the study, and able to read the informed consent form.
Excluded was anyone with a history or evidence of metabolic bone disease (eg, type I diabetes, hyper- or hypoparathyroidism, Paget’s disease, osteomalacia, renal osteodystrophy, or osteogenesis imperfecta); history of organ transplant; cancer with metastasis to the bone; significant renal impairment; a condition of prolonged immobility (spinal cord injury, Parkinson’s disease, stroke, muscular dystrophy, or ankylosing spondylitis); or prior use of anti-resorptives (eg, bisphosphonate, estrogen, selective estrogen receptor modulators, and calcitonin) or anabolic agents (eg, fluoride or parathyroid hormone).
BMD measurements and identification of PNOVFs
All the enrolled men were invited to the Osteoporosis Clinic at Beijing Friendship Hospital for BMD measurements of the hip and spine, taken by DXA. The subjects were asked by a trained interviewer to fill in a questionnaire providing information pertaining to demographics and clinical risk factors for osteoporosis. Height was measured with a stadiometer (Mahr GmbH, Gottingen, Germany). Weight was measured using an electronic balance (Tanita, Tokyo, Japan), with the subjects in light-weight indoor clothing and without shoes.
DXA (Discovery Wi, QDR series, Hologic, Waltham, MA, USA) was used to measure the BMD of the lumbar spine (L1–L4) and left femur (ie, the femoral neck, trochanter, Ward’s triangle, and total hip) on the left side. If the left side was previously replaced or fractured, the right side was measured. To standardize measurements, a quality assurance scan was performed daily before each measurement. The in vivo short-term reproducibility values for the machine at the lumbar spine, femoral neck, and total hip for these men were all lower than 1%. All DXA scans were conducted by the same well-trained and qualified technologist throughout this study. The BMD T-scores were automatically calculated by the system. The T-scores were calculated using the mean BMD values of young Chinese men as reference:Citation25 L1–L4, 1.017±0.117 g/cm2; femoral neck 0.909±0.116 g/cm2; and total hip 0.993±0.121 g/cm2.
We defined four requisite clinical criteria to confidently identify PNOVFs. These criteria were as follows:Citation19 1) men aged ≥50 years, without trauma history or with a low-trauma fracture history. Low-energy trauma fracture was defined as a fracture resulting from a fall from a standing position or lower. 2) Experiencing back or low back pain within 6 months before the BMD measurement. 3) Relevant clinical signs of acute or sub-acute vertebral fractures, assessed by X-ray and MRI. On X-ray, signs included height loss in the anterior, middle, or posterior dimension of a vertebral body >20% of the vertebral body’s area in a lateral-view image of the thoracic/lumbar spine; or the presence of endplate deformities, a lack of parallelism of the endplates, and a generally altered appearance relative to neighboring vertebrae. On MR images, signs of acute or sub-acute vertebral fractures included new bone marrow edema on sagittal T1-weighted and fat-suppressed T2-weighted images. 4) No history or evidence of metabolic osteopathy or cancer.
OSTA score
The OSTA was calculated based on age and body weight using the following formula:Citation17
The decimal digits of the calculation results were then disregarded. For example, a 73-year-old man whose body weight was 55 kg would have an OSTA index of −3.
FRAX score
FRAX is a computer-based algorithm (http://www.shef.ac.uk/FRAX) for determining models of fracture probability in men and women. The parameters are the appropriate clinical risk factors.Citation26 The 10-year fracture probability can be derived either from the clinical risk factors alone or, to enhance fracture risk prediction, the clinical risk factors combined with the femoral neck BMD. In addition to the clinical risk factors, the fracture probability varies markedly in different regions of the world. Thus, the FRAX models need to be calibrated to those regions where the epidemiology of fracture and death is known. FRAX models are available for the mainland China. Because we mainly focused on the ability of the FRAX tool to identify painful new vertebral compression fractures for this study, the 10-year probability of major osteoporotic fracture was obtained without the BMD measurement.
Statistical analysis
Osteoporosis is defined as a T-score (lumbar spine, femoral neck, or total hip) that is −2.5 standard deviations or lower than that of the average young adult, according to the WHO criteria. In the present study, descriptive statistics for demographic and baseline characteristics are presented as mean ± standard deviation for continuous variables, or percentage for categorical variables. The measured data are described as mean ± standard deviation when the data were normally distributed, and otherwise as the median and interquartile range. The chi-squared test was used to compare count data.
The differences in the BMD, OSTA, and FRAX scores between the fracture and control groups were tested using the 2-independent-samples t-test if normally distributed and with homogeneity of variance; and otherwise with the Mann–Whitney U-test. The validation of the three tools to identify PNOVFs was evaluated through receiver-operating characteristic (ROC) curve analysis, which plots sensitivity against (1 – specificity). The predictive value of the tools was determined according to the area under the ROC curve (AUC) as follows: non-predictive, AUC <0.5; less predictive, 0.5< AUC <0.7; moderately predictive, 0.7< AUC <0.9; highly predictive, 0.9< AUC <1; and perfectly predictive, AUC =1.Citation27,Citation28 The ROC curve was constructed, and the AUC and its 95% confidence interval (CI) were estimated using SPSS version 17.0 (SPSS Inc., Chicago, IL, USA) and Med-Calc version 11.5.0.0 (MedCalc Software, Ostend, Belgium). A P-value <0.05 was considered statistically significant.
Results
A sample of 509 men aged ≥50 years initially participated in this study. Thirteen subjects were excluded from the study in accordance with the exclusion criteria, so that 496 subjects were analyzed (). These included 111 men who had suffered a painful vertebral fracture within 6 months before the BMD measurement (the fracture group) and 385 healthy men without specific osteoporosis-associated symptoms.
Table 1 Summary of descriptive characteristics of the fracture and control groupsTable Footnotea
Between the fracture and control groups, there were significant differences in weight, previous fracture, and BMDs of the femoral neck, total hip, and L1–L4 (). Specifically, the mean age was lower and the body mass index higher in the fracture group relative to the control group. Men in the fracture group had experienced significantly more previous fractures than did those in the control group, and the mean BMDs were lower.
Across the entire study population, body mass indices ranged from 14.17 kg/m2 to 35.06 kg/m2, with 5% (n=27) underweight, 42% (n=209) normal weight, and 53% (n=260) overweight or obese.Citation29 Previous fracture was recorded in 24% of the total sample (n=120), and 10% of subjects had a family history of osteoporosis (n=52). Current smokers made up 24% of the study population (n=118), and 18% reported an alcohol intake of ≥30 g/day (n=89). The prevalence of rheumatoid arthritis was 2% (n=12), with 5% of subjects (n=24) using oral glucocorticoids for >3 months at a prednisolone dose of ≥5 mg daily.
BMD T-scores and OSTA and FRAX indices
There were significant differences in BMD T-scores and FRAX and OSTA scores between the fracture and control groups (). The BMD scores of the total hip, femoral neck, and L1–L4, and the OSTA index of the fracture group, were significantly lower than that of the control group, and the FRAX index was much higher.
Table 2 BMD T-score, OSTA, and FRAX scores of the fracture and control groups
BMD T-scores
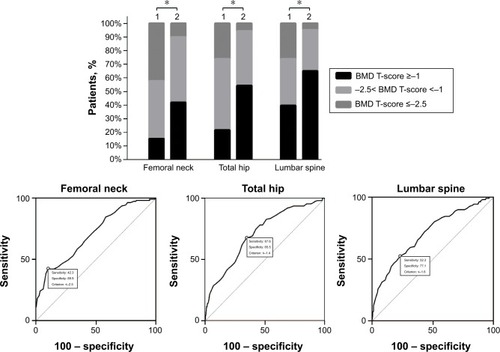
For the men in the fracture group, 42.3%, 26.1%, and 26.1%, respectively, were found to have osteoporosis at the femoral neck, total hip, and lumbar spine (based on BMD T-scores <−2.5; ). For the control group, these percentages were 10.1%, 5.7%, and 4.9%. The AUC of the BMD for estimating the risk of PNOVFs at the femoral neck, hip, and lumbar spine were 0.706, 0.711, and 0.706, with optimal cutoffs of −2.5, −1.4, and −1.6.
Figure 2 Proportions of BMD T-scores at different sites in the fracture and control groups, and ROC curve of the BMD measurement at different sites for identifying PNOVFs with optimal cutoff value.
Abbreviations: BMD, bone mineral density; ROC, receiver-operating characteristic; PNOVFs, painful new osteoporotic vertebral fractures.
Evaluation and comparison of BMD T-score, OSTA, and FRAX
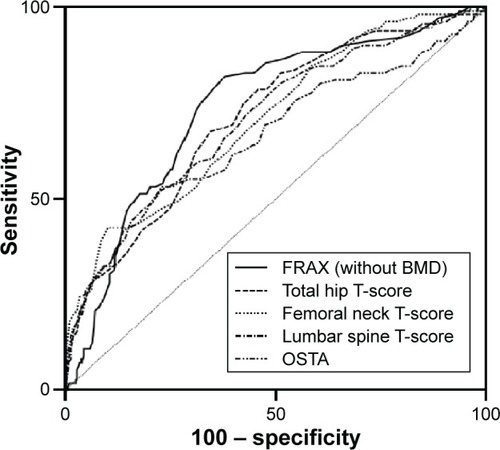
The AUCs of the BMD T-score to identify PNOVFs at the femoral neck, hip, and lumbar spine were, respectively, 0.706 (95% CI: 0.664–0.746, Z=7.339, P<0.001), 0.711 (95% CI: 0.669–0.751, Z=7.687, P<0.001), and 0.706 (95% CI: 0.664–0.746, Z=7.215, P<0.001). The cutoffs were −2.5, −1.4, and −1.6, respectively. For the OSTA tool, the AUC was 0.661 (95% CI: 0.618–0.703, Z=4.977; P<0.001) with a cutoff of −1.2 and sensitivity of 53.15%, specificity of 76.88%. The AUC of the FRAX tool (without BMD) was 0.738 with a cutoff of 2.9% (, ).
Table 3 AUC and sensitivity and specificity values of the FRAX, BMD T-score, and OSTA for identifying PNOVFs
Figure 3 Comparison of different AUCs (BMD T-score, OSTA, and FRAX for identifying PNOVFs).
Discussion
This study assessed and compared BMD, OSTA, and FRAX (10-year probability, without BMD) for predicting PNOVFs in Chinese men aged 50 years or above. Basing a diagnosis of osteoporosis on the criteria of the WHO (ie, a BMD T-score −2.5 or less), these tools were applied to men treated for PNOVFs and to a control group of healthy men.
Our study showed that for BMD, the AUC for estimating risk of fracture at the femoral neck, hip, and lumbar spine were 0.706, 0.711, and 0.706, respectively, with optimal cutoffs of −2.5, −1.4, and −1.6. This indicated that the BMD measurements were moderately predictive. For screening tools, high sensitivity (a high ratio of true positives to false positives) is more important than high specificity, as fewer patients will be subjected to unnecessary treatment or invasive diagnostic testing. Specificity also should be contained at reasonable levels to reduce unessential testing and the associated costs to the patient and community. However, our results showed that BMD had relatively low sensitivity for estimating risk of fracture, while specificity was acceptable. Therefore, a screening tool with higher sensitivity than BMD for identifying PNOVFs is desirable.
The OSTA, based on age and body weight, is a simpler tool than BMD measurements for assessing risk of osteoporosis in postmenopausal Asian women. A recent study reported that the OSTA index may also be a simple and effective marker for primary osteoporosis (defined at the femoral neck site by DXA) in older Chinese men,Citation30 but there has been no validation for predicting new osteoporotic vertebral fractures in this population. Our present study showed that the distribution of OSTA scores between the men with osteoporotic fractures and the healthy control group was significantly different. However, the discriminating ability of OSTA for identifying PNOVFs yielded a less predictive value than did the BMD (AUC, 0.5–0.7), with acceptable specificity (77%), and poor sensitivity (53%). Therefore, the performance of the OSTA index for identifying PNOVFs in older Chinese men appears to be less satisfactory than for postmenopausal women,Citation19 and might not be an effective tool for identifying PNOVFs.
The FRAX algorithms were developed for estimating the risk of osteoporotic fractures at the hip, spine, distal forearm, and shoulder over a 10-year period. It is applicable to men and women, is country-specific, does not require BMD measurements, and has been recommended by the WHO. Our present results indicate that FRAX (without BMD values) had the best discriminative ability for PNOVFs among the three tools we analyzed, with the best AUC value and good sensitivity and specificity. The AUC of FRAX for identifying the risk of PNOVFs was 0.738.
It should be noted that the optimal FRAX diagnostic cutoff value of 2.9% yielded a sensitivity of 81.98% and specificity of 62.08%. Compared with the present study, the results obtained from a cohort of Polish men designed by Pluskiewicz et alCitation22 indicated a better AUC of FRAX (0.808) for identifying the risk of major osteoporotic fractures. The optimal cutoff value was 7.6% with a lower sensitivity (70.64%) and higher specificity (77.36%). Cheung et alCitation31 previously reported that the AUC of FRAX with T-score was 0.728 for all major osteoporotic fractures in a cohort of Chinese postmenopausal women, and the optimal cutoff value was 8.1% that provided acceptable sensitivity (62.9%) and good specificity (72%).
Currently, FRAX has been included in two representative guidelines, one issued from the National Osteoporosis Foundation in the USA, and the other from the European Society for Clinical and Economic Aspects of Osteoporosis and Osteoarthritis. However, these guidelines differ in determining the intervention threshold of FRAX. The National Osteoporosis Foundation in the USA guideline proposed a fixed value of 20% for major osteoporotic fractures, or 3% for hip fractures at the ages 50 years and above. On the other hand, the European Society for Clinical and Economic Aspects of Osteoporosis and Osteoarthritis guideline for 10-year fracture probability for major osteoporotic fractures were age-dependent values for postmenopausal women of approximately 15%, 20%, and 30% at ages of 60, 70, and 80 years, respectively.Citation32
Of course, the optimal intervention threshold of FRAX is different in every country. The thresholds used are varied since they depend on local factors such as health economic assessment, absolute costs, willingness to pay for treatment of osteoporosis, and access to DXA.Citation33 For this reason, it will be important to define intervention thresholds on a country-by-country basis.
Among the tools tested in the present study, FRAX had the highest discriminating ability for predicting osteoporotic fractures, followed by BMD and OSTA. The AUC of the FRAX score (without BMD, cutoff =2.9%) to identify PNOVFs was 0.738, and the sensitivity and specificity were 82% and 62%, respectively. OSTA was not effective enough to evaluate the risk of PNOVFs. The deficiency of OSTA may be due to its simplicity, and because it was designed for identifying primary osteoporosis only. Although both primary and secondary osteoporosis can lead to osteoporotic fractures, it would inevitably underestimate the risk of osteoporotic fractures. As only a portion of the subjects in the fracture group of the present study suffered from osteoporosis according to the WHO criteria (), this implies that only the BMD measurement was limited in identifying PNOVFs. Therefore, bone strength may be better for evaluating the risk of osteoporotic fractures. Compared to OSTA and the BMD T-scores, the FRAX score (analyzed herein without BMD) had the best predictive value for PNOVFs in the present study.
Our study has several noteworthy strengths. First, our study was not retrospective, and all of the subjects’ ages and weights were recorded at the same time as the BMD measurements. Second, we imposed strict inclusion and exclusion criteria to exclude the effects of other factors. Third, our study was of great clinical importance, it could help physicians who lack experience in primary hospitals or community health service centers to detect vertebral fractures early. And what is more, the ability of FRAX to estimate fracture risk, with or without BMD, is a major advantage to clinicians with less training when choosing treatment options.
The present study had a few limitations. First, our data were collected only from subjects recruited at a single hospital and thus cannot fully represent the entire demographics in the People’s Republic of China. The population structure of our study may be different from the actual demographic profile of Beijing, which could affect the generalizability of these data. Second, it is inaccurate to define intervention thresholds without taking into account the setting for service provision and willingness to pay, as well as considerations of absolute costs. The results should be confirmed in other cohorts.
Conclusion
Our study found that neither BMD nor OSTA was effective enough to predict the risk of PNOVFs in clinical practice. FRAX may be an effective tool for determining a high risk of PNOVFs in older Chinese men, with a cutoff value of 2.9%.
Acknowledgments
The study was funded by the Capital Health Project (Z131100006813040), Beijing, People’s Republic of China. We thank Medjaden Bioscience Limited for assisting in the preparation of this manuscript.
Disclosure
The authors report no conflicts of interest to this work.
References
- JohnellOKanisJAAn estimate of the worldwide prevalence and disability associated with osteoporotic fracturesOsteoporos Int200617121726173316983459
- HochbergMPreventing fractures in postmenopausal women with osteoporosis. A review of recent controlled trials of antiresorptive agentsDrugs Aging200017431733011087009
- CenterJRNguyenTVSchneiderDSambrookPNEismanJAMortality after all major types of osteoporotic fracture in men and women: an observational studyLancet1999353915687888210093980
- CarpinteroPLopezPLeonFLluchMMonteroMAguileraCMen with hip fractures have poorer nutritional status and survival than women: a prospective study of 165 patientsActa Orthop200576333133516156459
- CompstonJEPharmacological interventions for post-menopausal osteoporosis: an evidence-based approachRheumatology (Oxford)200039121309131211136870
- RossPDDavisJWVogelJMWasnichRDA critical review of bone mass and the risk of fractures in osteoporosisCalcif Tissue Int19904631491612137720
- NguyenTSambrookPKellyPPrediction of osteoporotic fractures by postural instability and bone densityBMJ19933076912111111158251809
- CummingsSRBlackDMNevittMCBone density at various sites for prediction of hip fractures. The Study of Osteoporotic Fractures Research GroupLancet1993341883772758093403
- LangsetmoLGoltzmanDKovacsCSRepeat low-trauma fractures occur frequently among men and women who have osteopenic BMDJ Bone Miner Res20092491515152219338456
- SchuitSCvan der KliftMWeelAEFracture incidence and association with bone mineral density in elderly men and women: the Rotterdam StudyBone200434119520214751578
- SirisESChenYTAbbottTABone mineral density thresholds for pharmacological intervention to prevent fracturesArch Intern Med2004164101108111215159268
- SiffertRSLuoGMCowinSCKaufmanJJDynamic relationships of trabecular bone density, architecture, and strength in a computational model of osteopeniaBone19961821972068833215
- FrostHMOn our age-related bone loss: insights from a new paradigmJ Bone Miner Res19971210153915469333113
- KanisJADiagnosis of osteoporosis and assessment of fracture riskLancet200235993211929193612057569
- EkmanEFThe role of the orthopaedic surgeon in minimizing mortality and morbidity associated with fragility fracturesJ Am Acad Orthop Surg201018527828520435878
- KlotzbuecherCMRossPDLandsmanPBAbbottTA3rdBergerMPatients with prior fractures have an increased risk of future fractures: a summary of the literature and statistical synthesisJ Bone Miner Res200015472173910780864
- KohLKSedrineWBTorralbaTPA simple tool to identify Asian women at increased risk of osteoporosisOsteoporos Int200112869970511580084
- SaetungSOngphiphadhanakulBRajatanavinRThe relationship of an Asian-specific screening tool for osteoporosis to vertebral deformity and osteoporosisJ Bone Miner Metab2008261475218095063
- YangYWangBFeiQValidation of an osteoporosis self-assessment tool to identify primary osteoporosis and new osteoporotic vertebral fractures in postmenopausal Chinese women in BeijingBMC Musculoskelet Disord20131427124053509
- KanisJAJohnellOOdenAJohanssonHMcCloskeyEFRAX and the assessment of fracture probability in men and women from the UKOsteoporos Int200819438539718292978
- KanisJAOdenAJohanssonHBorgstromFStromOMcCloskeyEFRAX and its applications to clinical practiceBone200944573474319195497
- PluskiewiczWAdamczykPFranekEFRAX calculator and Garvan nomogram in male osteoporotic populationAging Male201417317418224456527
- AckmanJMLataPFSchunaAAElliottMEBone health evaluation in a veteran population: a need for the Fracture Risk Assessment Tool (FRAX)Ann Pharmacother201448101288129324994725
- LenchikLRogersLFDelmasPDGenantHKDiagnosis of osteoporotic vertebral fractures: importance of recognition and description by radiologistsAJR Am J Roentgenol2004183494995815385286
- YehLRChenCKLaiPHNormal bone mineral density in anteroposterior, lateral spine and hip of Chinese men in Taiwan: effect of age change, body weight and heightJ Chin Med Assoc200467628729515366406
- KanisJAOdenAJohnellOThe use of clinical risk factors enhances the performance of BMD in the prediction of hip and osteoporotic fractures in men and womenOsteoporos Int20071881033104617323110
- GreinerMPfeifferDSmithRDPrinciples and practical application of the receiver-operating characteristic analysis for diagnostic testsPrev Vet Med2000451–2234110802332
- SwetsJAMeasuring the accuracy of diagnostic systemsScience19882404857128512933287615
- ZhouBCooperative Meta-analysis Group of China Obesity Task ForcePredictive values of body mass index and waist circumference to risk factors of related disease in Chinese adult populationZhonghua Liu Xing Bing Xue Za Zhi2002231510 Chinese12015100
- YangYDongLiFeiQSelf-assessment Tool to Identify Primary Osteoporosis in Chinese Elderly MalesInternational Journal of Gerontology2015927176
- CheungEYBowCHCheungCLDiscriminative value of FRAX for fracture prediction in a cohort of Chinese postmenopausal womenOsteoporos Int201223387187821562875
- NakamuraTRecommendations of FRAX in clinical assessment of osteoporosis indicated in European and US guidelinesClin Calcium2009191217231728 Japanese19949262
- KanisJAJohnellOOdenAIntervention thresholds for osteoporosis in men and women: a study based on data from SwedenOsteoporos Int200516161415103452