
Abstract
Objective
People with type 2 diabetes are at an increased risk of hypertension, arteriosclerosis, heart disease, and stroke. Glucose intolerance (insulin resistance) is the main feature of type 2 diabetes. Obesity leads to insulin resistance, dyslipidemia, etc. The aim of this study was to assess the biochemical parameters and measures of obesity in type 2 diabetes mellitus (T2DM).
Methods
A total of 2,273 males and 6,547 females previously healthy volunteers (aged 41–95 years old) were recruited by open invitation. The basic information, including age, sex, height, weight, body mass index (BMI), waistline, hipline, menstrual cycle, and medical history, was collected by questionnaire survey and physical examination. Serum lipid profile, liver transaminase, blood glucose, postprandial blood glucose, and hemoglobin A1c were obtained after 12 hours of fasting.
Results
According to our results, diabetic patients presented serum lipid abnormality. Elevated triglyceride (TG) levels (≥1.7 mmol/L) were noted in 19.69% of males and 20.40% of females, and reduced high-density lipoprotein cholesterol (HDL-C) levels (≤1.15 mmol/L) were noted in 21.96% of males and 15.74% of females. The combination of elevated TG and reduced HDL-C was the most prevalent of the combined lipid abnormalities. In contrast, no differences were observed in the levels of low-density lipoprotein cholesterol and total cholesterol. Moreover, there were statistically significant differences in the levels of BMI and waistline between T2DM and non-T2DM participants. After adjustment for BMI, logistic regression analysis revealed that the subjects with BMI ≤20 kg/m2 and >30 kg/m2 had a significantly elevated hazard ratio of T2DM compared with participants having a BMI range of 20–30 kg/m2 in both males and females. However, there was a significant difference between T2DM patients and non-T2DM patients in waistline (χ2=8.57, P<0.001) than in BMI parameter (χ2=6.29, P<0.001).
Conclusion
The present study shows for the first time that low levels of HDL-C, high levels of TG, and abnormal levels in BMI and waistline increase the risk of type 2 T2DM in Chinese people.
Introduction
Type 2 diabetes mellitus (T2DM) is a well-known disease in both developing and developed countries. In addition to being a chronic disease, obesity is a key risk factor for T2DM, cardiovascular disease (CVD), hypertension, respiratory disease, and other chronic noninfectious diseases and is becoming an important global public health problem that leads to disability, which adversely affects the individual’s quality of life and increases his or her financial burden on the state.Citation1–Citation3 Even the prevalence of obesity in the People’s Republic of China is not as high as that in developed countries; however, in recent years, it has shown an epidemic trend, and obesity-related metabolic syndrome in the People’s Republic of China has received widespread attention.Citation4
To account for the correlation between obesity and T2DM, body mass index (BMI) has been introduced as a composite covariate for adjustment in T2DM studies. BMI is obtained by dividing weight by the square of height (ie, kg/m2). In developed countries, subjects with a BMI ≥25 kg/m2 are defined as overweight and those with a BMI ≥30 kg/m2 are defined as obese, and there are good associations and positive predictive effects between BMI and obesity-related chronic diseases.Citation5,Citation6 Even though BMI captures the degree of overweight and obesity, it ignores body fat distribution. Visceral fat tissue is metabolically more active than nonvisceral fat and secretes more hormones and cytokines, which might be important for the development of diabetes.Citation7,Citation8 It is a simple way to assess the levels of visceral fat using the measurement of waistline.Citation9
However, it is also reported that most patients with type 2 diabetes could have dyslipidemia at varying degrees, characterized by increased levels of triglyceride (TG) and decreased serum high-density lipoprotein cholesterol (HDL-C). When this characteristic lipid profile is seen in T2DM, it is referred to as diabetic dyslipidemia and confers a risk of CVD. Insulin resistance and T2DM are generally accompanied by low levels of HDL-C and high TG.Citation10–Citation12
Both obesity and dyslipidemia are closely related to T2DM and share a common pathogenesis associated with “insulin resistance”. However, the association between serum lipid profile, BMI, and T2DM has not been assessed simultaneously in both Chinese men and women. We aimed to investigate this relationship and make an evaluation of the serum lipid profile and BMI in Chinese patients with T2DM in this setting.
Methods
Subjects
A total of 10,300 subjects (2,665 males and 7,635 females aged 40–95 years) who voluntarily requested to be hospitalized for a 2-day complete physical check-up during 2012–2015 were enrolled in this study. The exclusion criteria for the present study were as follows: type 1 diabetes mellitus (DM), noninsulin-dependent DM, severe scoliosis, polio, hyper- or hypothyroidism, impaired renal function, significant chronic lung disease, apparently abnormal liver function, rheumatoid arthritis or collagen disease, malignancies, or a history of alcoholism, heavy smoking (>1 pack/d), hysterectomy, estrogen use, oophorectomy, and corticosteroid use. Finally, 2,273 healthy males aged 41–95 years (median 60 years) and 6,547 healthy females aged 41–95 years (median 57 years) were classified to be eligible for the present study. All the subjects came from a local population of Dalian city, which is located in the northern part of the People’s Republic of China. All the study subjects belonged to the Han Chinese ethnic group, which comprises ~90% of the total population of the People’s Republic of China. Before entering the project, all subjects signed informed consent documents, and the protocols for the study were reviewed and approved by the Ethics Committee of the Dalian Central Hospital (Dalian, People’s Republic of China). For each study subject, basic information, including age, sex, family history, inheritance history, and medical history, was obtained from self-administered questionnaires. The menstrual history of each woman was recorded during an individual interview. Menopause was defined as the absence of any menstrual cycle for at least 1 year. Height, weight, waistline, and hipline were measured during the interview, with subjects wearing light indoor clothes without shoes.
Laboratory measurement
The biochemical parameters, including fasting blood glucose (FBG), postprandial blood glucose (PBG), hemoglobin A1c (HbA1c), total cholesterol (TC), TG, and serum HDL-C, were measured using an Abbott Diagnostics C8000i autoanalyzer (Abbott Laboratories, Abbott Park, IL, USA) with commercial kits. Multigent direct assays were used to estimate serum low-density lipoprotein cholesterol (LDL-C) levels (Abbott Laboratories). The whole measurement procedure was supported by the Department of Clinical Laboratory in the hospital. As a test of the Abbott Diagnostics C8000i autoanalyzer and multigent direct assay’s precision, we measured blood from 15 individuals twice on the same day. The coefficient of variation for these subjects was 0.5% for FBG, 1.1% for PBG, 0.9% for HbA1c, 0.7% for TC, 1.2% for TG, 2.0% for HDL-C, and 1.5% for LDL-C.
Diagnosis criteria
FBG >7.0 mmol/L, PBG >11.1 mmol/L, and HbA1c >6.5% were used as the diagnosis criteria for T2DM. Subjects with a BMI ≥25 kg/m2 were defined as overweight and those with a BMI ≥30 kg/m2 were defined as obese.
Statistical analysis
Continuous variables were defined using median values and interquartile ranges (25th to 75th percentile) because they were not normally distributed. According to the China Adult Dyslipidemia Prevention Guide, variables were categorized as follows. We divided subjects into groups using stratified BMI levels. Subjects were classified by BMI into ≤17.5 kg/m2, 17.5–20 kg/m2, 20–22.5 kg/m2, 22.5–25 kg/m2, 25–27.5 kg/m2, 27.5–30 kg/m2, 30–32.5 kg/m2, and >32.5 kg/m2. BMI of 22.5–25 kg/m2 group was used as the reference to calculate hazard ratios (HRs) with 95% confidence intervals (CIs); HDL-C ≤1.15 mmol/L (1.54 mmol/L in males), ≥1.16 mmol/L (1.55 mmol/L in males); LDL-C <3.1 mmol/L, ≥3.1 mmol/L; TC ≤2.8 mmol/L, 2.8–5.17 mmol/L, ≥5.17 mmol/L; and TG ≤0.56 mmol/L, 0.56–1.7 mmol/L, ≥1.7 mmol/L. For comparison of two unpaired groups, unpaired t-test was used for data that follow normal distribution and homogeneity of variances. Homogeneity of variances was tested using Levene’s test. In case data were not normally distributed, nonparametric tests were used. Mann–Whitney and Kruskal–Wallis tests, respectively, were used for comparing two groups and more than two groups simultaneously. Groups for categorical variables were analyzed by chi-square or Fisher’s exact tests. Logistic regression was used to explore the risk factors of T2DM. The Statistical Package for the Social Sciences software (Version 21.0; IBM Corporation, Armonk, NY, USA) was used for statistical analysis. Statistical significance was accepted for a P-value of 0.05.
Results
Basic characteristics of the subjects and a comparison between males and females are listed in . Significant differences (P<0.001) in age, height, weight, BMI, waistline, hipline, FBG, PBG, creatinine, HDL-C, LDL-C, TC, alanine transaminase, aspartate aminotransferase, and glutamyltranspetidase were found between males and females.
Table 1 Basic characteristic of the subjects
According to the criteria, males and females were classified into two groups (diabetic and nondiabetic participants), and their characteristics are presented in . Significant differences between diabetic and normal groups were found. The basic characteristics, including age, weight, BMI, waistline, FBG, PBG, HDL-C, and HbA1c, had significant differences between diabetic and normal subjects. Here we found that diabetic patients had lower levels of HDL-C but higher levels of TG compared with nondiabetic participants. There was a strong relation between diabetic patients and nondiabetic subjects in waistline (χ2=8.57, P<0.001) than in BMI (χ2=6.29, P<0.001).
Table 2 Frequency of the BMI, waistline, FBG, PBG, lipid profile, and HbA1c in all subjects with and without diabetes
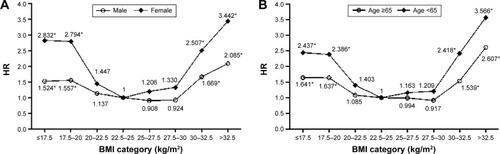
Furthermore, after adjustment for BMI, logistic regression analysis revealed that the subjects of BMI ≤20 kg/m2 and >30 kg/m2 had significantly elevated HR of diabetes compared with subjects having 20–30 kg/m2 in both males (BMI ≤17.5 kg/m2: HR 1.524, P<0.05; BMI 17.5–20 kg/m2: HR 1.557, P<0.05; BMI 30–32.5 kg/m2: HR 1.669, P<0.05; BMI >32.5 kg/m2: HR 2.085, P<0.05) and females (BMI ≤17.5 kg/m2: HR 2.832, P<0.05; BMI 17.5–20 kg/m2: HR 2.794, P<0.05; BMI 30–32.5 kg/m2: HR 2.507, P<0.05; BMI >32.5 kg/m2: HR 3.442, P<0.05, ). Among adults older than 65 years, both those with BMI ≤20 kg/m2 and >30 kg/m2 had a significantly elevated HR of diabetes compared with participants having 20–30 kg/m2 ().
Figure 1 Comparison of BMI (kg/m2) category-related HR changes between (A) males and females and (B) participants aged ≥65 and <65 years.
Abbreviations: BMI, body mass index; HR, hazard ratio; CI, confidence interval.
After serum lipid was adjusted, Mann–Whitney and Kruskal–Wallis tests in showed that diabetes was more prevalent in the class of lower HDL-C values (males: ≤1.15 mmol/L; females: ≤1.54 mmol/L) in both males and females. However, diabetes was more prevalent in the class of higher TG levels (≥1.7 mmol/L) in females; no significant correlation between diabetes and TG was found in males. In this study, no relationships were found between LDL-C, TC levels, and diabetes. When a logistic regression analysis was performed with the presence of T2DM as a dependent variable, males with HDL-C levels ≤1.15 mmol/L and females with HDL-C levels ≤1.54 mmol/L were found to be associated with the presence of T2DM (males: odds ratio 1.64, 95% CI 1.17–2.34, P<0.01; females: odds ratio 1.92, 95% CI 0.92–2.05, P<0.01) compared with HDL-C levels ≥1.16 mmol/L in males and ≥1.55 mmol/L in females even after adjusting for sex, age, height, weight, BMI, waistline, and serum creatinine levels (). We also found that a high TG level was also associated with the presence of T2DM (males: odds ratio 1.02, 95% CI 0.74–2.02, P<0.05; females: odds ratio 2.33, 95% CI 0.67–2.39, P<0.05).
Table 3 The incidence of diabetes in the stratified lipid profile levels
Table 4 Logistic regression of T2DM
In both sexes, the correlation (r=−0.350 in males, r=−0.352 in females) between DM and FBG was higher than that between DM and other impact factors. Even both body weight and BMI were positively correlated with diabetes. The correlation (r=−0.56) between DM and BMI in both males and females was higher than that between DM and body weight (r=−0.48). The result showed that the correlation (r=−0.080) between DM and waistline in both males and females was higher than that between DM and BMI (r=−0.073). HDL-C (r=0.105 in males, r=0.091 in females) and TG (r=−0.043 in males, r=−0.108 in females) were correlated with DM in both males and females. These relationships are shown in .
Table 5 Correlation coefficients among age, height, weight, BMI, waistline, hipline, FBG, HDL, LDL, TC, TG, and DM in males and females
Discussion
The global population is currently undergoing an upward shift in its age structure due to decreasing fertility rate and increasing life expectancy. Meanwhile, the incidence of T2DM is increasing sharply and is becoming a serious public health problem. We investigated the relationship between BMI, waistline, and blood lipid profiles with T2DM to improve its diagnosis and prevention and reduce not only a significant economic and societal burden but also a social burden on individuals.Citation13
Standards for the definition of obesity using BMI in western countries and the Asia-Pacific region are not the same. A previous study showed that relative risk of T2DM predicted by BMI was 1.18 (95% CI 1.16–1.20), which increased with increasing BMI.Citation14,Citation15 BMI and waistline serve as parameters to estimate general and abdominal fat masses, respectively. It is well known that the abdominal fat mass is of particular importance in the development of not only T2DM but also other chronic diseases, including CVDs and some forms of cancer.Citation16,Citation17 A previous study in Germany has found high prevalence for obesity (23.9%) and increased waistline (39.5%; males >102 cm, females >88 cm).Citation18 However, there is a strong relation between the two parameters, and the terms “general” and “abdominal” obesity are not mutually exclusive but designate overlapping fat compartments. It is well known that waistline is a more exact measure of visceral fat in individuals. At the same time, increased waistline also has a high correlation with T2DM, which was found in our present study. Moreover, our present study found that excessively high or low levels of BMI have high correlation with T2DM, which further resulted to testify the discovery from Kuo et al.Citation19 In males, there were no significant differences between BMI and waistline in T2DM. On the contrary, waistline had higher correlation with T2DM than BMI in Chinese females. There was a significant difference between DM patients and non-DM subjects in waistline (χ2=8.57, P<0.001) than in BMI parameter (χ2=6.29, P<0.001).
A previous study concluded that persons with impaired glucose tolerance and T2DM have hypertriglyceridemia and increased HDL catabolism, which result in decreasing levels of HDL.Citation20 Many potential mechanisms could explain the inverse correlation between the hypertriglyceridemia of insulin-resistant states and increased HDL catabolism, leading to low plasma HDL concentrations. One possibility may be a reduction in lipoprotein lipase (LPL) activity, which would have the effect of impairing the maturation of HDL particles. The normal insulin-mediated stimulation of LPL activity has been shown to be blunted in insulin resistance.Citation21 In T2DM, particularly when glycemic control is poor in patients who are relatively insulin deficient, LPL activity is reduced.Citation22 Organs and tissues with lower blood glucose (BG) include the liver, adipose tissue, and muscle, and the liver is a key organ in substance, energy, and hormone metabolism. In addition to lowering BG, the liver can also raise BG by breaking down glycogen. Thus, the liver plays a pivotal role in BG regulation. In the present study, we found high prevalence of low HDL-C and high TG in T2DM patients, which is similar to and further demonstrates the findings from a previous study.Citation23
Our present study further confirmed the finding from a previous studyCitation23 that the relationship between serum lipid profile deficiency and the incidence of T2DM could be closer than that between obesity/waistline and T2DM in Chinese subjects. In addition, abnormal BMI/waistline and lipid profile, especially HDL-C and TG together, increased the incidence of T2DM, suggesting the presence of an additive effect on T2DM risk.
Conclusion
To summarize, our study gives further insight into a comprehensive risk assessment for T2DM in Chinese people, increasing our understanding of the effect of waistline, BMI, and serum lipid profiles, including HDL-C, LDL-C, TC, and TG, on T2DM. We found that waistline and BMI are key important variables relating to T2DM. There also appears to be significant abnormal lipid metabolism in T2DM patients, and the same is true for people who have deficient serum lipid levels, especially the level of HDL-C and TG. These variables and correlations that indicate metabolism deficiency should be used in an effort to prevent and reduce the effect of T2DM.
Acknowledgments
The authors wish to offer their sincere and grateful thanks to the subjects who helped with the development of their study. The authors also thank the staff who helped to measure the biochemical parameters in the Department of Clinical Laboratory in Dalian Central Hospital.
Disclosure
The authors report no conflicts of interest in this work.
References
- AnRPrevalence and trends of adult obesity in the US, 1999–2012ISRN Obes201420142429
- FlegalKMCarrollMDKitBKOgdenCLPrevalence of obesity and trends in the distribution of body mass index among US adults, 1999–2010JAMA2012307549149722253363
- de WildeJAZandbergen-HarlaarSvan BuurenSMiddelkoopBJTrends in body mass index distribution and prevalence of thinness, overweight and obesity in two cohorts of Surinamese South Asian children in The NetherlandsArch Dis Child201398428028523372060
- NingXJZhanCQYangYHSecular trends in prevalence of overweight and obesity among adults in rural Tianjin, China from 1991 to 2011: a population-based studyPLoS One2014912516
- de MutsertRSunQWillettWCHuFBvan DamRMOverweight in early adulthood, adult weight change, and risk of type 2 diabetes, cardiovascular diseases, and certain cancers in men: a cohort studyAm J Epidemiol2014179111353136524786797
- NoraMGuimaraesMAlmeidaRExcess body mass index loss predicts metabolic syndrome remission after gastric bypassDiabetol Metab Syndr2014651124438342
- PhillipsLKPrinsJBThe link between abdominal obesity and the metabolic syndromeCurr Hypertens Rep200810215616418474184
- HaslamDWJamesWPTObesityLancet200536694921197120916198769
- SchulzeMBBergmannMMHeidemannCHoffmannKSchienkiewitzABoeingHComparison of anthropoinetric characteristics in predicting the incidence of type 2 diabetes in the EPIC-potsdam studyDiabetes Care20062981921192316873804
- ShawJTEPurdieDMNeilHAWLevyJCTurnerRCThe relative risks of hyperglycaemia, obesity and dyslipidaemia in the relatives of patients with type II diabetes mellitusDiabetologia1999421242710027573
- PontiroliAEMontiLDPizziniAPiattiPFamilial clustering of arterial blood pressure, HDL cholesterol, and pro-insulin but not of insulin resistance and microalbuminuria in siblings of patients with type 2 diabetesDiabetes Care20002391359136410977033
- EckelRHGrundySMZimmetPZThe metabolic syndromeLancet200536594681415142815836891
- ChristensenKDoblhammerGRauRVaupelJWAgeing populations: the challenges aheadLancet200937496961196120819801098
- HarteminkNBoshuizenHCNagelkerkeNJDJacobsMAMvan HouwelingenHCCombining risk estimates from observational studies with different exposure cutpoints: a meta-analysis on body mass index and diabetes type 2Am J Epidemiol2006163111042105216611666
- GanzMLWintfeldNLiQAlasVLangerJHammerMThe association of body mass index with the risk of type 2 diabetes: a case-control study nested in an electronic health records system in the United StatesDiabetol Metab Syndr20146172424520999
- PischonTNothlingsUBoeingHObesity and cancerProc Nutr Soc200867212814518412987
- YusufSHawkenSOunpuuSEffect of potentially modifiable risk factors associated with myocardial infarction in 52 countries (the INTERHEART study): case-control studyLancet2004364943893795215364185
- HaunerHBramlagePLöschCOverweight, obesity and high waist circumference regional differences in prevalence in primary medical careDtsch Arztebl Int20081054882783319578419
- KuoJFHsiehYTMaoICLinSDTuSTHsiehMCAssociation between body mass index and all-cause mortality in patients with type 2 diabetes mellitus a 5.5-year prospective analysisMedicine20159434e139826313785
- PietzschJJuliusUNitzscheSHanefeldMIn vivo evidence for increased apolipoprotein A-I catabolism in subjects with impaired glucose toleranceDiabetes19984712192819349836526
- MoebusSHanischJUAidelsburgerPBramlagePWasemJJockelKHImpact of 4 different definitions used for the assessment of the prevalence of the metabolic syndrome in primary healthcare: the German Metabolic and Cardiovascular Risk Project (GEMCAS)Cardiovasc Diabetol200768594
- GrundySMCleemanJIDanielsSRAmerican Heart AssociationNational Heart, Lung, and Blood InstituteDiagnosis and management of the metabolic syndrome – An American Heart Association/National Heart, Lung, and Blood Institute Scientific StatementCirculation2005112172735275216157765
- LiWDFuKFLiGMComparison of effects of obesity and non-alcoholic fatty liver disease on incidence of type 2 diabetes mellitusWorld J Gastroenterol201521329607961326327768