
Abstract
Introduction
Previously, we discussed several critical barriers in including [18F] fluorodeoxyglucose positron emission tomography ([18F]FDG-PET) imaging of preclinical Alzheimer’s disease (AD) subjects. These factors included the reference region selection and intensity normalization of PET images and the within- and across-subject variability of affected brain regions. In this study, we utilized a novel FDG-PET analysis, the regional FDG time correlation coefficient, rFTC, that can address and resolve these barriers and provide a more sensitive way of monitoring longitudinal changes in metabolism of cognitively normal elderly adults. The rFTC analysis captures the within-subject similarities between baseline and follow-up regional radiotracer distributions.
Methods
The rFTC trajectories of 27 cognitively normal subjects were calculated to identify 1) trajectories of rFTC decline in individual cognitively normal subjects; 2) how these trajectories correlate with the subjects’ cognitive test scores, baseline cerebrospinal fluid (CSF) levels of amyloid beta (Aβ), and apolipoprotein E4 (APOE-E4) status; and 3) whether similar trajectories are observed in regional/composite standardized uptake value ratio (SUVR) values.
Results
While some of the subjects maintained a stable rFTC trajectory, other subjects had declining and fluctuating rFTC values. We found that the rFTC decline was significantly higher in APOE-E4 carriers compared to noncarriers (p=0.04). We also found a marginally significant association between rFTC decline and cognitive decline measured by Alzheimer’s Disease Assessment Scale – cognitive subscale (ADAS_cog) decline (0.05). In comparison to the rFTC trajectories, the composite region of interest (ROI) SUVR trajectories did not change in any of the subjects. No individual/composite ROI SUVR changes contributed significantly to explaining changes in ADAS_cog, conversion to mild cognitive impairment (MCI), or any general changes in clinical symptoms.
Conclusion
The rFTC decline may serve as a new biomarker of early metabolic changes before the MCI stage.
Introduction
Imaging biomarkers of neurodegeneration include [18F]fluorodeoxyglucose positron emission tomography ([18F]FDG-PET)Citation1,Citation2 and magnetic resonance imaging (MRI) hippocampal volume measures.Citation3 Although both of these biomarkers are nonspecific to Alzheimer’s disease (AD), they can provide evidence about its severity due to neuronal damages. It is known that pathological phenomena that lead to synaptic dysfunction affect metabolism before cell death and detectable atrophy.Citation4 Therefore, FDG-PET may be an earlier marker of neuronal changes than hippocampal volume measures. While baseline FDG-PET standardized uptake value ratios (SUVRs) of cognitively normal subjects predict their future memory decline,Citation5 longitudinal FDG-PET changes are difficult to detect in preclinical AD,Citation6 possibly due to several technical challenges associated with longitudinal FDG-PET measurements.Citation7 One factor is defining a good control population for preclinical AD.Citation8 The within- and across-subject variability of regions with abnormal metabolism poses another challenge for detecting subtle metabolic changes. While we know from previous research which particular areas become hypometabolic in AD,Citation3,Citation9–Citation11 there are also variabilities among individual subjects regarding identifying affected regions and their progression rates.Citation12–Citation14 Many FDG-PET studies use composite regions of interest (ROIs) that include all potentially affected areas.Citation7,Citation15 This approach averages subject’s brain FDG-PET SUVR values from fast declining regions with less affected areas within a large ROI, thus reducing longitudinal effect sizes.Citation16 Unlike composite ROIs, statistical voxelwise methods include only voxels with a significant abnormal activity by comparison to a reference population. Here, the power of analysis depends on the selection of the reference population and is limited by its intersubject variability.Citation17 Most PET studies in clinical environments utilize semi-quantitative data analyses that require a reference region normalization to account for nonspecific radiotracer uptake. The normalization process is subject to additional variabilities due to metabolic changes in reference regions, particularly in elderly adults with a history of brain injuries or vascular diseases,Citation18–Citation20 both prevalent in aging populations. There is also an emerging evidence based on FDG-PET that supports the existence of regional increase in neuronal activity as a compensatory mechanism to early AD pathology.Citation21 Therefore, simultaneous capture of hypermetabolism and hypometabolism may provide a more sensitive way of monitoring the disease progression at early stages.
We previously developed an FDG-PET analysis that overcomes the abovementioned critical barriers in longitudinal FDG-PET. Using this method, we were able to provide trajectories of metabolic changes that correlated with the subject’s trajectory of cognitive tests scoresCitation22 at mild cognitive impairment (MCI) stages. The objective of this study was to test this method, known as the regional FDG time correlation coefficient (rFTC), on cognitively normal subjects to identify 1) trajectories of rFTC decline in individual cognitively normal subjects; 2) how these trajectories correlate with the subjects’ cognitive test scores, baseline cerebrospinal fluid (CSF) levels of amyloid beta (Aβ), and apolipoprotein E4 (APOE-E4) status; and 3) whether similar trajectories can be observed in regional/composite SUVR values.
Materials and methods
Alzheimer’s Disease Neuroimaging Initiative (ADNI)
Data used in the preparation of this article were obtained from the ADNI database (adni.loni.usc.edu). The ADNI was launched in 2003 as a public–private partnership, led by Principal Investigator Michael W. Weiner, MD. The primary goal of ADNI has been to test whether serial MRI, PET, other biological markers, and clinical and neuropsychological assessment can be combined to measure the progression of MCI and early AD. All data accessed from ADNI are de-identified and are compliant with relevant privacy regulations.
Subject demographics
Data from 27 (11 females) cognitively normal ADNI subjects were used in our study. The average baseline age was 76±5 years. We included only individuals who had at least three follow-up FDG-PET scans and T1-weighted MRI volumes acquired at a time concurrent to the baseline FDG-PET scans. The average subject age at the last follow-up was 79±5 years. The average duration between the subject’s baseline and the last follow-up time point was 3±1 years. We identified four subjects whose diagnosis was changed to MCI after the baseline. We also identified seven subjects who had some changes in clinical symptoms, but the diagnosis was not changed to MCI. We included only subjects whose data acquisitions as well as image reconstruction and scatter/attenuation corrections were performed in the same way and using the same scanner at baseline and all follow-up time points to reduce variations in data. Most subjects of this study (21 subjects) had at least four follow-up scans. Based on their ADNI medication records, we identified four subjects who took cognition-enhancing drugs, such as Aricept. Eight subjects were APOE-E4 carriers. The average education was 17±3. All subject information is summarized in .
Table 1 Subject information
Data acquisition, image reconstruction, and preprocessing
All ADNI FDG-PET scans were acquired at participating ADNI sites following the standardized ADNI protocols.Citation23,Citation24 ADNI FDG-PET images were available at several levels of preprocessing. In “level 1”, FDG time frames at equilibrium (starting 30 minutes post injection) were co-registered. These non-normalized images were downloaded. For each subject, we also downloaded the 3D T1-weighted MRI volumes acquired at closest time points to the baseline FDG-PET images to define the anatomical ROIs. All MRI scans followed the ADNI MRI protocols.Citation25
Clinical ratings
Longitudinally acquired cognitive tests were used to track the subject’s temporal progression of cognitive decline. These tests included the Alzheimer’s Disease Assessment Scale – cognitive subscale (ADAS_cog)Citation26 and the Mini-Mental Status Examination (MMSE).Citation27 Only 15 subjects had CSF measures of Aβ1–42 at baseline. These were downloaded from ADNI. The average level of CSF Aβ1–42 was 220±60 pg/mL.
Image analysis
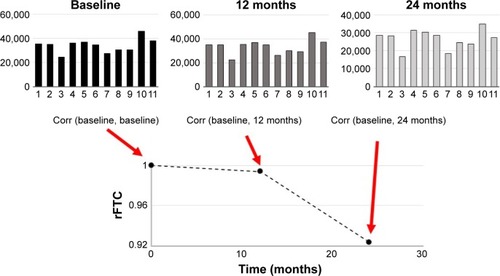
PET images of each subject were aligned to their T1-weighted MRI volumes. Gray matter (GM) and white matter (WM) masks of the T1-weighted MRI volumes were segmented in subject’s native space as described previously.Citation22,Citation28 Briefly, the T1-weighted MRI volume of each subject was aligned to a reference brain with a rigid transform, and then, the deformation field between the reference brain and the globally aligned T1-weighted MRI volume was calculated with a nonrigid demon registration algorithm.Citation29,Citation30 Binary masks for 11 regions (left and right frontal lobes, posterior and anterior cingulate cortexes, occipital lobe, left and right parietal lobes, left and right temporal lobes, and mid brain) from the reference brain were warped to the ADNI subject’s image volume with the nonrigid deformation field. Each brain volume was also segmented into cerebral spinal fluid, GM, and WM with fuzzy c-means (FCM),Citation31 and a GM mask was created for each of the 11 anatomic regions. FCM is a data clustering method that divides a dataset into c number of clusters. Every data point belongs to each cluster with a specific degree of membership. For each subject and at each time point, we first constructed a one-dimensional FDG vector from the FDG-PET image. Each element of this vector was the FDG activity from one region. For each subject, the Pearson’s correlation coefficients between the subject’s baseline FDG vector () and those from the follow-up scans (top middle and right in ) were calculated. The size of the regions was incorporated as their weighting factor into the correlation calculation.Citation32 The weighted correlation coefficient of the initial vector, rFTC (t=0), was equal to 1.0 for every subject. For each subject, the rFTC(t) value at a follow-up scan was determined by the correlation between the subject’s FDG vectors at baseline and the follow-up time point. The rFTC outcome of each individual was a trajectory (x-axis: time) where the value on the y-axis started with 1 at baseline and declined over time as the correlation between the subject’s FDG vectors at baseline and follow-up decreased.
Figure 1 Illustration of the rFTC calculation.
Abbreviations: Corr, correlation coefficient; rFTC, regional FDG time correlation coefficient; FDG, [18F]fluorodeoxyglucose; PET, positron emission tomography.
Statistical analysis
A linear regression model (R software package, www.r-project.org) was used to determine whether the presence of APOE-E4 was associated with a faster rFTC decline. The rFTC decline was characterized by 1) difference between the rFTC values at baseline and last follow-up and 2) maximum decrease in the rFTC value during 38 months (maximum fluctuation). The same model was used to determine the impact of subject’s CSF levels of Aβ1–42 on the rFTC decline. A linear mixed-effects model with an autoregressive order 1 (AR(1)) structure of correlation was used to establish associations between rFTC decline and decline in MMSE and ADAS_cog test scores (increasing value in ADAS_cog interprets as decline in cognition) while properly taking into account the underlying longitudinal correlation. Age and gender were included as fixed effects in all models. A generalized linear model was used to determine whether the rFTC decline predicts either subject’s conversion to MCI or overall changes in clinical symptoms (clinician’s report). A variable for MCI conversion was included in this model. The value for the MCI was set to 0 if the subject did not convert to MCI, 1 when the subject had some changes in clinical symptoms but the diagnosis was not changed to MCI, and 2 when the subject’s diagnosis was changed to MCI. The diagnostic summary and baseline changes were downloaded from ADNI (BLCHANGE.csv).
For comparison, another linear regression model was applied to regional and the composite region of interest (ROI) SUVR values to find associations between their longitudinal changes (ie, difference between the SUVR values at baseline and last follow-up) and the cognitive decline and whether baseline SUVR values or changes in SUVR (single or composite regions) predicted conversion to MCI (MCI =2) or general change in clinical diagnosis (MCI =1). For the composite SUVR values, we calculated the average SUVR activity of the same 11 regions that were used for rFTC. The regional and composite ROI activities were normalized to the mean GM cerebellar activity to obtain the associated SUVR values.
Results
Statistical analyses of rFTC trajectories
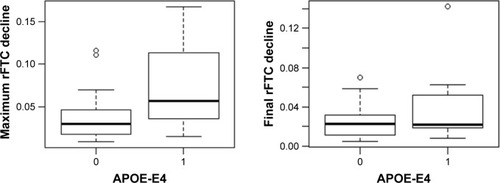
shows the rFTC and composite ROI SUVR trajectories of all subjects. For each subject, the decline in rFTC trajectory was triggered by activity changes in any of the 11 region(s) in any direction (increase or decrease in regional activity). While some of these cognitively normal subjects maintained a stable rFTC trajectory (blue lines), others showed declining rFTC trajectories (red lines). For comparison, the same subjects’ trajectories of composite ROI SUVR values did not change. The statistical analyses indicated a faster rFTC decline in APOE-E4 carriers compared to noncarriers while controlling for age effect. This association was more significant when the maximum decline was used as the outcome variable (p=0.04) but not significant (p=0.1) when the final decline at the last follow-up was used as the outcome variable (). The CSF Aβ1–42 levels had no significant effect on maximum (p=0.158) or final (p=0.45) decline.
Figure 2 rFTC and composite ROI SUVR trajectories of all subjects.
Notes: Some subjects maintained high rFTC values (blue lines) and others had declining values (red lines) over time. The threshold for abnormal rFTC decline was set at 0.97.
Abbreviations: rFTC, regional FDG time correlation coefficient; ROI, region of interest; SUVR, standardized uptake value ratio.
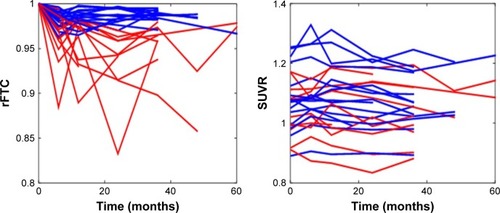
Figure 3 Box plot of maximum (left) and final (right) rFTC decline in APOE-E4 carriers (group =1) versus noncarriers (group =0).
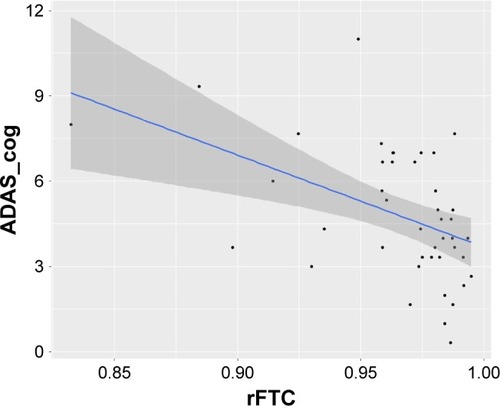
The results of the linear mixed-effects model analysis showed a significant association between rFTC decline and ADAS_cog decline (p=0.05). However, the association between rFTC decline and MMSE scores was not significant (p=0.086). These associations have been graphically presented in . The rFTC decline did not predict conversion to MCI (p=0.8207) or general change in clinical symptoms (p=0.227).
Figure 4 Association between ADAS_cog scores and rFTC based on a linear mixed-effects model.
Statistical analyses of SUVR trajectories and baseline values
In comparison to the rFTC trajectories, the composite ROI trajectories did not change in any of the subjects (). No individual ROI SUVR changes contributed significantly to explaining changes in ADAS_cog, conversion to MCI, or any general changes in clinical symptoms ().
Table 2 Association between changes in regional SUVR values and ADAS_cog decline
Discussion
This study introduces a novel way of longitudinal FDG-PET image analysis, the rFTC, to capture subtle regional metabolic changes in brain with a single trajectory per each subject. One objective was to determine whether these trajectories correlate with subtle cognitive changes in normal ADNI subjects. We found a significant association between rFTC changes and ADAS-cog changes. The lack of significant association between rFTC and MMSE could be related to the small range of MMSE test score, making this test less sensitive to cognitive changes at preclinical stages in comparison. Another interesting outcome was to find significant association between rFTC decline and the subject’s APOE-E4 status. One of the limitations of this study is the small sample size, which limits the interpretation of the results. Although ADNI is a large database, fewer subjects (mainly from Phase I) have multiple longitudinal follow-ups. We also took a conservative approach and disregarded subjects whose data acquisition, image reconstruction, and scatter/attenuation correction were not performed with same scanner and same methodology at all time points to reduce scanner-related variabilities in correlation decline.
The results of this study indicate the potential utility of rFTC as a new biomarker of metabolism at preclinical stages of AD. The decline in the rFTC trajectory is triggered by metabolic changes in any part of the brain. Therefore, this technique can capture temporal changes without using a composite ROI. The value of the correlation coefficient accounts for both hypometabolism and hypermetabolism. In contrast to hypometabolism, very few studies have explored the role of increased neuronal activity (and increased metabolism) in early stages of AD. There is an emerging evidence based on functional MRICitation33 that supports the existence of neural compensation in older adults. Recruitment of additional neural resources may allow subjects to maintain normal cognitive activity in the presence of abnormal pathological changes. By capturing correlation changes that are triggered by both increase and decrease in brain metabolism, the rFTC analysis provides a unique way of assessing the disease progression at earliest stages where the neuronal compensations are more likely prominent than in the advanced stages of the AD.
One of the most significant limitations of using rFTC in preventive clinical trials is the number of required FDG-PET scans. As current clinical trials are including several MRI acquisitions, Aβ-PET and now tau-PET, it may be challenging to incorporate multiple FDG-PET acquisitions into the study design. In addition, FDG-PET is associated with a higher radiation doseCitation34 than Aβ-PET.Citation35 However, the concept of longitudinal correlation measurements can be translated to other in vivo imaging techniques, such as arterial spin labeling (ASL) MRI. Therefore, we believe that this methodology is significant for applications beyond FDG-PET. In addition, by eliminating the reference region normalization, the rFTC methodology could be useful in other applications/diseases where the selection of reference region is particularly challenging (eg, Parkinson’s diseaseCitation36) for FDG-PET.
Conclusion
This study explores the utility of a new image analysis method, the rFTC, as a biomarker of metabolic changes in cognitively normal subjects in association with subtle changes in their cognitive status.
Acknowledgments
Data collection and sharing for this project was funded by the ADNI (National Institutes of Health [NIH] Grant U01 AG024904) and Department of Defense (DOD) ADNI (DOD award number W81XWH-12-2-0012). ADNI is funded by the National Institute on Aging, the National Institute of Biomedical Imaging and Bioengineering, and through generous contributions from the following: AbbVie; Alzheimer’s Association; Alzheimer’s Drug Discovery Foundation; Araclon Biotech; BioClinica, Inc.; Biogen; Bristol-Myers Squibb Company; CereSpir, Inc.; Cogstate; Eisai Inc.; Elan Pharmaceuticals, Inc.; Eli Lilly and Company; EuroImmun; F. Hoffmann-La Roche Ltd and its affiliated company Genentech, Inc.; Fujirebio; GE Healthcare; IXICO Ltd.; Janssen Alzheimer Immunotherapy Research & Development, LLC.; Johnson & Johnson Pharmaceutical Research & Development LLC.; Lumosity; Lundbeck; Merck & Co., Inc.; Meso Scale Diagnostics, LLC.; NeuroRx Research; Neurotrack Technologies; Novartis Pharmaceuticals Corporation; Pfizer Inc.; Piramal Imaging; Servier; Takeda Pharmaceutical Company; and Transition Therapeutics. The Canadian Institutes of Health Research is providing funds to support ADNI clinical sites in Canada. Private sector contributions are facilitated by the Foundation for the NIH (www.fnih.org). The grantee organization is the Northern California Institute for Research and Education, and the study is coordinated by the Alzheimer’s Therapeutic Research Institute at the University of Southern California. ADNI data are disseminated by the Laboratory of Neuro Imaging at the University of Southern California. This study was supported by NIH grants R00 EB 009106, to SS. The authors would like to thank Baxter Rogers of Vanderbilt University Institute of Imaging Science for supportive discussions. Data used in the preparation of this article were obtained from the ADNI Database (adni.loni.usc.edu). As such, the investigators within the ADNI contributed to the design and implementation of ADNI and/or provided data but did not participate in analysis or writing of this report. A complete listing of ADNI investigators can be found at http://adni.loni.usc.edu/wp-content/uploads/how_to_apply/ADNI_Acknowledgement_List.pdf.
Disclosure
The authors report no conflicts of interest in this work.
References
- JackCRJrKnopmanDSWeigandSDAn operational approach to National Institute on Aging-Alzheimer’s Association criteria for preclinical Alzheimer diseaseAnn Neurol201271676577522488240
- MinoshimaSGiordaniBBerentSFreyKAFosterNLKuhlDEMetabolic reduction in the posterior cingulate cortex in very early Alzheimer’s diseaseAnn Neurol199742185949225689
- KnightMJMcCannBKauppinenRACoulthardEJMagnetic resonance imaging to detect early molecular and cellular changes in Alzheimer’s diseaseFront Aging Neurosci2016813927378911
- ChételatGDesgrangesBLandeauBDirect voxel-based comparison between grey matter hypometabolism and atrophy in Alzheimer’s diseaseBrain2008131607118063588
- MosconiLDe SantiSLiJHippocampal hypometabolism predicts cognitive decline from normal agingNeurobiol Aging200829567669217222480
- LandauSMHarveyDMadisonCMAlzheimer’s Disease Neuroimaging InitiativeAssociations between cognitive, functional, and FDG-PET measures of decline in AD and MCINeurobiol Aging20113271207121819660834
- ShokouhiSCampbellDBrillABGwirtsmanHEAlzheimer’s Disease Neuroimaging InitiativeLongitudinal positron emission tomography in preventive Alzheimer’s disease drug trials, critical barriers from imaging science perspectiveBrain Pathol201626566467127327527
- ChenKLangbaumJBSFleisherASTwelve-month metabolic declines in probable Alzheimer’s disease and amnestic mild cognitive impairment assessed using an empirically pre-defined statistical region-of-interest: findings from the Alzheimer’s disease neuroimaging initiativeNeuroimage201051265466420202480
- FriedlandRPBudingerTFGanzERegional cerebral metabolic alterations in dementia of the Alzheimer type: positron emission tomography with [18F]fluorodeoxyglucoseJ Comput Assist Tomogr1983745905986602819
- JagustWJFriedlandRPBudingerTFKossEOberBLongitudinal studies of regional cerebral metabolism in Alzheimer’s diseaseNeurology1988389099123259296
- HerholzKSalmonEPeraniDDiscrimination between Alzheimer dementia and controls by automated analysis of multicenter FDG PETNeuroimage20021730231612482085
- Del SoleAClericiFChitiAIndividual cerebral metabolic deficits in Alzheimer’s disease and amnestic mild cognitive impairment: an FDG PET studyEur J Nucl Med Mol Imaging20083571357136618418593
- LamBMasellisMFreedmanMStussDTBlackSEClinical, imaging, and pathological heterogeneity of the Alzheimer’s disease syndromeAlzheimers Res Ther201351123302773
- MosconiLMisturRSwitalskiRFDG-PET changes in brain glucose metabolism from normal cognition to pathologically verified Alzheimer’s diseaseEur J Nucl Med Mol Imaging200936581182219142633
- KnopmanDSJackCRJrWisteHJ18F-fluorodeoxyglucose positron emission tomography, aging, and apolipoprotein E genotype in cognitively normal personsNeurobiol Aging20143592096210624702820
- KleinGSampatMStaetwenDHead-To-Head comparison of image analysis methods in longitudinal Alzheimer’s disease FDG-PET studiesAlzheimer Assoc Int Conf20161271140
- LineshPIhGMinoshimaSWaxmanADInterpretation of functional brain imaging results using quantitative analysis; definition of abnormality must be defined with caution when comparing subjects to a normal databaseJ Nucl Med201657suppl 21861
- ByrnesKRWilsonCMBrabazonFFDG-PET imaging in mild traumatic brain injury: a critical reviewFront Neuroenergetics201451324409143
- KushnerMTobinMAlaviACerebellar glucose consumption in normal and pathologic states using fluorine-FDG and PETJ Nucl Med19872811166716703499490
- PeskindERPetrieECCrossDJCerebrocerebellar hypometabolism associated with repetitive blast exposure mild traumatic brain injury in 12 Iraq war Veterans with persistent post-concussive symptomsNeuroimage201154suppl 1S76S8220385245
- AshrafAFanZBrooksDJEdisonPCortical hypermetabolism in MCI subjects: a compensatory mechanism?Eur J Nucl Med Mol Imaging201542344745825267349
- ShokouhiSClaassenDKangHLongitudinal progression of cognitive decline correlates with changes in the spatial pattern of brain 18F-FDG PETJ Nucl Med20135491564156923864720
- JagustWJBandyDChenKThe ADNI PET coreAlzheimers Dement20106322122920451870
- JagustWJLandauSMKoeppeRAThe Alzheimer’s Disease Neuroimaging Initiative 2 PET core: 2015Alzheimers Dement201511775777126194311
- JackCRJrBernsteinMAFoxNCThe Alzheimer’s Disease Neuroimaging Initiative (ADNI): MRI methodsJ Magn Reson Imaging200827468569118302232
- RosenWGMohsRCDavisKLA new rating scale for Alzheimer’s diseaseAm J Psychiatry1984141135613646496779
- FolsteinMFFolsteinSEMcHughPRMini-mental state: a practical method for grading the cognitive state of patients for the clinicianJ Psychiatr Res1975121891981202204
- RiddleWRDonLevySCWushenskyCADawantBMFitzpatrickJMPriceRRQuantifying cerebral changes in adolescence with MR imaging and deformation based morphometryJ Magn Reson Imaging20082832032618666153
- ThirionJPImage matching as a diffusion process: an analogy with Maxwell’s demonsMed Image Anal199822432609873902
- DawantBMHartmannSLThirionJPMaesFVandermeulenDDemaerelPAutomatic 3-D segmentation of internal structures of the head in MR images using a combination of similarity and free-form transformations: part I, methodology and validation on normal subjectsIEEE Trans Med Imaging19991890991610628950
- PhamDLPrinceJLAdaptive fuzzy segmentation of magnetic resonance imagesIEEE Trans Med Imaging19991873775210571379
- PozziFDi MatteoTAsteTExponential smoothing weighted correlationsEur Phys J B201285175
- ElmanJAOhHMadisonCMNeural compensation in older people with brain amyloid-β depositionNat Neurosci2014171316131825217827
- WaxmanADHerholzKLewisDHSociety of Nuclear Medicine Procedure Guideline for FDG PET Brain Imaging. Version 1.0Reston, VAThe Society of Nuclear Medicine2009
- ScheininNMTolvanenTKWilsonIAArponenEMNågrenKARinneJOBiodistribution and radiation dosimetry of the amyloid imaging agent 11C-PIB in humansJ Nucl Med20074812813317204709
- BertiVPolitoCBorghammerPAlternative normalization methods demonstrate widespread cortical hypometabolism in untreated de novo Parkinson’s diseaseQ J Nucl Med Mol Imaging201256329930822695340