
Abstract
Background
Sarcopenia and obesity both negatively impact health including cognitive function. Their coexistence, however, can pose an even higher threat likely surpassing their individual effects. We assessed the relationship of sarcopenic obesity with performance on global- and subdomain-specific tests of cognition.
Patients and methods
The study was a cross-sectional analysis of data from a series of community-based aging and memory studies. The sample consisted of a total of 353 participants with an average age of 69 years with a clinic visit and valid cognitive (eg, Montreal Cognitive Assessment, animal naming), functional (eg, grip strength, chair stands), and body composition (eg, muscle mass, body mass index, percent body fat) measurements.
Results
Sarcopenic obesity was associated with the lowest performance on global cognition (Est.Definition1=−2.85±1.38, p=0.039), followed by sarcopenia (Est.Definition1=−1.88±0.79, p=0.017) and obesity (Est.Definition1=−1.10±0.81, p=0.175) adjusted for sociodemographic factors. The latter, however, did not differ significantly from the comparison group consisting of older adults with neither sarcopenia nor obesity. Subdomain-specific analyses revealed executive function (Est.Definition1=−1.22±0.46 for sarcopenic obesity; Est.Definition1=−0.76±0.26 for sarcopenia; Est.Definition1=−0.52±0.27 for obesity all at p<0.05) and orientation (Est.Definition1=0.59±0.26 for sarcopenic obesity; Est.Definition1=−0.36±0.15 for sarcopenia; Est.Definition1=−0.29±0.15 all but obesity significant at p<0.05) as the individual cognitive skills likely to be impacted. Potential age-specific and depression effects are discussed.
Conclusion
Sarcopenia alone and in combination with sarcopenic obesity can be used in clinical practice as indicators of probable cognitive impairment. At-risk older adults may benefit from programs addressing loss of cognitive function by maintaining/improving strength and preventing obesity.
Introduction
Changes in body composition including a shift toward higher fat mass and decreased lean muscle mass (MM) represent a significant public health concern among older adults as they may lead to various negative health outcomes including cardiovascular and neurodegenerative diseases. Higher body mass index (BMI) is inversely related to global cognition and subdomains such as executive function and processing speed.Citation1,Citation2 In addition, higher levels of Alzheimer’s disease (AD) pathologyCitation3 and structural brain changes have been found in obese adults regardless of their cognitive status.Citation4,Citation5 Finally, an elevated risk of late-life dementia has been reported in middle-aged obese individualsCitation6 suggesting a cumulative effect throughout the lifespan.Citation7 The findings are fairly consistent across various measures of obesity.Citation6,Citation8 However, while obesity in early adulthood and middle age may increase risk for dementia, later in life it may not pose the same risk.Citation9 The exact mechanisms linking obesity to cognitive dysfunction are yet to be determined, although several pathways including sedentary behavior, inflammation, and vascular damage have been proposed.Citation7,Citation9
Sarcopenia or age-related loss of MM and function may represent another, perhaps even more important, predictor of reduced cognition. In epidemiologic studies, sarcopenia has been linked to global cognitive impairment and dysfunction in specific cognitive skills including memory, speed, and executive function.Citation10–Citation13 National Health and Nutrition Examination Survey (NHANES) data confirm the link between sarcopenia and cognitive dysfunction in older adults and suggest inflammation as a contributing factor at least in women.Citation13 Other proposed pathways include behavioral,Citation14 oxidative,Citation15 and metabolic mechanisms.Citation16,Citation17 In addition, reduced lean mass is associated with brain atrophy in ADCitation18 as well as in cognitively normal older populations.Citation19 Baseline sarcopenia predicts cognitive declineCitation20 and development of AD and mild cognitive impairment (MCI).Citation21 Neuropsychiatric symptoms are also more prevalent once MCI is diagnosed.Citation22,Citation23
Given these individual effects, presence of combined sarcopenia and obesity captured by the concept of sarcopenic obesity is likely to have an even stronger impact on cognition. This hypothesis found empirical support in a recent cross-sectional analysis of NHANES data, in which higher waist girth was linked to poor cognition, followed by low MM and finally by the presence of both phenotypes due in part to higher insulin resistance in the these groups compared to healthy older adults.Citation24 In light of evidence that loss of muscle strength (MS) may have a stronger impact on health outcomes than loss of MM,Citation25 the current study was designed to investigate the association between sarcopenic obesity and cognitive function using two sarcopenia definitions that incorporate measures of muscle function in addition to MM, and also to assess this association in relation to global as well as specific aspects of cognition. Based on prior reports, we hypothesized sarcopenia alone or in combination with obesity to predict poorer performance on global- and domain-specific aspects of cognition, in particular executive function.
Patients and methods
Study participants were adults enrolled in research studies between 02/2012 and 03/2015. A detailed description of these studies has been published previously.Citation11 Briefly, community dwelling adults aged ≥40 years residing in the local catchment area (Manhattan, Queens, and Brooklyn) were recruited via collaborations with local community partners, word-of-mouth, educational seminars, and from an in-house research registry to enroll in cognitive and functional studies. The protocol, which was approved by the New York University Institutional Review Board and signed by each participant, was similar across all studies in terms of physical and cognitive assessments and other collection procedures. Exclusion criteria were age <40 years, nonfluency in English or Spanish, and active psychiatric and neurological conditions that could impact physical and/or cognitive performance or could otherwise interfere with participation. A total of 353 participants with data on body composition, physical function, and cognition were included in this cross-sectional analysis. All study participants provided written informed consent.
Cognition
Performance on the Montreal Cognitive Assessment (MoCA) test was used to measure global cognitive function. MoCA can detect impairment in older adults with a sensitivity of 90% for MCI and 100% for mild ADCitation26 and also assesses several cognitive domains commonly affected in early AD, including short-term memory, visuospatial skills, executive function, attention and concentration, language, and orientation for a total of 30 points. Higher scores indicate better performance and scoring <26 can be used to define cognitive impairment in community samples. An additional point is added for those with 12 years or less of formal education to account for differences in education. In addition, scores for individual items were used to measure specific cognitive skills including visuospatial/executive function by Trail Making B, verbal abstraction, and clock drawing; language by naming, sentence repetition, and word fluency; and attention measured by finger tapping to letter, serial subtraction, and digits forward and backward. Orientation to time and place was measured by six items and short-term memory by delayed recall of five nouns.
The animal naming test, another dementia screening test, was used as a second cognitive measure of verbal fluency and mental flexibility. As part of this test, participants are asked to name as many animals as they can think of in 60 seconds. A score of <14 is indicative of cognitive impairment.Citation27 Trail Making A (TMA), a measure of visual search speed, scanning, and processing speed, was also included as an additional cognitive performance measure independent of the MoCA.
Sarcopenic obesity
While the definition of sarcopenic obesity as the combination of sarcopenia and obesity is well accepted, its measurement is arbitrary due in part to the various ways the two components are measured. The definition of sarcopenia evolved overtime from reduced MM to later on to include reduced muscle function. Baumgartner was among the first to define sarcopenia within the former context using dual X-ray absorptiometry (DXA).Citation28 Using similar methods to derive MM, measures that adjusted for body size followed.Citation29 More easily accessible methods to measure MM in the clinical setting including bioelectrical impedance (BIA) were later proposed.Citation30 More recently, reduced muscle function measured as low MSCitation31 or low MS and/or poor physical performance were added.Citation32,Citation33
Sarcopenia was measured in our study with the short portable sarcopenia measure (SPSM) proposed by Miller et al and validated for use in older populations.Citation33 SPSM follows the current sarcopenia diagnosis guidelines and incorporates measures of MM, MS, and physical performance. Body composition was measured in our study by BIA with the BC-558 Ironman Segmental Body Composition Monitor (Tanita Corporation, Arlington Heights, IL, USA). Handgrip strength was measured by dynamometry (Baseline® Digital Smedley Spring Dynamometer; Patterson Medical, Warrenville, IL, USA) in both hands and the mean expressed as kg/m was used in data analysis. Participants were also asked to stand five times from a seated position as fast as possible and the time in seconds was recorded. We used sex-specific cutoff points to divide participants in quintiles of lean BMI, grip strength, and chair stands. A summary score was derived using a weighted scheme in accordance to Miller et al’s algorithm and sarcopenia was defined as the bottom two quintiles of this summary score.Citation33 A second formula included low MM and/or low MS using the same cutoff. This second definition was based on the notion of strength as a measure of muscle function. However, given that muscle weakness may have a stronger negative health impact than reduced lean mass, we allowed an independent contribution of low strength to the definition of sarcopenia in our study.
Obesity has been traditionally defined as BMI ≥30 kg/m2,Citation34 although other body composition measures such as fat mass, percent body fat (PBF), waist circumference (WC), and waist-to-hip ratio are often used to capture the concept of obesity using various cutoff points including sample median,Citation28 highest two quintiles,Citation35 or sex-specific preset values (eg, WC >102 cm for men and 88 cm for women).Citation34 Obesity was measured in the current study not only as BMI ≥30 kg/m2 but also as the top two quintiles of PBF to offset inherited limitations of BMI as a weight measure.
Using these different sarcopenia and obesity definitions, we created four sarcopenic obesity indexes covering various aspects of physical function and body composition to measure results’ reliability and help discern the contribution of individual components/measures (eg, overall vs visceral obesity). The first definition combines the lowest two quintiles of SPSM and BMI ≥30 kg/m2. The second combines the lowest two quintiles of SPSM and the highest two quintiles of PBF. The third defines sarcopenic obesity as the lowest two quintiles of MM and/or MS and BMI ≥30 kg/m2. The last definition uses the lowest two quintiles of MM and/or MS and the highest two quintiles of PBF. For each of these different definitions, a 4-value predictor variable was created: 0=no obesity no sarcopenia group (controls); 1=obesity group (O); 2=sarcopenia group (S); 3=sarcopenic obesity group (SO). The control group was used as the reference group.
Covariates
Age and race (white: 68.3%; black: 24.7%; other: 7%) were used as covariates. Sex (female: 65.4%) was not included since sex-specific estimates of MM, MS, chair stands, and PBF were used to compute our predictor measure. Depressive symptomatology was measured with the Hospital Anxiety and Depression Scale (HADS).Citation36 A cutoff of 11 was used to indicate presence of depression.
Data analysis
Differences in age- and race-adjusted MoCA means across the four classes of our predictor were analyzed using analysis of covariance. In general, generalized linear models (GLM) and total MoCA and its five subdomains were regressed on the predictor using the four different definitions adjusted for age and race. These models were run on animal naming as a second outcome measure. Also, to account for the impact of depression on physical and cognitive performance,Citation37–Citation38 we re-analyzed the relationships of interest controlling for depression. All analyses were performed using SAS 9.3 (SAS Institute Inc., Cary, NC, USA). A p<0.05 was used to evaluate statistical significance.
Results
Participants were on average 69 years old (<8% were <55 years), female, and white (). Body composition, strength, and cognitive data were (all three) available in >90% of participants. Of these, 42% had sarcopenia according to Miller’s definition, whereas 62% had sarcopenia by the second definition. Using BMI ≥30 kg/m2, 32% of participants were found to be obese, whereas 42% were in the top two quintiles of PBF. Using definition 1 for our predictor yielded the most conservative SO prevalence: 14.3%, while the highest prevalence (37.2%) was found using definition 2.
Table 1 Sample characteristics according to sarcopenic obesity category (based on definition 1)
In GLM models controlled for age and race, SO status was associated with MoCA in a dose–response pattern. Compared to controls, all other groups performed poorer on MoCA. However, the “risk” of poor cognitive performance was lowest in the O and highest in the SO, whereas the S group performed in the middle (). For example, while the reduction in the MoCA score had the magnitude of 1.10 in the O group, the effect was almost triple in the SO group (ie, −2.85) with a decrease of 1.88 units in the S group (; Definition 1 column). This finding was consistent across all four SO definitions investigated in this study. However, the effects are somewhat stronger when PBF rather than BMI is used to define obesity. Adjusted mean differences in MoCA among the four comparison groups are presented graphically in for the two SO definitions using BMI ≥30 kg/m2 as evidence of obesity.
Table 2 Sarcopenic obesity in relation to MoCA (obesity: BMI ≥30 kg/m2)
Figure 1 Age- and race-adjusted mean global cognition score according to sarcopenic obesity category using definitions 1 and 3.
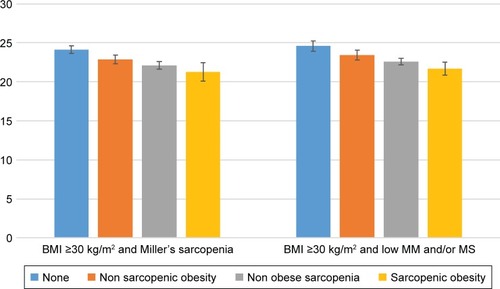
We next investigated the effect on individual cognitive subdomains. The results of the models based on the two SO definitions using BMI ≥30 kg/m2 (ie, definitions 1 and 3) are presented in . We found evidence of a significant negative association with executive function and orientation, where performance was poorest in SO (eg, Est.=−1.22±0.46, p=0.009), followed by S (Est.=−0.76±0.26, p=0.005), and finally by O (Est.=−0.52±0.27, p=0.060) when compared to controls using definition 1. Definitions 2 and 4 yielded similar results (data not shown).
Table 3 Sarcopenic obesity in relation to individual cognitive domains (obesity: BMI ≥30 kg/m2)
To determine findings’ reliability, the analysis was repeated for animal naming. As can be observed in , presence of SO as measured by the two definitions based on PBF (ie, definitions 2 and 4) was associated with the lowest cognitive performance. While the direction of association was consistent with the MoCA findings, neither of its two components managed to reach statistical significance independently of each other. By contrast, BMI ≥30 kg/m2 failed to distinguish between the four groups (data not shown). The SO group also showed the greatest degree of impairment across all groups when assessing TMA as an outcome. For example, using definition 2, we found the SO group to perform the poorest on TMA (Est.=15.49±8.26, p=0.062), followed by the S group (Est.=15.04±6.97, p=0.032) and finally by the O group (Est.=14.16±6.11, p=0.021) compared to the control group. A longer time taken to complete TMA indicates a higher likelihood of impairment. While the SO group was only marginally different from the control group as indicated by the p level of 0.062, in analyses using MM/function as the sarcopenia measure of choice, the SO group performed significantly poorer than the control group (Est.=23.32±9.38, p=0.014 for definition 3; Est.=17.33±8.35, p=0.039 for definition 4), in line with the MoCA and animal naming findings.
Table 4 Animal naming across sarcopenic obesity categories when obesity is defined as being in the upper two quintiles of percent body fat
Finally, the effect of our predictor was not significantly impacted when models were adjusted for depression, particularly those models predicting executive function. However, some evidence of confounding/mediation was found for MoCA (Est.O=−0.79±0.81, p=0.329; Est.S=−1.42±0.79, p=0.08; Est.SO=−2.33±1.47, p=0.114 for definition 1) and orientation (Est.O=−0.13±0.19, p=0.515; Est.S=−0.19±0.17, p=0.273; Est.SO=−0.38±0.23, p=0.097 for definition 3) when BMI ≥30 kg/m2 was used.
Discussion
Using a cross-sectional design, we found consistent evidence to link SO to poor global cognitive performance in community-dwelling older adults. This effect is best captured by its sarcopenia component with obesity likely having an additive effect. This effect extends to specific cognitive skills, in particular executive function and orientation. Understanding the mechanisms through which this syndrome may affect cognition is important as it may inform efforts to prevent cognitive decline in later life by targeting at-risk groups with an imbalance between lean and fat mass.
The less consistent independent effect of obesity is not surprising. Although obesity has been linked to cognitive deficits,Citation2 structural brain changes,Citation4,Citation5 and AD pathology,Citation3 its impact may be limited to earlier stages of adulthood,Citation9 with inconsistent reports in samples of older adults. While some found obesity to be related to impaired cognitive functionCitation39 and cognitive decline,Citation40 other reports showed improved cognitive performanceCitation41 and lower declineCitation42 rate in obese older adults. The choice of obesity measures may at least in part explain these differential effects.Citation9 In our study, when measured by BMI ≥30 kg/m2, no effect of obesity independent of that of sarcopenia was detected. However, when measured using PBF, obesity was significantly associated with reduced global cognitive performance in one operationalization method (ie, definition 2) but not in the other (ie, definition 4). Also, regardless of measurement method, obesity was significantly associated with lower executive function but not with other cognitive subdomains. To further test the hypothesis that the effect of obesity may be limited to younger ages, we split our sample into age <65 years vs age ≥65 years. Although an independent effect of obesity remained nonsignificant for both age groups, when combined with sarcopenia obesity was consistently linked to poorer cognitive performance in the younger group, while in older adults, that held for some (eg, Est.SO=−0.95±0.39, p=0.018 for executive function and Est.SO=−2.71±1.13, p=0.017 for MoCA using definition 2; similar results found for definition 4) but not all cognitive outcomes (ie, Est.SO=−2.39±1.58, p=0.131 for MoCA and Est.SO=−0.89±0.62, p=0.150 for executive function using definitions 1 and 3). Given these inconsistent findings in previous work as well as ours, it is possible that in older age, the effect of being overweight/obese is offset by the strong impact of other risk factors including sarcopenia on cognition. Alternatively, maintenance of higher fat mass may be protective to the aging brain, guarding off against AD.Citation22 However, our results suggest that efforts to maintain a healthy weight should be made even in later life as obesity may enhance the detrimental effect of reduced MM and function.
The impact of sarcopenia on global cognitive performance was consistent in our study, retaining its significance whether defined based on Miller’s SPSM or as low MM and/or MS. This finding is in line with previous reports, which have consistently linked sarcopenia to poor cognitive function.Citation11,Citation18,Citation20,Citation21 For example, in a case–control study comparing early AD patients with cognitively normal controls in terms of lean mass, cognitive performance, and brain volume, reduced lean mass was reported in the AD group and associated with poor cognitive performance and brain atrophy.Citation18 In large epidemiologic studies of functional and cognitive aging, a protective role of high handgrip strength on cognitive health has been reported,Citation20 slowing the rate of cognitive decline and decreasing the risk of AD.Citation21 Studies using the newer sarcopenia diagnosis guidelines also report a strong association with cognitive impairment.Citation10 Although an independent effect of sarcopenia was noted in relation to MoCA, we failed to find a significant effect when animal naming was investigated. It is possible that in the absence of obesity, the cognitive impact of sarcopenia is limited to global cognition and certain subdomains such as executive function and speed of processingCitation12,Citation13 rather than semantic memory.
Supporting the results of the one study reporting on the association between SO and cognitive functioning that we are aware of,Citation24 we found that the risk of poor global cognition is even higher in older adults who present with low MM and strength in the context of high fat mass. This is line with dose–response associations with other negative health outcomes including all-cause mortality.Citation43 However, we found a less consistent effect for obesity alone when sarcopenia is not present. This differential finding as it relates to global cognitive performance may stem from several differences in methodologic and analytical approaches. While we used high BMI and PBF to define obesity in our study, Levine and Crimmins used WC, which may be a better measure of visceral adiposityCitation24 and therefore more likely to be associated with negative health outcomes than other obesity measures, particularly BMI.Citation45 Another difference relates to the study population, our participants being slightly younger (25% were 76+ years), which may have diluted the effects at least for obesity.
Further, our study contributes to the current body of knowledge by identifying specific cognitive abilities that may be impaired in individuals with evidence of SO. Executive function is reduced in obese older adults,Citation9 and improvement in muscular function has been linked to enhancement of executive function in senior adults.Citation46 In our study, obesity and sarcopenia were associated with lower executive function when assessed independently and even more so when they occurred together. Obesity may contribute to the risk of impaired executive function through vascular, behavioral, metabolic, and inflammatory mechanisms or can result from reduced impulse control, self-monitoring, and goal-directed behavior in individuals with impaired executive functionCitation47 with a negative effect on the ability to maintain energy balance.Citation2 Sarcopenia, in turn, has been linked to impairments in abilities that relate to conflict resolution and selective attention.Citation46 Other cognitive skills may be impaired in sarcopenic older adults whether or not in the presence of obesity including orientation to time and space. How and in what direction this latter association may operate should be further investigated. Impaired ability to place oneself in time and space can lead to loss of independence and therefore identifying modifiable risk factors can help this at-risk group age in place.
Several interrelated mechanisms may explain the obesity-sarcopenia-cognitive dysfunction link including decreased participation in physical activity, low-grade chronic inflammation, oxidative stress, and insulin resistance,Citation48 all of which being by-products of the aging process. Our study was not designed to investigate potential mediators of the SO-cognitive impairment association due to data unavailability, although there is empirical support for the metabolic pathways.Citation24 These and other proposed mechanisms should be continued to be investigated in the quest of finding the most effective interventions to delay or prevent cognitive impairment, muscle impairment, and/or adiposity.
Study limitations relate to the cross-sectional design, the population studied, as well as other methodological issues. Although we observed a consistent association between sarcopenia with or without obesity in our study, due to the cross-sectional nature of our study, we were unable to investigate the direction of this association. Prospective studies will be instrumental in assessing the predictive role of SO on rate of cognitive decline and/or development of cognitive impairment and dementia in older adults. Also, our body composition measures may have led to an underestimation of obesity. For example, PBF has been found to be underestimated when using BIA as compared to DXA absorptiometry in obese children.Citation49 However, a high correlation between these two methods of measuring body composition was reported in middle-aged adults.Citation33 In addition, depression, which can have a negative impact on performance testing, may confound the observed effects. However, a sensitivity analysis restricted to participants with low levels of depression (eg, HADS-D <11) yielded similar results especially when PBF was used to measure obesity (Est.=−3.08±1.01, p=0.003 and Est.=−3.30±1.03, p=0.002 SO vs controls when Miller’s SPSM and low MM and/or strength, respectively, were used). Finally, some concern may arise from the investigation of global- and domain-specific cognitive outcomes derived from one cognitive measure (ie, MoCA). We sought to avoid this potential limitation by incorporating two cognitive measures that were independent of the MoCA: animal naming and TMA, with similar results. The screening nature of the study under investigation precluded the inclusion of a detailed neuropsychological battery to assess cognitive function. The consistency of our results that held across different SO definitions and cognitive function measures, along with the relatively large sample of a racially diverse population, and the use of established measures are positive indicators that these reported associations are not due to chance alone.
Conclusion
Sarcopenia, either alone or in the presence of obesity, can be used in clinical practice to estimate potential risk of cognitive impairment. BIA and grip strength by dynamometry can be easily administered within the time constraints of a clinic visit, and BMI is already usually collected as part of Annual Wellness visits. Further research is needed to determine whether SO is a simple correlate of cognitive performance or also has a role in the processes that lead to cognitive loss and dementia. Sarcopenic obese older adults may benefit from interventions designed to lower the risk of cognitive loss by improving/countering the age-related imbalance between MM and function.
Author contributions
All authors contributed toward data analysis, drafting and critically revising the paper and agree to be accountable for all aspects of the work.
Acknowledgments
Data collection and analysis were supported by grants awarded to JEG by the National Institutes of Health (R01 AG040211 and P30 AG008051), the Morris and Alma Schapiro Fund, and the New York State Department of Health (DOH-2011-1004010353).
Disclosure
The authors report no conflicts of interest in this work.
References
- CournotMMarquiéJCAnsiauDRelation between body mass index and cognitive function in healthy middle-aged men and womenNeurology20066771208121417030754
- GunstadJPaulRHCohenRATateDFSpitznagelMBGordonEElevated body mass index is associated with executive dysfunction in otherwise healthy adultsCompr Psychiatry2007481576117145283
- MrakREAlzheimer-type neuropathological changes in morbidly obese elderly individualsClin Neuropathol2009281404519216219
- HoAJRajiCABeckerJTCardiovascular Health StudyADNI. Obesity is linked with lower brain volume in 700 AD and MCI patientsNeurobiol Aging20103181326133920570405
- RajiCAHoAJParikshakNNBrain structure and obesityHum Brain Mapp201031335336419662657
- WhitmerRAGundersonEPQuesenberryCPJrZhouJYaffeKBody mass index in midlife and risk of Alzheimer disease and vascular dementiaCurr Alzheimer Res20074210310917430231
- MillerAASpencerSJObesity and neuroinflammation: a pathway to cognitive impairmentBrain Behav Immun201442102124727365
- WhitmerRAGustafsonDRBarrett-ConnorEHaanMNGundersonEPYaffeKCentral obesity and increased risk of dementia more than three decades laterNeurology200871141057106418367704
- SmithEHayPCampbellLTrollorJNA review of the association between obesity and cognitive function across the lifespan: implications for novel approaches to prevention and treatmentObes Rev201112974075521991597
- HsuYHLiangCKChouMYAssociation of cognitive impairment, depressive symptoms and sarcopenia among healthy older men in the veterans retirement community in southern Taiwan: a cross-sectional studyGeriatr Gerontol Int201414Suppl 110210824450567
- ToleaMIGalvinJESarcopenia and impairment in cognitive and physical performanceClin Interv Aging20151066367125878493
- ScherderEJEggermontLHGeuzeRHVisJVerkerkeGJQuadriceps strength and executive functions in older womenAm J Phys Med Rehabil201089645846320216058
- CanonMECrimminsEMSex differences in the association between muscle quality, inflammatory markers, and cognitive declineJ Nutr Health Aging201115869569821968867
- RoubenoffRExercise, sarcopenia, cognition, and moodNestle Nutr Workshop Ser Clin Perform Programme20026151159 discussion 160–162
- BerrCBalansardBArnaudJRousselAMAlpérovitchACognitive decline is associated with systemic oxidative stress: the EVA study. Etude du Vieillissement ArtérielJ Am Geriatr Soc200048101285129111037017
- DimitriadisGMitrouPLambadiariVMaratouERaptisSAInsulin effects in muscle and adipose tissueDiabetes Res Clin Pract201193Suppl 1S52S5921864752
- GeroldiCFrisoniGBPaolissoGInsulin resistance in cognitive impairment: the InCHIANTI studyArch Neurol20056271067107216009759
- BurnsJMJohnsonDKWattsASwerdlowRHBrooksWMReduced lean mass in early Alzheimer disease and its association with brain atrophyArch Neurol201067442843320385908
- KilgourAHFergusonKJGrayCDNeck muscle cross-sectional area, brain volume and cognition in healthy older men: a cohort studyBMC Geriatr2013132023446137
- Alfaro-AchaAAl SnihSRajiMAKuoYFMarkidesKSOttenbacherKJHandgrip strength and cognitive decline in older Mexican AmericansJ Gerontol A Biol Sci Med Sci200661885986516912105
- BoylePABuchmanASWilsonRSLeurgansSEBennettDAAssociation of muscle strength with the risk of Alzheimer disease and the rate of cognitive decline in community-dwelling older personsArch Neurol200966111339134419901164
- JohnsonDKWilkinsCHMorrisJCAccelerated weight loss may precede diagnosis in Alzheimer diseaseArch Neurol20066391312131716966511
- SanderlinAHAlsibaiABozokiAThe effect of obesity on severity of cognitive impairment and neuropsychiatric symptoms in MCI subjects (I12-4B)Neurology20158414 Suppl
- LevineMECrimminsEMSarcopenic obesity and cognitive functioning: the mediating roles of insulin resistance and inflammation?Curr Gerontol Geriatr Res2012201282639822611388
- NewmanABKupelianVVisserMStrength, but not muscle mass, is associated with mortality in the health, aging and body composition study cohortJ Gerontol A Biol Sci Med Sci2006611727716456196
- NasreddineZSPhillipsNABédirianVThe Montreal Cognitive Assessment, MoCA: a brief screening tool for mild cognitive impairmentJ Am Geriatr Soc200553469569915817019
- SagerMAHermannBPLa RueAWoodardJLScreening for dementia in community-based memory clinicsWMJ200610572529
- BaumgartnerRNBody composition in healthy agingAnn N Y Acad Sci200090443744810865787
- NewmanABKupelianVVisserMHealth ABC Study InvestigatorsSarcopenia: alternative definitions and associations with lower extremity functionJ Am Geriatr Soc200351111602160914687390
- JanssenIHeymsfieldSBRossRLow relative skeletal muscle mass (sarcopenia) in older persons is associated with functional impairment and physical disabilityJ Am Geriatr Soc200250588989612028177
- StenholmSHarrisTBRantanenTVisserMKritchevskySBFerrucciLSarcopenic obesity: definition, cause and consequencesCurr Opin Clin Nutr Metab Care200811669370018827572
- Cruz-JentoftAJBaeyensJPBauerJMEuropean Working Group on Sarcopenia in Older PeopleSarcopenia: European consensus on definition and diagnosis: Report of the European Working Group on Sarcopenia in Older PeopleAge Ageing201039441242320392703
- MillerDKMalmstromTKAndresenEMDevelopment and validation of a short portable sarcopenia measure in the African American health projectJ Gerontol A Biol Sci Med Sci200964338839419181712
- World Health OrganizationObesity: preventing and managing the global epidemic. Report of a WHO ConsultationWHO Technical Report Series 894 Available from: http://www.who.int/nutrition/publications/obesity/WHO_TRS_894/en/. Published 2000Accessed February 2, 2018
- DavisonKKFordESCogswellMEDietzWHPercentage of body fat and body mass index are associated with mobility limitations in people aged 70 and older from NHANES IIIJ Am Geriatr Soc200250111802180912410898
- ZigmondASSnaithRPThe hospital anxiety and depression scaleActa Psychiatr Scand19836763613706880820
- YanagitaMWillcoxBJMasakiKHDisability and depression: investigating a complex relation using physical performance measuresAm J Geriatr Psychiatry200614121060106817138811
- FitzgeraldPBSrithiranABenitezJAn fMRI study of prefrontal brain activation during multiple tasks in patients with major depressive disorderHum Brain Mapp200829449050117525987
- KilanderLNymanHBobergMLithellHCognitive function, vascular risk factors and education. A cross-sectional study based on a cohort of 70-year-old menJ Intern Med199724243133219366810
- EliasMFEliasPKSullivanLMWolfPAD’AgostinoRBObesity, diabetes and cognitive deficit: the Framingham Heart StudyNeurobiol Aging200526Suppl 1111616223549
- KuoHKJonesRNMilbergWPCognitive function in normal-weight, overweight, and obese older adults: an analysis of the Advanced Cognitive Training for Independent and Vital Elderly cohortJ Am Geriatr Soc20065419710316420204
- SturmanMTde LeonCFBieniasJLMorrisMCWilsonRSEvansDABody mass index and cognitive decline in a biracial community populationNeurology200870536036717881716
- AtkinsJLWhincupPHMorrisRWLennonLTPapacostaOWannametheeSGSarcopenic obesity and risk of cardiovascular disease and mortality: a population-based cohort study of older menJ Am Geriatr Soc201462225326024428349
- LemieuxSPrud’hommeDBouchardCTremblayADesprésJPA single threshold value of waist girth identifies normal-weight and overweight subjects with excess visceral adipose tissueAm J Clin Nutr19966456856938901786
- KleinSAllisonDBHeymsfieldSBAssociation for Weight Management and Obesity PreventionNAASO, The Obesity SocietyAmerican Society for NutritionAmerican Diabetes AssociationWaist circumference and cardiometabolic risk: a consensus statement from shaping America’s health: Association for Weight Management and Obesity Prevention; NAASO, the Obesity Society; the American Society for Nutrition; and the American Diabetes AssociationAm J Clin Nutr20078551197120217490953
- Liu-AmbroseTNagamatsuLSGrafPBeattieBLAsheMCHandyTCResistance training and executive functions: a 12-month randomized controlled trialArch Intern Med2010170217017820101012
- LezakMDHowiesonDBBiglerEDTranelDNeuropsychological Assessment5th edNew YorkOxford University Press2012
- ZamboniMMazzaliGFantinFRossiADi FrancescoVSarcopenic obesity: a new category of obesity in the elderlyNutr Metab Cardiovasc Dis200818538839518395429
- EisenkölblJKartasuryaMWidhalmKUnderestimation of percent-age fat mass measured by bioelectrical impedance analysis compared to dual energy X-ray absorptiometry method in obese childrenEur J Clin Nutr200155642342911423918