 ?Mathematical formulae have been encoded as MathML and are displayed in this HTML version using MathJax in order to improve their display. Uncheck the box to turn MathJax off. This feature requires Javascript. Click on a formula to zoom.
Abstract
Purpose
To determine the prevalence of sarcopenia and investigate relationships among body composition, muscle strength, and physical function in elderly women in low-level aged care.
Subjects and methods
Sixty-three ambulatory women (mean age 86 years) participated in this cross-sectional study where body composition was determined by dual energy X-ray absorptiometry (DXA); ankle, knee, and hip strength by the Nicholas Manual Muscle Tester; and physical function by ‘timed up and go’ (TUG) and walking speed (WS) over 6 meters. Body composition data from a female reference group (n = 62, mean age 29 years) provided cut-off values for defining sarcopenia.
Results
Elderly women had higher body mass index (P < 0.001), lower lean mass (P < 0.001), and higher fat mass (P < 0.01) than the young reference group. Only a small proportion (3.2%) had absolute sarcopenia (defined by appendicular skeletal muscle mass/height squared) whereas 37% had relative sarcopenia class II (defined by percentage skeletal muscle mass). Scores for TUG and WS indicated relatively poor physical function, yet these measures were not associated with muscle mass or indices of sarcopenia. In multivariate analysis, only hip abductor strength predicted both TUG and WS (both P = 0.01).
Conclusion
Hip strength is a more important indicator of physical functioning than lean mass. Measurement of hip strength may therefore be a useful screening tool to detect those at risk of functional decline and requirement for additional care. Further longitudinal studies with a range of other strength measures are warranted.
Introduction
Body composition changes with aging, even in relatively healthy elderly. From middle adulthood, height declines, while body weight initially increases, then also declines from around the age of 65 years.Citation1,Citation2 These body weight changes reflect changes in body composition. After middle age fat mass (FM) gradually increases while lean tissue mass (LTM) decreases.Citation3,Citation4 Marked age-related loss of skeletal muscle mass (SMM) is known as sarcopenia and is associated with loss of strength, functional impairment, and disability.Citation5,Citation6
Sarcopenia has proved difficult to define. BaumgartnerCitation7 used absolute terms, defining sarcopenia as present when appendicular skeletal muscle mass (ASM) normalized for (height)Citation2 falls below two standard deviations (SD) of the sex-specific mean for a young adult reference population. In contrast, JanssenCitation8 used relative terms, defining sarcopenia as % SMM adjusted for weight and using cut points (<1 or <2 SD) drawn relative to the sex-specific mean of a young adult reference group. By either method, sarcopenia is independently associated with self-reported functional impairment and physical disability.Citation7,Citation8
As SMM declines with aging, muscle strength also decreases.Citation9 This relationship is nonlinear so that over time, the strength decline exceeds the decline in SMM by a factor of 3:1,Citation9 and SMM no longer closely reflects muscle strength.Citation9–Citation11 The question therefore arises as to whether muscle strength is a more important determinant of physical function and disability than the quantity of SMMCitation12,Citation13 in elderly women.
To date, most studies on body composition and physical function in the elderly have focused on healthy, community dwelling individuals.Citation7–Citation9,Citation11–Citation13 Few have investigated institutionalized elderly who, by virtue of their need for care, are more likely to exhibit sarcopenia and physical impairment than their community dwelling counterparts.Citation14 In Australia, one in three who live in aged care accommodation reside in low-level care facilities.Citation15 Despite their semi-independent status, relative mobility, and capacity for self-care, there is a high prevalence of malnutrition,Citation16 which is a risk factor for sarcopenia.Citation5 Moreover, the detection of sarcopenia and/or reduced muscle strength in these elderly is important as a predictor of morbidity risk and need for higher level care.Citation17
Physical function in elderly people has been assessed by the timed ‘up and go’ test (TUG), and by walking speed over 6 meters (WS). TUG is considered a satisfactory measurement of balance in the elderly,Citation18 while WS is reflective of general well being.Citation19 Both measures are more objective than the self-reported activity measures frequently used in studies in the elderlyCitation18 and both have well established risk identification cut points.Citation19–Citation22 The objectives of this study were to measure body composition by the optimal measure of dual energy X-ray absorptiometry (DXA),Citation23 in elderly Australian women living in low-level care accommodation; to determine the prevalence of sarcopenia (defined in absolute or relative terms) and to investigate relationships among body composition, muscle strength, and physical function.
Materials and methods
Study design and participants
Participants were Caucasian women residing in low-level aged care facilities in metropolitan Melbourne, Australia. Low-level care caters for semi-independent ambulatory elderly who are ‘relatively healthy’, as distinct from high-level care which caters for those with severe chronic illness and/or disability.Citation24 An assessment of medical, physical, social, and psychological needs is first made to determine eligibility for entrance to care. Low-level care facilities in Australia typically provide a lower level of nursing support and provide fewer allied health services such as physiotherapy and podiatry relative to high-level care. Data were obtained at the initial assessment of elderly women from 14 low-level aged care hostels who were recruited into a two-year cluster randomized control trial.Citation16 Women were enrolled if they were ambulatory and able to self-feed. Women were excluded only if they were non-Caucasian or unable to communicate in English. As a consequence of their residential status, all received considerable assistance with daily activities whether this was required or not. While 78 women were recruited, this study consists of the 63 women for whom DXA data were complete. The 15 women with missing data were of similar age and body mass index (BMI) to those studied (data not shown). The study was approved by the Human Research Ethics Committee, Austin Health and by the Standing Committee on Ethics in Research involving Humans, Monash University.
Young adult reference group
As there are no published standard values for body composition for Australian adults, and no single set of accepted definitions for sarcopenia, local reference population data were acquired and used to determine cut-off values for sarcopenia. Data were obtained from 62 apparently healthy, nonsmoking Caucasian women aged 18–40 years and with BMI 17.9–35.4 kg/m2 who were recruited from the local community.Citation25 Their body composition was determined by DXA as described also for the elderly female cohort (see below). Young women were excluded from this reference group if they currently smoked, were non-Caucasian, had a history of reduced bone mineral density or osteoporotic fractures, had used oral or intravenous corticosteroids, or were pregnant.
Muscle strength assessment
Muscle strength was assessed by an objective method: determination of the maximal isometric strength of the ankle dorsiflexers, knee extensors, and hip abductors on both legs using a hand held dynamometer – the Nicholas Manual Muscle Tester (NMMT; Lafayette Instruments, Lafayette, IN).Citation26 One experienced technician (BK) performed all strength assessments on 53 elderly women. Women with missing data were of similar age and body composition (data not shown). The NMMT quantifies the breaking force (in kg) necessary to depress a limb when held in a specific position. Each muscle group on the right and left legs was assessed in two separate trials and the average maximal force observed at each site was used for analysis. Each average maximal force (in kg) was multiplied by 9.81 to convert it to newtons (N), then divided by body weight (kg) to provide a measure of isometric strength (N/kg).Citation27 The intraclass correlation coefficient of all measures was above 0.93 (P < 0.001), indicating high reproducibility.Citation28
Isometric strength testing measures static muscle force and does not take into account dynamic muscle performance which includes muscle work, muscle power, and muscle impulse, as in isokinetic strength measurement. Hence, isometric strength does not necessarily reflect the strength an individual might exhibit in a dynamic test.Citation29 However, isometric strength testing of the lower extremity, using a hand held device has been found to be both reliable and valid in older people.Citation30
Assessment of physical function
Physical function was determined by TUG and WS over a 6 m distance as described by Hill et al.Citation26 TUG reflects the time in seconds taken to stand from a seated position, walk 3 m, turn around, walk back, and sit down again. To determine WS, women walk at a comfortable speed over 8 m while the time taken (in seconds) to walk the central 6 m is recorded. A walking speed (m/second) is then calculated. One technician (BK) performed all function tests.
Anthropometry
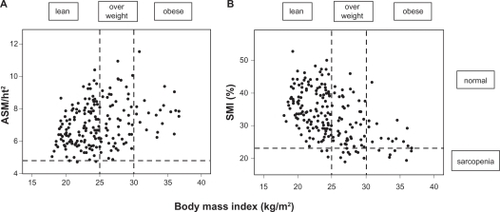
Body weight was measured to ± 0.1 kg on an electronic scale (SECA, Hamburg, Germany) with participants wearing light indoor clothing and no shoes. Standing height was measured using a stadiometer (Holtain, Crosswell, UK). BMI was calculated as weight divided by height squared (kg/m2). Underweight was defined as BMI < 20 kg/m2, normal weight as BMI 20–24.9 kg/m2, overweight as BMI 25–29.9 kg/m2, and obesity as BMI >30 kg/m2. In , BMI < 25 kg/m2 is described as ‘lean’.
Figure 1 ASM/ht2 (A) or SMI% (B) in lean (BMI < 25.0), overweight (BMI 25.0–29.9) and obese (BMI ≥ 30) in elderly women in low-level care.
Dual-energy X-ray absorptiometry
Elderly participants and the young reference population underwent whole body DXA scans to provide estimates of LTM and FM (Prodigy, Version 7.51; GE Lunar, Madison, WI and DPX-IQ, software version 4.7e; Lunar Radiation Corporation, Madison, WI, respectively) using the standardized procedures of the manufacturer. These machines provide similar measures of body composition.Citation31–Citation33 Calibration against a standard block was performed daily, while precision monitoring against a standard lumbar spine bone mineral density phantom was undertaken weekly. No systematic long-term bias was evident in the phantom data. DXA scans were analysed by a single radiographer for each study group. Appendicular skeletal muscle mass (ASM) was calculated from the sum of LTM for the arms plus legs.Citation34 Total skeletal muscle mass (SMM) was determined from ASM using the predictive equation of Kim:
where sex = 0 for females.Citation35
Body composition indices
To determine absolute sarcopenia, ASM was adjusted for stature (ASM/height squared (kg/m2)).Citation7 Percentage skeletal muscle (SMI%) was computed as (SMM/weight (kg) × 100), to determine relative sarcopenia, after calculation of SMM as above from DXA-derived ASM.Citation35 Three categories of sarcopenia were defined; normal if ASM/ht2 or SMI% were <1 SD from the mean of the young reference group; class I sarcopenia if the index fell between >1 SD and <2 SD; and class II sarcopenia if the index was <2 SD below the mean for the young reference group.Citation8
Other covariates
Age (in years) was calculated as the difference between the date of examination and date of birth. Comorbidity was defined as the number of current chronic conditions based on medical record report of cardiovascular disease, stroke, cancer, diabetes, arthritis, kidney disease, or lung disease. A registered nurse recorded disease conditions from the medical records maintained at each facility.
Data analysis
Data were analysed using SPSS for Windows (Version 16; SPSS Australasia Ltd, Melbourne, Australia). Continuous data were checked for normality, outlying scores, and missing data. Nonnormal data were transformed and outliers transformed to one unit above/below the next most extreme score. Descriptive data are given as the mean ± SD or as percentages. Differences between groups were tested via Student’s unpaired t-test, differences for categorical data were tested via the χ2 test and relationships among variables were examined using Pearson’s correlation. As missing values occurred at random (as indicated by Little’s χ2 test), missing data points were estimated by an expectation maximization algorithm,Citation36 before undertaking multivariate analyses. A value of P < 0.05 was taken as significant.
Results
All 63 elderly study participants were ambulatory although 56% had arthritis. Cardiovascular disease, lung disease, and renal disease were present in 38%, 11%, and 8%, respectively, while 13% had previously had cancer and 6% had diabetes. None of the women had GP-diagnosed active cancer at the time of assessment. Medical conditions were found not to be associated with age, body composition, strength, or physical functioning (data not shown). The body composition of these elderly women was compared to that of a young, healthy female reference population ().
Table 1 Characteristics of elderly institutionalized Australian women compared with a reference group of healthy young Australian women
Although body weight did not differ, the elderly were significantly shorter (P < 0.001) and had higher mean BMI (P < 0.001), lower LTM (P < 0.001), but higher total FM (P < 0.01). ASM/ht2 was similar to that of the younger women indicating that their lower level of LTM supported a similar weight but a higher FM. In contrast, SMI% was significantly lower in older women (P < 0.001). also provides strength and function measures for the elderly group. Here, those above the median age of 86 years had significantly lower strength, WS, and TUG than younger elderly (all P < 0.01, data not shown).
The mean ASM/ht2 for the young reference group was 6.31 ± 0.73 kg/m2 yielding cut-off values for normal ASM/ht2, class I, and class II sarcopenia of >5.58 kg/m2, 4.85–5.58 kg/m2, and <4.85 kg/m2, respectively. The mean SMI% for the young reference group was 32.91 ± 4.56% providing corresponding cut-off values for normal SMI%, class I, and class II sarcopenia of >28.4%, 23.8%–28.4%, and <23.8%, respectively. shows the proportion of the elderly population categorized according to these cut-off values.
Table 2 Proportion of elderly institutionalized Australian women categorized according to different body composition indices (n = 63)
compares the prevalence of absolute (ASM/ht2) versus relative (SMI%) sarcopenia according to BMI. Only 3.2% of the women were underweight, 38.1% were of normal weight, 39.7% were overweight while 19% were obese. Defining sarcopenia by ASM/ht2 identified few women (3.2%) as sarcopenic, all of whom were lean, with a mean BMI of 24.4 kg/m2. Defining sarcopenia with SMI% identified more women (36.5%), the majority of whom were overweight or obese, with a mean BMI of 29.1 kg/m2. Absolute sarcopenia was prevalent in significantly more lean women (P < 0.001), whilst relative sarcopenia was more prevalent in overweight and obese women (P < 0.01).
The two measures of physical function used in this study TUG and WS, were strongly related to each other (r = 0.699, P < 0.001). Age-adjusted relationships between these two function outcomes and measures of body composition and sarcopenia are presented in .
Table 3 Relationship between measures of physical function and strength with measures of body composition and sarcopenia in elderly institutionalized Australian women (n = 63). Data show Pearson’s correlations. Relationships have been adjusted for age
TUG and WS were most strongly associated with hip abductor strength (r = −0.42, P < 0.01 and r = 0.47, P < 0.001, respectively). While both measures were also associated with ankle dorsiflexor strength (r = −0.31, and r = 0.34, both P < 0.05, respectively), only WS was related to knee extensor strength (r = −0.23, P < 0.05). Neither TUG nor WS were found to be related to any measures of body composition. TUG also showed an unexpected positive association with absolute sarcopenia (r = 0.28, P < 0.05).
Women with the highest physical function (in the tertile with shortest TUG and quickest WS) were next compared with women with the poorest physical function (the tertile with longest TUG and slowest WS) ().
Table 4 Elderly women with good physical function compared to poor physical functionTable Footnotea
The women with poor physical function were significantly older (P < 0.01) and had significantly lower strength measures at each site (P < 0.05 at ankle and knee; P < 0.01 at the hip). There were however, no differences in BMI, SMI, or measures of body composition between the two groups. ASM/ht2 was significantly higher (P < 0.05) in the women with poor physical function consistent with the weak positive relationship found between ASM/ht2 and TUG (). Yet the higher ASM/ht2 in the women with poor physical function did not reflect significant difference in ASM but rather appeared related to differences in body height since women with poor physical function tended to be shorter (P = 0.07).
In a multivariate model including ankle, knee, and hip measures of strength, only hip abductor strength predicted TUG and WS (both P ≤ 0.05), explaining 6.6% and 7.3% of the variation respectively (Model A, ). Addition of age and LTM (model B) resulted in a small increase in the total R2 value of the model: for TUG, R2 increased from 19%–25% (P < 0.01) while for WS, R2 increased from 22%–28% (P < 0.01). Again, the only statistically significant strength measure was that of the hip abductors, explaining 10.3% of the variation in TUG and 10.5% of the variation in WS (both P = 0.01, Model B, ). Age was a predictor of WS (P < 0.05) and also tended to predict TUG (P = 0.08) while LTM was not a predictor of physical function. In further analyses, both absolute and relative sarcopenia indices were also not predictors of physical function (data not shown).
Table 5 Relationships between muscle strength and TUG or WS explored in a multivariate model
Discussion
This study examines sarcopenia and physical function in elderly Australian women living in low-level aged care. Two common indices of sarcopenia, ASM/ht2 and SMI% defined different populations. Only ASM/ht2 showed any association with physical function (TUG, ) and this association was weak, in an unexpected positive direction and might be explained by differences in body height (). Elderly women were shorter than younger women, possibly as a result of vertebral compression following reduced bone mineral density.Citation37 Comparisons between women of high versus poor physical function indicated clear differences in ankle, knee, and especially hip strength but none in body composition (). Moreover, hip strength was a significant predictor of physical function. Hip strength therefore appears to be a more important indicator of physical function in this population than measures of muscle quantity (defined by LTM or sarcopenic indices).
Our population of elderly women had clearly different body composition from the young women used as a reference group. These differences of reduced muscle mass, increased FM, and increased percentage total fat are consistent with previous reports.2,Citation3,Citation38 Additionally, the relatively high prevalence of overweight and obesity in our elderly women was comparable with that seen in other elderly women residing at homeCitation39,Citation40 or in aged care.Citation41 Their low LTM was also similar to that found in healthy community-dwelling elderly women.Citation42
The reported prevalence of sarcopenia in elderly populations differs with age and gender, the definition of sarcopenia applied and the normative data used for comparison. We compared the absolute method of BaumgartnerCitation7 with the relative method of Janssen.Citation8 In the absence of universally accepted reference rangesCitation42 and the presence of ethnic differences,Citation43 cut-off values should be selected from an ethnically similar, local reference population who have been measured in a similar way, using a similar DXA scanner.Citation44 The use of Australian reference data from a population with similar height and weight to the general Australian Caucasian population,Citation45 is one strength of our study. In contrast, reference populations used by BaumgartnerCitation7 and JanssenCitation8 included African Americans and Mexican Americans who differ in LTM,Citation4,Citation46 and infrequently live in Australia. Among other reference populations,Citation7,Citation8,Citation40 only those from ItalyCitation40 align with those we report here, which justifies the application of our own cutoffs for sarcopenia.
Reported prevalence of sarcopenia in elderly populations ranges from 5%–50%.Citation47 Applying Australian cut-off values, 3.2% of our elderly women had absolute sarcopenia. This is lower than in America or in Europe where prevalence ranges between 16%–43%Citation3,Citation48,Citation49 and 9.5%–12.3%,Citation2,Citation38,Citation50 respectively. In addition, 42.9% of our elderly women had relative sarcopenia, class I, while 36.5% had relative sarcopenia, class II. The prevalence of class II sarcopenia is higher than the 10% reported by JanssenCitation8 or the 21% approximated from Estrada.Citation49 Our data are also consistent with Estrada’s finding that relative and absolute measures of sarcopenia define two distinct populations,Citation49 with absolute sarcopenia more common in lean women and relative sarcopenia more common in overweight or obese women. Where obesity is present the relative measure appears more physiologically and clinically relevant since it is better at detecting reduction in mobility.Citation49
Poor physical function can be defined by TUG > 12 seconds.Citation20 In our study, 73% of women had TUG > 12 seconds, intermediate between the prevalence of 91% reported for institutionalized mobile women, and 8% reported for community dwelling elderly women.Citation20 WS also indicates poor physical function in elderly populations and is predictive of adverse outcomes: those with WS < 0.6 m/sec are at increased risk of functional decline and death.Citation19 In our elderly population, 43% of women had WS < 0.6 m/sec. Mean WS was 0.67 m/sec, appreciably slower than for community dwelling, elderly Australians where the mean WS was 0.99 m/sec.Citation26 Our results therefore suggest that institutionalized women in low-level care have poorer physical function than women who reside in the community. This is not surprising given that institutionalized women have been assessed as requiring additional care, however, it does signal a higher risk of adverse outcomes and the need for programs to improve physical functioning.
Absolute sarcopenia has been associated with limited physical function in some,Citation7,Citation8,Citation51 but not all,Citation40,Citation50 cases where physical function has been measured by self-report. When physical function was measured objectively,Citation49 little association between absolute sarcopenia and physical function has been evident. In contrast, a relationship between relative sarcopenia and limited physical function has been found regardless of whether physical function was self-reportedCitation7,Citation8,Citation40,Citation51 or measured objectively.Citation49 In our study, absolute sarcopenia was weakly associated only with TUG but not with WS, while relative sarcopenia was unrelated to either measure (). The discrepancy with findings in the literature may relate to over- or under-estimation of functional ability with self-reported measures,Citation52 or may be due to exclusion of some possible confounders when analyses have been performed.
Measures of muscle mass have also been shown to be predictive of muscle functionCitation11,Citation12,Citation53 although the association is no longer observed after adjustment for muscle strength.Citation11,Citation12 In contrast we found no association between LTM or any other measure of body composition and TUG or WS. Decreased strength, as measured by either knee extensors/flexors or hand grip strength has been associated with worse physical function,Citation9,Citation11,Citation12,Citation53–Citation55 and in all cases except one,Citation53 muscle mass has been found to be a nonsignificant variable compared with muscle strength. Indeed, Visser has concluded that underlying muscle strength can explain any association between muscle mass and physical function.Citation11,Citation12 Most previous studies however, have targeted generally healthy, higher functioning elderly of less advanced age making comparison with our functionally limited, older group difficult.
In our study, the most important variables related to physical function (as assessed by TUG and WS) were ankle, knee, and particularly hip strength (). In multivariate analyses, only hip abductor strength predicted physical function (although age also predicted WS). Most previous studies assessing leg strength and physical function have used knee extensor/flexor and/or ankle dorsiflexor strength as a proxy for lower extremity strength.Citation55 Few report the contribution made by differing muscle groups to physical function. Here we assess the strength of three different muscle groups, finding that whilst strength in each group was associated with function in univariate analysis, once all measures were taken into account, only hip abductors were significantly associated with function. All three muscle groups examined are important for normal gait and strength deficiencies in any group affect gait and gait speed. Poor hip abductor strength affects pelvic stabilization, allowing tilting of the pelvis along with slowing of gait.Citation56 Hip extensors also appear particularly important for the activities of daily living.Citation27 The dominant effect of hip strength as reported here has not always been apparent in earlier studies. For example, in one study, strength of hip extensors and abductors was only weakly associated with gait speed and the ability to rise from a chair, although when these measures were combined with measures of leg and ankle strength, and normalized for weight, significant associations with performance emerged.Citation56 Conditions of loading may have affected these findings. Another study reported that the strength of hip flexors and knee extensors only predicted physical function under conditions of a light load (<15 kg and <10 kg, respectively; neither normalized to weight).Citation57 Rantanen however, in an examination of WS in disabled elderly women, found a load threshold affected knee extensor strength only and not hip flexor strength.Citation58 No other published studies have assessed hip abductor strength and physical function. Further studies discriminating between specific muscle groups and describing their relative importance in maintaining function in the elderly are therefore now needed.
The strong relationship between strength and physical function evident in our study indicates the importance of maintaining strength in elderly women. Progressive resistance strength training can achieve this.Citation59,Citation60 Resistance programs recommended for elderly people usually continue for 8–12 weeks with high intensity exercise 2–3 times per week. As possible adverse effects remain poorly documented, care must be taken in planning and implementing such programs. Nonetheless, resistance training has been used successfully in a group of institutionalized nonagenarians.Citation61 At present, the Accreditation Standards for Aged Care in Australia make no recommendation for exercise programs or resistance training.Citation62
A number of limitations in this study need to be acknowledged. The study is cross-sectional in nature, so causality cannot be imputed. It was also based on a relatively small sample in which those incapable of self consent were not included. Nevertheless, it is the first study to describe body composition by DXA in elderly women in low-level residential care, to estimate the prevalence of sarcopenia by different indices, and to describe the relationships among body composition, muscle strength of different muscle groups, and objectively measured physical function.
In conclusion, this study shows similar body composition parameters and prevalence of sarcopenia, but poorer physical functioning, in elderly women in low-level care to those reported for community-dwelling elderly women. It also demonstrates that in these elderly women, hip strength is a better predictor of physical function rather than muscle mass. As muscle mass and sarcopenic indices were unrelated to physical function, measurement of muscle mass seems an inappropriate screening tool to detect physical function limitations or requirements for additional care in this elderly group. This is consistent with the absence of muscle mass as a criterion to identify frailty in one screening tool.Citation63 Measurement of muscle strength predicted physical functioning in our present study is clinically simple to perform and appears a better screening tool than muscle mass for an elderly population. Further longitudinal studies in this group using a range of strength measures and taking into account physical activityCitation64 and fitness are now warranted.
Acknowledgements
We would like to thank the staff and residents of the aged-care facilities and the young reference group members for their cooperation and participation in the study. We would also like to acknowledge research nurses Sheila Matthews, Judy Tan, and Kylie King who sourced medical data on residents and Bereha Khorda for performing muscle strength testing. Shea Edsall’s help with initial analyses on the two groups is also appreciated. The larger trial in which this study was nested was funded by Dairy Australia.
Disclosure
No conflicts of interest were declared in relation to this paper.
References
- SeidellJCVisscherTLBody weight and weight change and their health implications for the elderlyEur J Clin Nutr200054Suppl 3S33S3911041073
- KyleUGGentonLHansDKarsegardLSlosmanDOPichardCAge-related differences in fat-free mass, skeletal muscle, body cell mass and fat mass between 18 and 94 yearsEur J Clin Nutr200155866367211477465
- BaumgartnerRNStauberPMMcHughDKoehlerKMGarryPJCross-sectional age differences in body composition in persons 60+ years of ageJ Gerontol A Biol Sci Med Sci1995506M307M3167583802
- GallagherDVisserMDe MeersmanREAppendicular skeletal muscle mass: effects of age, gender, and ethnicityJ Appl Physiol19978312292399216968
- RoubenoffRHughesVASarcopenia: current conceptsJ Gerontol A Biol Sci Med Sci1220005512M716M72411129393
- ThomasDLoss of skeletal muscle mass in aging: examining the relationship of starvation, sarcopenia and cachexiaClin Nutr200726438939917499396
- BaumgartnerRNKoehlerKMGallagherDEpidemiology of sarcopenia among the elderly in New MexicoAm J Epidemiol199814787557639554417
- JanssenIHeymsfieldSBRossRLow relative skeletal muscle mass (sarcopenia) in older persons is associated with functional impairment and physical disabilityJ Am Geriatr Soc200250588989612028177
- GoodpasterBHParkSWHarrisTBThe loss of skeletal muscle strength, mass, and quality in older adults: the Health, Aging and Body Composition StudyJ Gerontol A Biol Sci Med Sci200661A10105917077199
- HughesVAFronteraWRWoodMLongitudinal muscle strength changes in older adults: influence of muscle mass, physical activity, and healthJ Gerontol A Biol Sci Med Sci200156A5B20911320101
- VisserMGoodpasterBHKritchevskySBMuscle mass, muscle strength, and muscle fat infiltration as predictors of incident mobility limitations in well-functioning older personsJ Gerontol A Biol Sci Med Sci200560A332415860469
- VisserMDeegDJLipsPHarrisTBBouterLMSkeletal muscle mass and muscle strength in relation to lower-extremity performance in older men and womenJ Am Geriatr Soc200048438138610798463
- NewmanABKupelianVVisserMStrength, but not muscle mass, is associated with mortality in the Health, Aging and Body Composition Study cohortJ Gerontol A Biol Sci Med Sci200661A17216456196
- BauerJMKaiserMSieberCCSarcopenia in nursing home residentsJ Am Med Dir Assoc20089854555119083287
- Australian Institute of Health and WelfareResidential Aged Care in Australia 2005–06: A Statistical Overview Aged Care Statistics Series nr 24 Cat No AGE 54CanberraAIHW2007
- WoodsJLWalkerKZIuliano-BurnsSStraussBJMalnutrition on the menu: nutritional status of institutionalised elderly Australians in low-level careJ Nutr Health Aging200913869369819657552
- KendigHBrowningCPedlowRWellsYThomasSHealth, social and lifestyle factors in entry to residential aged care: an Australian longitudinal analysisAge Ageing201039334234920233734
- PodsiadloDRichardsonSThe timed up and go: a test of basic functional mobility for frail elderly personsJ Am Geriatr Soc19913921421481991946
- Abellan Van KanGRollandYAndrieuSGait speed at usual pace as a predictor of adverse outcomes in community-dwelling people: an International Academy on Nutrition and Aging (IANA) taskforceJ Nutr Health Aging2009131088188919924348
- BischoffHAStahelinHBMonschAUIdentifying a cut-off point for normal mobility: comparison of the timed ‘up and go’ test in community dwelling and institutionalised elderly womenAge Ageing200332331532012720619
- BohannonRWReference values for the timed up and go test: a descriptive meta-analysisJ Geriatr Phys Ther2006292646816914068
- Cruz-JentoftAJBaeyensJPBauerJMSarcopenia: European consensus on definition and diagnosis: report of the European working group on sarcopenia in older peopleAge Ageing201039441242320392703
- WoodrowGBody composition analysis techniques in the aged adult: implications and limitationsCurr Opin in Clin Nutr Metab Care2009121814
- Department of Health and AgeingAged Care in AustraliaCanberraCommonwealth of Australia2006
- KingSJNyulasiIBStraussBKotsimbosTBaioleyMWilsonJWFat-free mass depletion in adult cystic fibrosis is associated with lung disease severity but is poorly detected by body mass indexNutrition2010267–875375919931415
- HillKSchwarzJFlickerLCarrollSFalls among healthy, community-dwelling, older women: a prospective study of frequency, circumstances, consequences and prediction accuracyAust NZ J Public Health19992314148
- HasegawaRIslamMSung ChulLKoizumiDRogersMTakeshimaNThreshold of lower body muscular strength necessary to perform ADL independently in community-dwelling older adultsClin Rehabil20082210–1190218955422
- CleophasTJZwindermanAHCleophasTFCleophasEPStatistics Applied to Clinical TrialsBerlin, GermanySpringer2009
- ShrawanKMuscle strengthBoca Raton, FLCRC Press2004
- ArnoldCWarkentinKChilibeckPMagnusCThe reliability and validity of handheld dynamometry for the measurement of lower-extremity muscle strength in older adultsJ Strength Cond Res201024381582419661831
- PlankLDDual-energy X-ray absorptiometry and body compositionCurr Opin Clin Nutr Metab Care20058330530915809534
- GentonLHansDKyleUGPichardCDual-energy X-ray absorptiometry and body composition: differences between devices and comparison with reference methodsNutrition2002181667011827768
- HullHHeQThorntonJJavedFAllenLWangJiDXA, Prodigy, and DPXL Dual-energy X-ray absorptiometry whole-body scans: a cross-calibration studyJ Clin Densitom20091219510219028125
- HeymsfieldSBSmithRAuletMAppendicular skeletal muscle mass: measurement by dual-photon absorptiometryAm J Clin Nutr19905222142182375286
- KimJWangZHeymsfieldSBBaumgartnerRNGallagherDTotal-body skeletal muscle mass: estimation by a new dual-energy X-ray absorptiometry methodAm J Clin Nutr200276237838312145010
- TabachnickBGFidellLSUsing multivariate statistics5th edBoston, MAPearson International2007
- BriotKLegrandEPouchainDMonnierSRouxCAccuracy of patient-reported height loss and risk factors for height loss among postmenopausal womenCan Med Assoc J2010182655856220308271
- Gillette-GuyonnetSNourhashemiFAndrieuSBody composition in French women 75+ years of age: the EPIDOS studyMech Ageing Dev2003124331131612663128
- Krahnstoever DavisonKFordESCogswellMEDietzWHPercentage of body fat and body mass index are associated with mobility limitations in people aged 70 and older from NHANES IIIJ Am Geriatr Soc200250111802180912410898
- ZoicoEDi FrancescoVGuralnikJPhysical disability and muscular strength in relation to obesity and different body composition indexes in a sample of healthy elderly womenInt J Obes (Lond)2004282234241
- GriegerJANowsonCAAcklandMAnthropometric and biochemical markers for nutritional risk among residents within an Australian residential care facilityAsia Pac J Clin Nutr200716117818617215196
- SchutzYKyleUGPichardCFat-free mass index and fat mass index percentiles in Caucasians aged 18–98 yInt J Obes Relat Metab Disord200226795396012080449
- KyleUGGentonLLukaskiHCComparison of fat-free mass and body fat in Swiss and American adultsNutrition200521216116915723744
- Van der SluisIMde RidderMABootAMKrenningEPde Muinck Keizer-SchramaSMReference data for bone density and body composition measured with dual-energy X ray absorptiometry in white children and young adultsArch Dis Child200287434134612244017
- Australian Bureau of StatisticsNational Nutrition Survey Nutrient intakes and physical measurements Australia 1995Canberra, AustraliaCommonwealth of Australia1998
- TravisonTGAraujoABEscheGRMcKinlayJBThe relationship between body composition and bone mineral content: threshold effects in a racially and ethnically diverse group of menOsteoporos Int2008191293817660933
- MorleyJSarcopenia: diagnosis and treatmentJ Nutr Health Aging200812745245618615226
- MorleyJEAnorexia, body composition, and ageingCurr Opin Clin Nutr Metab Care20014191311122553
- EstradaMKleppingerAJudgeJOWalshSJKuchelGAFunctional impact of relative versus absolute sarcopenia in healthy older womenJ Am Geriatr Soc200755111712171917979895
- RollandYLauwers-CancesVCournotMSarcopenia, calf circumference, and physical function of elderly women: a cross-sectional studyJ Am Geriatr Soc20035181120112412890076
- MeltonLJIIIKhoslaSCrowsonCSO’ConnorMKO’FallonWMRiggsBLEpidemiology of sarcopeniaJ Am Geriatr Soc200048662563010855597
- GuralnikJMSimonsickEMFerrucciLA short physical performance battery assessing lower extremity function: association with self-reported disability and prediction of mortality and nursing home admissionJ Gerontol1994492M85M948126356
- ReidKNaumovaECarabelloRPhillipsEFieldingRLower extremity muscle mass predicts functional performance in mobility-limited eldersJ Nutr Health Aging200812749318615232
- VisserMNewmanABNevittMReexamining the sarcopenia hypothesis. Muscle mass versus muscle strengthAnn N Y Acad Sci200090445646110865789
- LauretaniFRussoCRBandinelliSAge-associated changes in skeletal muscles and their effect on mobility: an operational diagnosis of sarcopeniaJ Appl Physiol20039551851186014555665
- BrownMSinacoreDRHostHHThe relationship of strength to function in the older adultJ Gerontol A Biol Sci Med Sci199550A55597493219
- FerrucciLGuralnikJMBuchnerDDepartures from linearity in the relationship between measures of muscular strength and physical performance of the lower extremities: the Women’s Health and Aging StudyJ Gerontol A Biol Sci Med Sci199752A5M275M2859310081
- RantanenTGuralnikJMIzmirlianGAssociation of muscle strength with maximum walking speed in disabled older womenAm J Phys Med Rehabil19987742993059715919
- LathamNKBennettDAStrettonCMAndersonCSSystematic review of progressive resistance strength training in older adultsJ Gerontol A Biol Sci Med Sci200459A14814718486
- LiuC-JLathamNKProgressive resistance strength training for improving physical function in older adultsCochrane Database Syst Rev200983CD00275919588334
- FiataroneMAMarksECRyanNDMeredithCNLipsitzLAEvansWJHigh-intensity strength training in nonagenarians: effects on skeletal muscleJAMA199026322302930342342214
- Office of Legislative Drafting and PublishingQuality of Care Principles 1997Canberra, AustraliaThe Attorney-General’s Department2010
- FriedLPTangenCMWalstonJNewmanABFrailty in older adults: evidence for a phenotypeJ Gerontol A Biol Sci Med Sci200156A3M146M15611253156
- KosterAVisserMSimonsickEMAssociation between fitness and changes in body composition and muscle strengthJ Am Geriatr Soc58221922620370856