
Abstract
Objectives
To evaluate the predicative power of the electrical risk score (ERS), a noninvasive and inexpensive test obtained by means of a standard 12-lead electrocardiogram (ECG), in a cohort of elderly patients who had undergone transcatheter aortic valve replacement (TAVR).
Methods
Survivors and non-survivors after TAVR at 1-year follow-up were compared in respect to the pre-procedural ERS as well as a number of other clinical and instrumental variables. ERS is composed of seven simple ECG markers: heart rate (>75 bpm); QRS duration (>110 ms); left ventricular hypertrophy (Sokolow–Lyon criteria); delayed QRS transition zone (≥ V4); frontal QRS-T angle (>90°); long QTBazett (>450 ms for men and >460 in women) or JTBazett (330 ms for men and >340 ms for women); and long Tpeak to Tend interval (Tp-e) (>89 ms). The trial was registered in ClinicalTrials.gov as NCT3145376.
Results
A total of 40 patients were evaluated. During the follow-up, the all-cause mortality rate was 25% (ten patients) with 15% of cardiovascular death (six patients). The ERS was the strongest predictor of all-cause (odds ratio 3.73, 95% CI: 1.44–9.66, P<0.05) or cardiovascular (odds ratio 3.95, 95% CI: 1.09–14.27, P<0.05) mortality. Receiver operating characteristic curves showed that ERS had the widest significant sensitivity-specificity area under the curve (AUC) predicting all-cause (AUC: 0.855, P<0.05) or cardiovascular mortality (AUC: 0.908, P<0.05).
Conclusion
ERS seems to be a useful noninvasive tool able to stratify the risk of mortality in 1-year follow-up of TAVR patients. These findings, however, require larger trials to be confirmed.
Introduction
Symptomatic senile degenerative aortic stenosis (AS) leads to a progressive deterioration of quality of life and it is associated with an elevated mortality.Citation1 The most recent guidelines for the treatment of valvular heart disease identify the degenerative AS as the most common valve disease in Western countries, especially in the group aged over 65 years.Citation2–Citation5 In its most severe form, AS represents a highly debilitating chronic disease characterized by symptoms such as precordial pain suggestive of angina, transient altered state of consciousness, or syncope, dyspnea and other heart failure symptoms secondary to a reduced stroke volume. After the onset of symptoms, in the case of no valve replacement procedure, the survival is less 50% within the first 2 years.Citation6,Citation7 Given that the conventional thoracic surgical approach is usually impossible in very elderly patients, transcatheter aortic valve replacement (TAVR) is often preferred even if this type of procedure suffers from a high perioperative risk.Citation8 Up to now, a multidisciplinary evaluation (interventional cardiologist and expert in cardiovascular imaging, geriatrician, anesthesiologist etc.) is usually required to assess the patient’s TAVR suitability.Citation10,Citation11 Indeed, the inclusion criteria for such a procedure are hemodynamic (mean aortic gradient, left ventricular ejection fraction, stroke volume index, etc.), anatomical (aortic valve and root morphology, etc.) and, obviously, clinical (symptoms, comorbidities, frailty, physical and cognitive functions, nutrition evaluation). Furthermore, TAVR is considered futile, and hence contraindicated, in those cases where the life expectancy is lower than 1 year due to comorbidities, despite a successful procedure, or when a chance of “survival with benefit” is lower than 25% at 2 years.Citation10,Citation11 However, it remains often difficult to exclude a potential benefit and, consequently, to establish the TAVR futility in a great percentage of patients,Citation9 so that further implementation of the current strategies with additional variables is highly desirable. In such a context, the electrical risk score (ERS),Citation12 an easy marker obtained from a standard 12-lead electrocardiogram (ECG), could represent a noninvasive and inexpensive useful clinical tool. Indeed, in senile AS, the prolonged systolic overload induced both anatomical and electrical remodelingCitation13 and the major ECG findings associated with AS are also included in the ERS index (hypertrophy, intraventricular conduction delay, repolarization alterations). Aortic valve replacement can be associated with a reverse remodeling and more favorable outcome.
This actual retrospective study sought to investigate the possible utility of ERS in TAVR patients’ selection. Briefly, we hypothesized that an increased ERS could be able to help the physician in identifying those patients with irreversible ventricular damageCitation14–Citation17 and, accordingly, help to predict a poor survival and, hence, a TAVR futility. To verify this hypothesis, we calculated the pre-procedural ERS in a cohort of patients who underwent TAVR and collected the overall and cardiovascular mortality data after 1-year follow-up.
Methods and materials
Participants and protocol
A total of 42 consecutive symptomatic patients with AS were evaluated for TAVR at Policlinico Umberto I University Hospital between March 2015 and September 2016. At the time of the first evaluation, patients’ general data, a 12-lead ECG, a preoperative transthoracic Doppler echocardiographic evaluation (left ventricular telediastolic and telesistolic diameter, interventricular septum and posterior wall thickness, transvalvular aortic gradients/ regurgitation, aortic valve area, left ventricular ejection fraction, and left ventricular mass), and a full clinical assessment were recorded. The latter also included the following: the Mini-Mental State Examination (MMSE) to screen possible cognitive impairment; the Cumulative Illness Rating Scale (CIRS) to evaluate patients’ comorbidities; the Activity of Daily Living (ADL) and Instrumental Activities of Daily Living (IADL) to evaluate the independence of the patients in everyday activities; the Mini-Nutritional Assessment (MNA) to estimate possible problems in the nutritional status; and the Short Form Health Survey-36 (SF-36) to assess the patient’s quality of life, adjusted for age and sex among the Italian population. Furthermore, the Clinical Frailty Scale (CSF) was calculated to assess the impairment of patients in a scale from 1 (very fit) to 9 (terminally), considering data from the whole geriatric evaluation previously performed.Citation18 Exclusion criteria for TAVR was a moderate-to-severe frailty score (≥6).Citation11
The endpoint, retrospectively analyzed, was the all-cause and cardiovascular mortality at 1 year. The study was approved by the Ethical Committee of Azienda Universitaria Policlinico Umberto I. All participants provided their written informed consent. The trial was registered in ClinicalTrials.gov as NCT3145376.
Electrocardiographic analysis
Each enrolled patient had a stored resting 12-lead ECG (Esaote, model: MyCardioPad/XL 12 channels, Florence, Italy) available for the analysis (paper speed was 25 mm/s and calibration 10 mm/mV). Those patients with ECG evidence of atrial flutter or II/III-degree atrioventricular block, pre-excitation, or paced rhythm were excluded from analysis.
Heart rate, QRS duration, left ventricular hypertrophy (Sokolow–Lyon criteria), delayed QRS transition zone, frontal QRS-T angle, long QTBazett or JTBazett, and long Tpeak to Tend interval (Tp-e) compose the ERS.Citation11 In this score 1 and 0 were assigned respectively for an abnormal or normal ECG electrical value, and a score ≥4 was considered predictive of high risk for mortality.Citation12 Abnormal ECG data were considered as the following: a heart rate >75 bpm, QRS duration >110 ms, the left ventricular hypertrophy, achieved with the Sokolow–Lyon criteria, the QRS transition ≥ 4th precordial lead (V4), the frontal QRS-angle >90°, and Tp-e >89 ms.Citation12 Frontal QRS-T angle was calculated as the difference between T wave and QRS axis; in case the difference between QRS and T axis was higher than 180°, QRT-T angle was calculated by subtracting these achieved degrees from 360°.Citation19 Moreover, with regard to repolarization phase, we used the QT for QRS <120 ms and JT for QRS for >120 ms.Citation20,Citation21 In both cases we corrected these two intervals by the Bazett method (QTBazett : QT/RR0.5 and JTBazett: JT/RR0.5). Respectively, a QTBazett interval >450 ms for men and >460 ms for women, a JTBazett, a value >330 ms for men and >340 ms for women were considered prolonged and then a risk factor for mortality.Citation22,Citation23 An expert cardiologist analyzed all ECGs in our electrocardiographic laboratory calculating the ERS for each patient in a pre-procedural ECG.
Statistical analysis
We compared the baseline study data obtained before TAVR between the dead and surviving patients after 1-year follow-up. Normally distributed continuous variables are reported as mean and standard deviation and are compared using Student’s t-test with Levene’s test for homogeneity of variance. Non-normally distributed variables are expressed as median and inter-quartile range (IQR) and compared using the Mann–Whitney U test. Categorical variables are presented as frequencies and percentage and compared using the chi-squared test. Receiver operating characteristic (ROC) curves were used to determine the sensitivity and specificity of the studied parameters predictive of all-cause and cardiovascular mortality, and areas under ROC curves and 95% confidence intervals (CI) were calculated to compare the diagnostic efficiencies.
Uni- and multivariable forward (Wald) stepwise logistic regression analysis were used to determine the association between all-cause mortality or cardiovascular mortality and the other selected clinical, functional, echocardiographic, and electrical covariates included in the study model. Included covariates were: age, gender, body mass index, blood pressure, New York Heart Association (NYHA) class, MMSE, CIRS ADL, IADL, MNA, SF-36, aortic peak gradient, aortic mean gradient, ejection fraction, stroke volume index, cardiac index, left ventricular mass index, heart rate, QRS, QTc, JTC, Tp-e, QRS-T angle, QRS transition zone, electrocardiography left ventricular hypertrophy, and ERS.
Results
Forty-two patients underwent a complete evaluation; two patients were excluded from the TAVR procedure due to high level of comorbidities (Frailty score ≥6).
Of the 40 patients included in the study, within the first year of follow-up, a total of 10 patients died (overall mortality rate 25%). Specifically, six patients died from cardiovascular diseases (CVDs; two from heart failure worsening and four from stroke) (mortality rate 15%), and four patients died for non-CVDs (three patients for respiratory infections and one for malignancy) (mortality rate 10%). At the time of presentation, all patients were in III or IV NYHA functional class (). Clinical and demographic characteristics are reported in , together with the type of valve implanted. In the pre-procedural evaluation, most of the clinical characteristics, functional assessment, and drug therapy were similar between survivors and non-survivors. Nevertheless, the survivors showed a significantly higher level of left ventricular ejection fraction, cardiac, and stroke volume indexes with regard to the subjects who died from cardiovascular issues (ejection fraction: 51±8 vs 37% ± 3%, P<0.001; cardiac index: 2.2±0.3 vs 1.9±0.3 L/m2, P<0.05; stroke volume index: 33±5 vs 27±5 mL/m2, P<0.05) and of all-cause mortality (survivors vs deceased patients, ejection fraction: 51±8 vs 38% ± 5%, P<0.001; cardiac index: 2.2±0.3 vs 1.7±0.4 L/m2, P<0.05; stroke volume index: 33±5 vs 27±4 mL/m2, P<0.05). The survivors showed a significantly lower level of peripheral resistances in comparison with the deceased patients from CVDs (survivors vs deceased patients: peripheral resistances: 1,983±561 vs 2,650±612 arbitrary units, P<0.05) and for all-cause mortality (survivors vs deceased patients: peripheral resistances: 1,983±561 vs 2,723±544 arbitrary units, P<0.05). We did not find any differences between subjects for other echocardiographic data.
Table 1 General characteristics of the transcatheter aortic valve replacement patients
Figure 1 Comparison between survivors and cardiovascular mortality cases regarding the significant ECG data, obtained baseline.
Abbreviations: ECG, electrocardiogram; ERS, electrical risk score; TAVR, transcatheter aortic valve replacement; V4, 4th precordial lead.
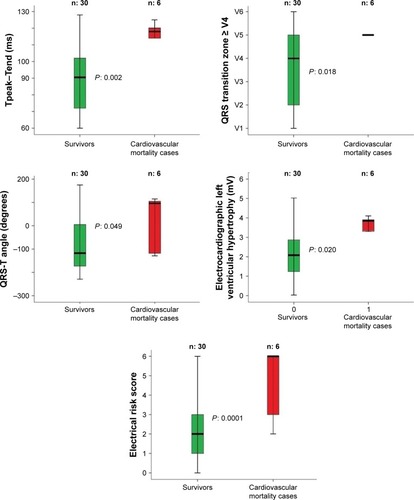
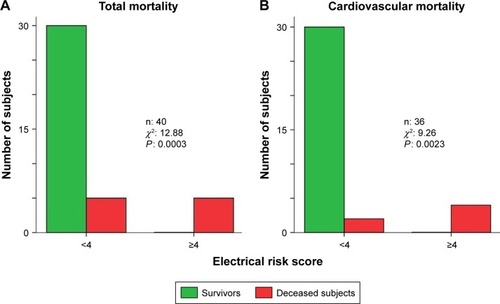
Regarding the ECG data (), the survivors showed lower electrical noninvasive parameters than the deceased subjects for cardiovascular or non-cardiovascular causes (). Particularly, in comparison with the deceased subjects for CVDs, the survivors reported a significant lower level of: Tp-e (survivors vs deceased patients: 89±20 vs 117±7 ms, P<0.05), QRS transition zone (survivors vs deceased patients: V4 ±1 vs V5 ±2, P<0.05), QRS-T angle (survivors vs deceased patients: -111, IQR 181 vs 96, IQR 228°, P<0.05), electrocardiogram left ventricular hypertrophy (survivors vs deceased patients: 2±1 vs 3±1 mV, P<0.05), and whole ERS (survivors vs CVD patients: 2±1 vs 5±2 score, P<0.001) (). We pointed out almost the same pattern for the deceased subjects for all-cause mortality. Specifically, survivors had lower levels of: Tp-e (survivors vs deceased patients: 89±20 vs 110±11 ms, P<0.05), QRS transition zone (survivors vs deceased patients: V4 ±1 vs V5 ±2, P<0.05), electrocardiogram left ventricular hypertrophy (survivors vs deceased patients: 2±1 vs 3±1 mV, P<0.05), and ERS (survivors vs deceased patients: 2±1 vs 4±2 score, P<0.001) (). All survivors had an ERS value lower than 4, both considering the cardiovascular and non-cardiovascular mortality ().
Table 2 Electrocardiographic measures in the transcatheter aortic valve replacement patients
Table 3 Electrocardiographic abnormal markers in the transcatheter aortic valve replacement patients
Figure 2 Comparison between survivors and total mortality cases regarding the significant ECG data, obtained baseline.
Notes: In particular, the survivor subjects after 1 year of TAVR follow-up showed a significant lower pre-TAVR: Tpeak–Tend segment, QRS transition zone, electrocardiogram left ventricular hypertrophy, and ERS. In the box plots, the central line represents the median distribution. Each box spans from 25 to 75th percentile points, and error bars extended from 10 to 90th percentile points.
Abbreviations: ECG, electrocardiogram; ERS, electrical risk score; TAVR, transcatheter aortic valve replacement.
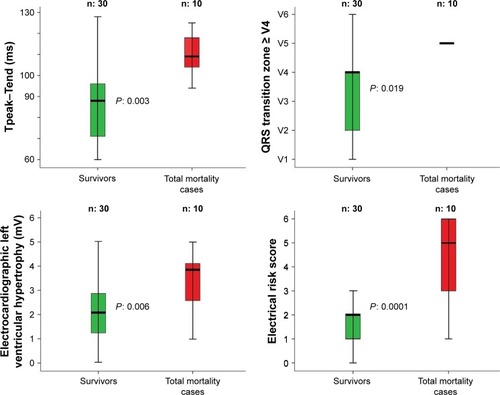
Figure 3 We reported the total (A) and cardiovascular (B) mortality in the subjects with less or equal or higher than four electrical risk score in the study subjects.
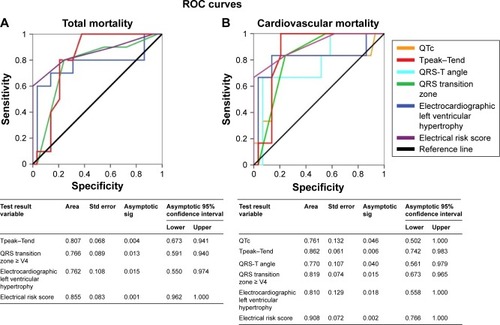
The ERS variable showed the ROC curves with the highest sensitivity/specificity both for all-cause (AUC: 0.855, P<0.05) and cardiovascular mortality (AUC: 0.908, P<0.05) (). Other variables with statistical significance were Tp-e (P<0.05), QRS transition zone (P<0.05), electrocardiography left ventricular hypertrophy (P<0.05) for the all-cause mortality () and all these electrical parameters and QTc (P<0.05) and QRS-T angle (P<0.05) for the cardiovascular mortality, too (). Hemodynamic variables reported extremely low accuracy values for all-cause or cardiovascular mortality; aortic valve gradients or left ventricular mass index (LVMI) AUC did not report any statistical significance.
Figure 4 Receiver operating characteristic curve (ROC) analysis showing that the electrical risk score (ERS) was the best predictor of total (A) or cardiovascular (B) mortality in TAVR patients.
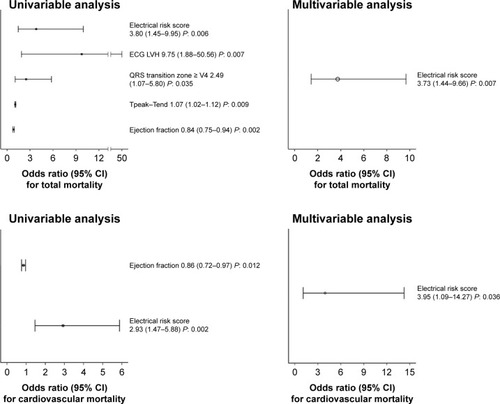
Univariable logistic regression analysis reported a significant relationship between all-cause mortality and ERS (P<0.05), ejection fraction (P<0.05), ECG hypertrophy (P<0.05), QRS transition zone (P<0.05), Tp-e (P<0.05) () and between cardiovascular mortality and ERS (P<0.05) and ejection fraction (P<0.05) (). Multivariable logistic regression analysis only selected ERS as the significant risk factor for all-cause (odds ratio 3.73, 95% CI: 1.44–9.66, P<0.05) or cardiovascular mortality (odds ratio 3.95, 95% CI: 1.09–14.27, P<0.05) ().
Figure 5 Odds ratio for electrical risk score, electrocardiographic left ventricular hypertrophy (ECG LVH), QRS transition zone > V4, Tpeak–Tend interval, ejection fraction in respect to total and cardiovascular mortality in uni- or multivariable analysis.
Discussion
The most important finding of our study was that a simple and almost inexpensive score obtained from the standard 12-lead electrocardiogram is significantly higher in TAVR subjects with high risk of mortality at 1-year follow-up. Thus, we could reasonably consider the ERS as a useful tool in managing TAVR patients’ selection. In particular, our data show that all surviving patients had an ERS value below 4 while half of the patients who died showed an ERS equal or higher than 4. The ROC curves showed that the ERS had the widest significant sensitivity-specificity AUC predicting all-cause or cardiovascular mortality and, even, the multivariable forward stepwise logistic regression analysis selected the ERS as the most significant risk factor of the all-cause or cardiovascular mortality and it excluded the ejection fraction or stroke volume index as risk factors, which are the usual markers with the more reliable level of predictively.Citation14–Citation17
The ERS is composed of seven different electrocardiographic markers, each of them an expression of electrical and structural cardiac damage. In such context, it is likely that the noninvasive ECG variables are earlier markers of mortality risk given that they depend on imbalanced neuro-autonomic control (heart rate, QTc, and Tp-e), on the repolarization alterations (QTc, QRS-angle, and Tp-e) and on cardiac hypertrophy (QTc, QRS-angle, QRS transition, and Tp-e), all of them known markers of poor outcome in chronic heart failure and coronary artery disease.
Between the seven noninvasive ECG markers, included in the ERS, heart rate is the simplest and apparently trivial. We can consider heart rate with a double clinical meaning: firstly as a mere index of heart failure decompensation and secondly as an instantaneous marker of autonomic cardiovascular control. Indeed, in AS patients the sympathetic control prevails on the vagal and baroreceptor activity thus leading to an increase of heart rate, of myocardial oxygen demand, and relative ischemia with a tendency to ventricular and supraventricular arrhythmias. A great number of observations indicates that the increase of resting heart rate was an important risk factor for mortality in the chronic heart failure.Citation24–Citation26 In contrast, the QTc or JTc, and Tp-e are markers of ventricular repolarization delay and ventricular arrhythmia tendency. In particular, prolonged QTc and Tp-e express an excessive length of the action’s potential duration, the ventricular damage, and loss of ionic channel controls. Moreover, the cardiac hypertrophy and heart failure induce an abnormal potassium channel function and a reduction of the repolarization reserve.Citation27 On the other hand, although controversial,Citation28,Citation29 Tp-e is thought to be associated with the apico-basal and transmural action potential duration gradientsCitation30 and influenced by autonomic nervous system in several CVD settings.Citation31–Citation33 Both QTc and Tp-e increase in cases of cardiac hypertrophy, ischemia, and heart failure, and they represent known risk factors of all-cause cardiovascular mortality.Citation34–Citation39 In particular, a relationship was observed between outcome and QTc in severe AS with low flow, low gradient, reduced ejection fraction, and mortality.Citation40 Obviously, the QTc measurement does not make any sense in the presence of complete left bundle branch block and, in such a case, the use of the JTc interval is more appropriate.Citation20,Citation21,Citation41 The QRS duration, the transition QRS zone, the electrical left ventricular hypertrophy, and the frontal QRS-T angle are influenced by myocardial mass and fibrosis. Particularly, the QRS duration, a marker of intraventricular conduction, was independently related to all-cause mortality,Citation42 especially in patients with severe AS and low flow, low gradient and reduced ejection fraction.Citation43 In our study, half of the subjects reported an increase of QRS duration, more than 110 ms, a cutoff assigned in the original paper by Aro et al on ERS.Citation12 The transition zone at V4 or leftward of V4 on chest, otherwise known as the clockwise rotation (Minnesota code: 9-4-2)Citation44 was recently associated with an increase of all-causeCitation45,Citation46 or cardiovascular mortalityCitation45 or to a heart failureCitation46 in subjects apparently free from CVD. Another study reported that the delayed transition zone was related to the left ventricular mass and that this electrical marker, independently from the left ventricular ejection fraction, was a risk predictor of sudden cardiac death.Citation12 In our study, 38% of subjects showed the delayed transitional zone. In a paper dealing with this electrical marker, authors preferred to exclude the subjects with left or right bundle branch block, because in their study the intraventricular block could be considered a confounding factor. In that study, the authors analyzed the possible predictive role of the different QRS transition zones (counterclockwise, clockwise and no rotation) on mortality.Citation46 Subjects with counterclockwise rotation showed a lower risk of mortality; obviously in subjects with the right bundle branch block, we can always observe counterclockwise rotation, with a deep S in V2 and therefore that electrocardiographic picture could be interpreted as a favorable condition (false negative). To exclude possible false negative results, the authors decided not to include all intraventricular conduction disturbances. In contrast, in our study we observed only subjects with left bundle branch block (38%) and clockwise rotation. Another marker, most likely the most popular one, included in the ERS is the left ventricular Sokolow–Lyon voltage criteria. It is a weak maker of left hypertrophy degree,Citation47 but it is independently associated with the severity of valvulopathyCitation48 and it is predictive of poor prognosis in patients with asymptomatic AS.Citation49 Lastly, the frontal QRS-T angle higher than 90°, a measure of both depolarization and repolarization disturbance, was studied in populations with various risk patterns of cardiovascular or all-cause mortality,Citation50,Citation51 but not particularly in AS elderly patients. However, the pressure overload,Citation51,Citation52 the left ventricular hypertrophy,Citation53 and agingCitation54 were reported as the most important causes of this electrical marker increase. Obviously, for this reason our data detected an increase of this marker in the AS in 30% of subjects.
In conclusion, the power of the ERS was not only a simple sum of different electrocardiographic markers, but it could be an inexpensive multilevel cardiac diagnostic tool capable of investigating the myocardial damage in the degenerative AS.
Study limitations
The small number of patients enrolled together with the low number of events represent an obvious limitation that allows us to suggest, rather than to affirm, that the ERS might improve the TAVR patients’ selection. Larger studies would be strongly encouraged to confirm our pilot observations.
Other possible limitation that should be acknowledged refers to Bazett’s formula for QT correction. Indeed, although routinely used in clinical practice, it overcorrects at elevated heart rates and under corrects at heart rates below 60 beats per minute (bpm) and hence is not an ideal correction. Fridericia’s correction is more accurate than Bazett’s correction in subjects with such altered heart rates. However, it should be highlighted that all patients evaluated in the present study had a heart rate between 60 and 90 bpm. Finally, other well-known electrical risk abnormalities (such as P wave duration, deep terminal negativity of the P wave, QRS fragmentation, ST segment depression and elevation, inverted T waves, T wave alternans, premature ventricular contractions) were not evaluated in the present study.
Acknowledgments
This study was funded by University “La Sapienza”; ClinicalTrials.gov number, NCT3145376.
Disclosure
The authors report no conflicts of interest in this work.
References
- KleczyńskiPBagieńskiMDziewierzATwelve-month quality of life improvement and all-cause mortality in elderly patients undergoing transcatheter aortic valve replacementInt J Artif Organs201639844444927716868
- VahanianAAlfieriOAndreottiFGuidelines on the management of valvular heart disease (version 2012). The Joint Task Force on the Management of Valvular Heart Disease of the European Society of Cardiology (ESC) and the European Association for Cardio-Thoracic Surgery (EACTS)Eur Heart J2012332451249622922415
- OsnabruggeRLMylotteDHeadSJAortic stenosis in the elderly: disease prevalence and number of candidates for transcatheter aortic valve replacement: a meta-analysis and modeling studyJ Am Coll Cardiol201362111002101223727214
- European Society of CardiologyGuidelines on the management of valvular heart diseaseEur J Cardiothorac Surg2012424S1S4422922698
- NishimuraRAOttoCMBonowRO2014 AHA/ACC Guideline for the Management of Patients with Valvular Heart Disease: a report of the American College of Cardiology/American Heart Association Task Force on Practice GuidelinesCirculation201412923e521e64324589853
- SchwarzFBaumannPMantheyJThe effect of aortic valve replacement on survivalCirculation1982665110511107127696
- MakkarRRFontanaGPJilaihawiHTranscatheter aortic-valve replacement for inoperable severe aortic stenosisN Engl J Med Overseas Ed20123661816961704
- LeonMBSmithCRMackMTranscatheter aortic-valve implantation for aortic stenosis in patients who cannot undergo surgeryN Engl J Med Overseas Ed20103631715971607
- ReynoldsMRMagnusonEAWangKHealth-related quality of life after transcatheter or surgical aortic valve replacement in high-risk patients with severe aortic stenosis: results from the PARTNER (Placement of AoRTic TraNscathetER Valve) Trial (Cohort A)J Am Coll Cardiol201260654855822818074
- LindmanBRAlexanderKPO’GaraPTAfilaloJFutility, benefit, and transcatheter aortic valve replacementJACC Cardiovasc Interv20147770771624954571
- OttoCMKumbhaniDJAlexanderKPACC expert consensus decision pathway for transcatheter aortic valve replacement in the management of adults with aortic stenosis: a report of the American College of Cardiology task force on clinical expert consensus documentsJ Am Coll Cardiol201769101313134628063810
- AroALReinierKRusinaruCElectrical risk score beyond the left ventricular ejection fraction: prediction of sudden cardiac death in the Oregon Sudden Unexpected Death Study and the Atherosclerosis Risk in Communities StudyEur Heart J201738403017302528662567
- MagalhaesMAKoifmanETorgusonROutcome of left-sided cardiac remodeling in severe aortic stenosis patients undergoing transcatheter aortic valve implementationAm J Cardiol2015116459560326089011
- DouglasPSLeonMBMackMJLongitudinal hemodynamics of transcatheter and surgical aortic valves in the PARTNER TrialJAMA Cardiol20172111197120628973520
- BaronSJArnoldSVHerrmannHCImpact of ejection fraction and aortic valve gradient on outcomes of transcatheter aortic valve replacementJ Am Coll Cardiol201667202349235827199058
- PibarotPClavelMADoppler echocardiographic quantitation of aortic valve stenosis: a science in constant evolutionJ Am Soc Echocardiogr201629101019102227712803
- CarrerasETKanekoTRamirez-del ValFImpact of flow, gradient, and left ventricular function on outcomes after transcatheter aortic valve replacementCatheter Cardiovasc Interv20189141039
- RockwoodKSongXMacKnightCA global clinical measure of fitness and frailty in elderly peopleCan Med Assoc J2005173548949516129869
- ChuaKCMTeodorescuCReinierKWide QRS-T angle on the 12-lead ECG as a predictor of sudden death beyond the LV ejection fractionJ Cardiovasc Electrophysiol201627783383927094232
- RautaharjuPMZhangZ-MPrineasRHeissGAssessment of prolonged QT and JT intervals in ventricular conduction defectsAm J Cardiol20049381017102115081446
- CrowRSHannanPJFolsomARPrognostic significance of corrected QT and corrected JT interval for incident coronary heart disease in a general population sample stratified by presence or absence of wide QRS complex: the ARIC Study with 13 years of follow-upCirculation2003108161985198914517173
- RautaharjuPMSurawiczBGettesLSAHA/ACCF/HRS recommendations for the standardization and interpretation of the electrocardiogram: part IV: the ST segment, T and U waves, and the QT interval: a scientific statement from the American Heart Association Electrocardiography and Arrhythmias Committee, Council on Clinical Cardiology; the American College of Cardiology Foundation; and the Heart Rhythm Society. Endorsed by the International Society for Computerized ElectrocardiologyJ Am Coll Cardiol2009531198299119281931
- ShimizuHOhnishiYInoueTYokoyamaMQT and JT dispersion in patients with monomorphic or polymorphic ventricular tachycardia/ ventricular fibrillationJ Electrocardiol2001342119125
- LechatPHulotJSEscolanoSHeart rate and cardiac rhythm relationships with bisoprolol benefit in chronic heart failure in CIBIS II TrialCirculation2001103101428143311245648
- PocockSJWangDPfefferMAPredictors of mortality and morbidity in patients with chronic heart failureEur Heart J2006271657516219658
- RossiATemporelliPLCicoiraMBeta-blockers can improve survival in medically-treated patients with severe symptomatic aortic stenosisInt J Cardiol2015190151725912110
- RodenDMLong QT syndrome: reduced repolarization reserve and the genetic linkJ Intern Med20062591596916336514
- AntzelevitchCShimizuWYanGXThe M cell: its contribution to the ECG and to normal and abnormal electrical function of the heartJ Cardiovasc Electrophysiol19991081124115210466495
- OpthofTCoronelRWilms-SchopmanFJGDispersion of repolarization in canine ventricle and the electrocardiographic T wave: Tp-e interval does not reflect transmural dispersionHeart Rhythm20074334134817341400
- ArteyevaNVGoshkaSLSedovaKABernikovaOGAzarovJEWhat does the Tpeak–Tend interval reflect? An experimental and model studyJ Electrocardiol2013464296.e1296.e823473669
- PiccirilloGMagrìDPappadàMAAutonomic nerve activity and the short-term variability of the Tpeak-Tend interval in dogs with pacing-induced heart failureHeart Rhythm20129122044205023063868
- PiccirilloGRossiPMitraMIndexes of temporal myocardial repolarization dispersion and sudden cardiac death in heart failure: any difference?Ann Noninvasive Electrocardiol201318213013923530483
- PiccirilloGMoscucciFPascucciMInfluence of aging and chronic heart failure on temporal dispersion of myocardial repolarizationClin Interv Aging2013829330023662051
- BeinartRZhangYLimaJAThe QT interval is associated with incident cardiovascular events: the MESA studyJ Am Coll Cardiol201464202111211925457400
- AhnSVKimHCHurNWRelationship between corrected QT interval and cardiovascular risk factors in young healthy adults: the Kangwha studyJ Prev Med Public Health200639645546117168197
- IshikawaJIshikawaSKarioKRelationships between the QTc interval and cardiovascular, stroke, or sudden cardiac mortality in the general Japanese populationJ Cardiol201565323724225066337
- DekkerJMSchoutenEGKlootwijkPPoolJKromhoutDAssociation between QT interval and coronary heart disease in middle-aged and elderly men. The Zutphen StudyCirculation19949027797858044948
- TseGGongMWongWTThe Tpeak−Tend interval as an electrocardiographic risk marker of arrhythmic and mortality outcomes: A systematic review and meta-analysisHeart Rhythm20171481131113728552749
- BachmannTNSkovMWRasmussenPVElectrocardiographic Tpeak–Tend interval and risk of cardiovascular morbidity and mortality: results from the Copenhagen ECG studyHeart Rhythm201613491592426707793
- DahouAToubalOClavelMARelationship between QT interval and outcome in low-flow low-gradient aortic stenosis with low left ventricular ejection fractionJ Am Heart Assoc2016510e00398027792655
- TabatabaeiPKeikhavaniAHaghjooMAssessment of QT and JT intervals in patients with left bundle branch blockRes Cardiovasc Med201652e3152826949694
- PrihadiEALeungMVollemaEMPrevalence and prognostic relevance of ventricular conduction disturbances in patients with aortic stenosisAm J Cardiol2017120122226223229037444
- SebagFALelloucheNChaachouiNDubois-RandeJ-LGueretPMoninJ-LPrevalence and clinical impact of QRS duration in patients with low-flow/low-gradient aortic stenosis due to left ventricular systolic dysfunctionEur J Heart Fail201416663964724549756
- PrineasRCrowRSZhangZMThe Minnesota Code Manual of Electrocardiographic FindingsLondonSpringer-Verlag2010
- BradfordNShahAJUsoroAHaistyWKSolimanEZAbnormal electrocardiographic QRS transition zone and risk of mortality in individuals free of cardiovascular diseaseEuropace201517113113624938628
- PatelSKwakLAgarwalSKCounterclockwise and clockwise rotation of QRS transitional zone: prospective correlates of change and time-varying associations with cardiovascular outcomesJ Am Heart Assoc2017611pii:e006281
- SjöbergSSundhFSchlegelTThe relationship between electrocardiographic left ventricular hypertrophy criteria and echocardiographic mass in patients undergoing transcatheter aortic valve replacementJ Electrocardiol201548463063625865909
- GreveAMGerdtsEBomanKDifferences in cardiovascular risk profile between electrocardiographic hypertrophy versus strain in asymptomatic patients with aortic stenosis (from SEAS data)Am J Cardiol2011108454154721624542
- GreveAMBomanKGohlke-BaerwolfCClinical implications of electrocardiographic left ventricular strain and hypertrophy in asymptomatic patients with aortic stenosis: the Simvastatin and Ezetimibe in Aortic Stenosis studyCirculation2012125234635322147903
- OehlerAFeldmanTHenriksonCATereshchenkoLGQRS-T angle: a reviewAnn Noninvasive Electrocardiol201419653454225201032
- ZhongGWangYZhangYZhaoYAssociation between benzodiazepine use and dementia: a meta-analysisPLoS One2015105e012783626016483
- AtsmaFBartelinkM-LELvan der SchouwYTKorsJAGrobbeeDEElevated blood pressure and electrocardiographic frontal T axis and spatial QRS-T angle changes in postmenopausal womenJ Electrocardiol200841436036418353347
- ManSRahmattullaCMaanACRole of the vectorcardiogram-derived spatial QRS-T angle in diagnosing left ventricular hypertrophyJ Electrocardiol201245215416022074745
- van der EndeMYSilandJESniederHvan der HarstPRienstraMPopulation-based values and abnormalities of the electrocardiogram in the general Dutch population: The LifeLines Cohort StudyClin Cardiol2017401086587228605034