
Abstract
Purpose
Unwanted weight loss is one of the established criteria for the diagnosis of frailty. However, the relevance of this criterion to detect frailty in obese older adults has not been assessed. In particular, with the exception of malignancy, unwanted weight loss is not commonly seen in older obese subjects. Therefore, we tested the possibility that some obesity phenotypes and/or diabetes might be more useful in the detection of frailty in this setting.
Patients and methods
A preliminary cross-sectional study of 50 consecutive subjects was conducted at The Institute of Endocrinology, Metabolism and Hypertension, Tel-Aviv Sourasky Medical Center. Inclusion criteria were: young elderly (aged 65–75 years), with general and/or abdominal obesity, without cancer. Frailty was assessed directly using the Fried model, the five-item fatigue, resistance, ambulation, illnesses, and loss of weight (FRAIL) scale. Eventually, in the assessment of frailty, the weight loss criterion was replaced by one or several of obesity/diabetes-related variables each time: severity of obesity by body mass index, waist circumference (and their interaction), body fat, and diabetes. The receiver operating characteristic curves for functional impairment indices were plotted to compare the usefulness of the frailty accepted and adjusted models.
Results
The prevalence of frailty and pre-frailty in this cohort were 7/50 (14%) and 27/50 (54%), respectively, but unwanted weight loss was seen in three subjects (6%) only. The level of abdominal obesity had the strongest correlation with functional score (r=0.292, P<0.05). Frailty models which included either severe abdominal obesity or diabetes in lieu of unwanted weight loss had good sensitivity rates per each frailty score as compared with the original Fried model.
Conclusion
For detecting and/or screening for the frailty syndrome in obese young elderly, the level of abdominal obesity or diabetes may provide a useful marker.
Introduction
The increase in the elderly population is linked to a rising prevalence of sarcopeniaCitation1 and frailty,Citation2 two of the most common and debilitating health conditions afflicting old age. Presently, both the disorders are also associated with overweight and/or obesity and not only with underweight.Citation1,Citation3–Citation6 The functional profile of the “fat and frail” populationCitation7 is apparently different from that of the better recognized, classical phenotype seen in frail underweight older adults, as they may have higher risk for metabolic impairment (diabetes and metabolic syndrome) and may exhibit a significantly elevated rate of death.Citation5,Citation8
For the detection of frailty, Fried’s criteria presently comprises one of the most widely accepted diagnostic tools.Citation2 This scoring model is based on the identification through direct assessment of the following features: low hand grip strength, low 4 m average walking speed, low caloric expenditure on physical activity, self-reporting of extreme fatigue or low functionality, and a spontaneous reduction of at least 4.5 kg in the past year. A prefrail state entails the fulfillment of at least one criterion, whereas the co-presence of three or more criteria defines frailty.Citation9
However, whether Fried’s criteria are applicable to obese elderly is yet to be validated. Because Fried’s feature of recent weight loss is strongly linked with under/malnutritionCitation10 (the least prevalent feature in elderly subjectsCitation9), some measure of obesity per se or any of its morbid sequels might be more suitable for the detection of frailty in this subpopulation. Also, as unintentional weight loss is a marker for malnutrition or disease (mostly malignancy), it is reasonable to assume that unwanted weight loss may potentially be replaced by measures of adiposity, as they reflect the other side of the nutrition spectrum – overnutrition (especially when no malignancy is prevalent).
To get a better understanding of this issue, we recruited an outpatient clinic-based sample of overweight/obese older (65–75 years) subjects in whom the validity of Fried’s criteria for diagnosing frailty was compared to modified models of functionality, such that non-intentional weight loss would be replaced by some obesity-related variables.Citation11–Citation14 We a priori chose variables that were already shown to be frailty-related: waist circumference (WC),Citation15–Citation17 body mass index (BMI),Citation8,Citation17,Citation18 percent fat (% fat),Citation19–Citation21 and the presence of diabetes.Citation4,Citation22 We included diabetes in our criteria, since 1) the prevalence of diabetes rises with age and obesity;Citation23,Citation24 2) diabetes has been shown to accelerate the loss of muscle mass and function in older adults,Citation25 and increases functional limitations in older adults,Citation26 owing to insulin resistance, inflammation, hyperglycemia, and advanced glycation end products (AGEs).Citation4 We hypothesized that higher degree of abdominal obesity would be the best criterion to replace weight reduction using validity assessment since abdominal obesity was repeatedly shown to be associated with frailty more than other measures of obesity.Citation15–Citation17
Patients and methods
Population and sampling
The study took place at the Institute of Endocrinology, Metabolism, and Hypertension (IEMH), Tel-Aviv Sourasky Medical Center (TASMC). This was a non-probability sample composed of patients aged 65–75 years visiting the various outpatient clinics in the IEMH (eg, endocrinology, osteoporosis, diabetes, and metabolic syndrome clinics) and affiliated community clinics, who were offered by their physician to participate in the study. The study was approved by the institutional review board of TASMC, and signed informed consent was obtained from all the participants. We selected only younger elderly (ie, the age group of 65–75 years) because this age range may present a therapeutic window for the remaining years of life and because older subjects were more likely to have severe comorbidities.
Assessment of eligibility
Inclusion criteria: patients aged 65–75 years, obese (BMI >30 kg/m2 and/or WC ≥102 cm for men and ≥88 cm for women) who were able to walk independently either with or without an assisting device (cane or walker). Exclusion criteria: cognitive impairment as defined by the referring physician; recent use of steroid agents (≤6 months); uncorrected endocrinopathy (eg, primary hypothyroidism); known and active malignancy (past malignancy of >1 year was allowed); diagnosed with liver disease other than hepatosteatosis; renal impairment with eGFR <45 cc/mL; recent (≤6 months) stroke, myocardial infarction or unstable angina; New York Heart Association Class 2 or higher congestive heart failure; and a fall during the past 12 months with an associated fracture. Screening for potential subjects was based on the medical reports generated at and obtained from the IEMH.
Study flow and protocol
Health status and functional abilities were examined using a standardized protocol and questionnaire.Citation27–Citation30 Eligible subjects were asked to provide a recent medical summary from their primary physician (including list of diagnoses) and recent blood test results (<1 year), including CBC, glucose, and HbA1c; lipid renal, electrolyte, and liver function panels, etc. The study began in April 2016, and recruitment was completed by June 2016. Since this is a preliminary study, we a priori decided to recruit 50 male and female subjects.
Data collection and definition – main exposure variables
Frailty assessment and screening
Fried phenotype model as described in detail elsewhereCitation9 is based on low hand grip strength, low 4 m average walking speed, low caloric expenditure on physical activity, self-reporting of extreme fatigue or low functionality, and a spontaneous reduction of at least 4.5 kg in the past year. The five-item FRAIL scaleCitation12 included the following five components: fatigue, resistance, ambulation, comorbidity, and loss of weight. In both the tools, frailty scores ranged from 0 to 5 (ie, 1 point for each component; 0=best score, 5=worst score) and were further categorized into frail (3–5), pre-frail (1–2), and robust (0) (Table S1).
Anthropometric data
All measurements were carried out twice, and the average was then calculated, according to a standardized protocol and included standing height and weight (using an analog scale suitable for weighing up to 130 kg, with accuracy of 0.5 kg), WC (measured around the umbilicus), and % fat/lean mass (obtained by way of electrical impedance body composition analyzer [BF-350; TANITA, Tokyo, Japan]). To increase the accuracy of the body composition measurements, participants were instructed to refrain from heavy exertion and alcoholic beverages intake within the preceding 24 hours and to eat a light meal ~3 hours before their meeting. We reviewed the literature for suggested cutoffs of anthropometric variables for higher risk of mortality and disability (as potential outcomes of frailty). The cutoffs searched for were WC,Citation17,Citation31–Citation33 BMI,Citation17,Citation34,Citation35–Citation37 and % body fat.Citation35,Citation36 Interaction of high BMI and high WC was also examined, since WC is an independent and good predictor of total mortality, particularly among overweight and obese adults, and may have prognostic value with respect to mortality and frailty risk, beyond that of BMI per se.Citation16,Citation17 Eventually, we used the 75th percentile as the cutoff point because of the high obesity-prone selectivity of our population: all participants had high levels of abdominal obesity, particularly females. Following the footsteps of Fried et al,Citation9 which defined the upper quartiles of various frailty criteria as indicative of frailty, we used the upper quartiles of obesity measures to replace the non-intentional weight loss criterion, so as to preserve the overall structure of the original Fried’s model. Finally, because of the novelty of our hypothesis, and since specific obesity cutoffs for the incidence of functional limitations in obese elderly are yet to be determined, we used quartiles (Box 1).
Physical function tests
The subjects were also examined using standardized protocols of the following tests: sit to stand 30 seconds (STS 30),Citation29 2 minutes walk test,Citation28 and leg extensionCitation30 (Supplementary materials).
The presence of comorbidities
This was evaluated by the combination of self-reported standardized questionnaire and information obtained from the medical summaries provided by the subject, as well as the records at the IEMH. Occasionally, not all diagnoses are documented in the medical notes. Comorbidity was defined by the presence of four or more of the following: chronic medical conditions – hypertension, coronary heart disease (eg, history of myocardial infarct), cerebrovascular disease (stroke or transient ischemic attack), chronic kidney disease, diabetes, asthma disease, glaucoma and/or cataract, unbalanced dyslipidemia (observed by blood test results), and osteoporosis.
Data collection: main outcome
Frailty may be considered as a pre-disability state,Citation11,Citation12 and hence, disability may be an outcome of frailty.Citation12,Citation14 Therefore, the presence of disability (as detected in standard questionnaires) is often used for the validation of frailty. We used the Comprehensive Functional Assessment Questionnaire (CFAQ) to assess physical function state by questions on activities of daily living (ADL)Citation27 as recently utilized in several reports.Citation38–Citation40 Each of the nine questions in the questionnaire had an answer score of 0–4. A score of “0” indicates that the activity was not performed unrelated to health problems, whereas the higher the score from 1 to 4, the higher the difficulty associated with the specific activity. Answers in each of the nine questions in the functional questionnaire were summed to a total score ranged from 0 up to 36 (representing the highest functional impairment).
Data analysis – preliminary study
Analysis was performed using the SPSS program (version 24). P-values were compared to the value of ≤0.05. Sample size is determined as 50 subjects for this study and has been chosen with no pre-assumptions because this is a preliminary study. Continuous variables are presented as mean ± SD, as well as by range. The CFAQ scoring was validated using the Timed Up and Go test (in which ≥12 seconds indicated a higher risk of falling).Citation29 The area under the receiver operating characteristic curve (area under the curve [AUC]) was 0.85 (P=0.003). The score generated from the questionnaire with the validity was ≥16 (specificity 83.7%, sensitivity 81.4%; data not shown). Eventually, we defined functional impairment as any score >16, (~16), based on: 1) statistical reasoning (highest quartile of the derived scores); 2) the distribution of the scores recorded in the study’s sample which was clearly clustered in a “tri-modal” fashion such that the achieved scores fell within the following ranges: 9–16 vs 17–20 vs 25–27.
In the direct assessment of frailty, we used a modified Fried model;Citation9 in which the 4 m walk test was dichotomized (ie, >4 seconds considered as frail) according to the widely used five-item FRAIL scale.Citation2 Unwanted weight loss was self-reported, whereas the other components of the Fried model were maintained (Supplementary materials). The presence of these components was summed up to a total frailty score with a maximal value of five (representing the highest frailty state). Since only seven subjects (14%) were defined as frail based on this score, we merged them with the 27 subjects (54%) that were defined as pre-frail and referred to this group as frail-prone (FP) subjects.
Following a normal distribution test, an appropriate univariate analysis was conducted to test the difference between the FP and the non-frailty prone (NFP) groups. Analyses were also stratified by sex. We then introduced several evidence-based variables into the model, each replacing the weight loss criterion, and the analyses were subsequently repeated for each “corrected” model. The variables were: WC, BMI, % body fat (each dichotomized by the highest quartile vs all others), and the presence (vs absence) of diabetes (as detailed in Box 1). To test the relevance of these new criteria against – the traditional – Fried’s criteria and functional status, we used the Spearman correlations with the Likert-based scale of the functional level questions.
Each time, the new adjusted frailty models included one of the proposed variables as a replacement for the original weight-reduction criterion. Using the AUC, we estimated the accuracy of each model. The AUC ranges from 0.5 to 1.0, where 1.0 indicated perfect sensitivity and specificity. An index test AUC of at least 0.8 is considered to indicate good discriminative ability.Citation41 The sensitivity (the probability to correctly classify the FP as positive) and specificity (the probability to correctly classify the NFP as negative) were calculated under different cutoffs. We a priori defined that a fair validity will be considered as ≥75% (sensitivity and specificity) with respect to functional impairment.
Lastly, using multivariate linear regressions, we examined the relation between the frailty and function state, adjusted for several potential confounders (eg, education level, age, and others as detailed in the “Results” section). These confounders were selected based on existing literature as well as their distribution in the stratified exposure variables (FP vs NFP) and the stratified outcome variable (functional impairment vs no impairment).
Results
Subject characteristics
The study included 50 subjects with an average age of 69±3 years and 60% were female. According to the selected criteria (the Fried model with the modification described in the “Methods” section), 34 of the subjects were categorized as FP, of whom seven were frail, whereas 16 were categorized as robust (NFP) (). The classification as FP was clearly dominated by a low activity level (88%). Other components of frailty were low grip strength (32%), slow gait (26%), and self-report of exhaustion (24%).
Table 1 (A) Participants’ health characteristics with stratification to frailty status by Fried phenotype model (exposure) and (B) participants’ frailty and disability characteristics with stratification to frailty status by Fried phenotype model (exposure)
Notably, unwanted weight loss was seen in only three subjects (9% of the FP and 6% of the entire cohort). Interestingly, when the five-item FRAIL screening tool was applied, the rate of FP among women was considerably higher (by 24%, all of whom were classified as pre-frail) ().
Exploring the role of anthropometric and metabolic variables as new candidates to define frailty
Significant spontaneous weight loss is uncommon in obese young elderly, as reflected in its low rate in our study population, seen in only 3/50 subjects (6%). The correlations between the variables introduced as an alternative to unwanted weight loss, and the components of the Fried model, and the functional score are presented in . As shown, among these anthropometric/metabolic variables, WC was most prominently related to frailty and functional state. Still, the correlation of the anthropometric/metabolic variables with the Fried’s components were insufficient to suggest interdependence (r<0.8), such that their introduction as new independent variables appears justified. Among the anthropometric/metabolic variables used, WC was also the only variable that was significantly and positively correlated with the functional score (r=0.296; P<0.05).
Table 2 Spearman correlations coefficients of anthropometric and metabolic variables and functional tests
Testing the new adjusted models for frailty using functional impairment as an outcome
Reclassification of the subjects with the adjusted models (in which the weight loss criterion was replaced) resulted in a sizable increase in the rate of frailty. In the model using high BMI (75th percentile and higher), the proportion of frail subjects increased from 14% to 24% (1.71-fold) (Table S2). In women, the most visible increase in frailty rate by reclassification occurred in the models that included diabetes and high body fat. In males a higher frailty was observed when weight loss was replaced by high WC, high BMI, and high WC and BMI (twofold increase in all alternative models as listed) (Table S2).
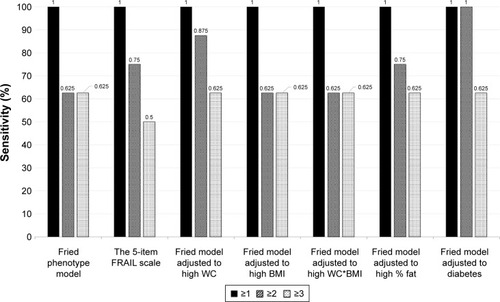
The altered models, in which weight loss was replaced by the anthropometric/metabolic variables, afforded acceptable specificity as they all identified the most normally functioning individuals correctly (defined by the original Fried’s model; using a frailty score cutoff of 3; Table S2). Using the cutoffs to differentiate between FP (pre-frail+frail) and NFP, all the frailty models (Fried’s and the five-item FRAIL scale as well as the new adjusted models) had the same sensitivity (100%; Table S2; ), whereas specificity was highest in the five-item FRAIL scale (76.5%; Table S2). A strict cutoff differentiating the frail (≥3 scores) from the pre-frail and non-frail group, showed the same sensitivity in all models (62.5%); with exception of the five-item FRAIL scale, which resulted in a lower sensitivity (50%; Table S2; ). From a clinical perspective, sensitivity appears more critical than specificity in the detection of frailty and disability. In this regard, a clear advantage was seen when the weight loss criterion was replaced by diabetes or high WC, which for each selected cutoff level showed a higher or at least the same sensitivity as seen with the Fried model vis-à-vis functionality ().
Figure 1 Sensitivity rates (%) of the different models per each cutoff to differentiate the frailty states.
Abbreviations: BMI, body mass index; FRAIL, fatigue, resistance, ambulation, illnesses, and loss of weight; WC, waist circumference.
Exploring the accuracy of the models
Evidence supporting the accuracy of the new models can be seen in Table S3, where correlations of specific components of the functional level assessed in the questionnaire were tested against the frailty scores in each model and its specific components. In Fried’s model, the strongest and most consistent predictor of functional impairment was the 4 m walk test. WC level was the strongest and most consistent anthropometric factor correlated with functional impairment. Moreover, the overall correlations (as well as question-specific correlations) were strongest and most consistent using the modified Fried criteria, in which weight loss was replaced by high WC or diabetes (overall Spearman correlations with total score of functional level: 0.587, 0.49; P<0.01, respectively).
The relation of frailty-models to the functional level
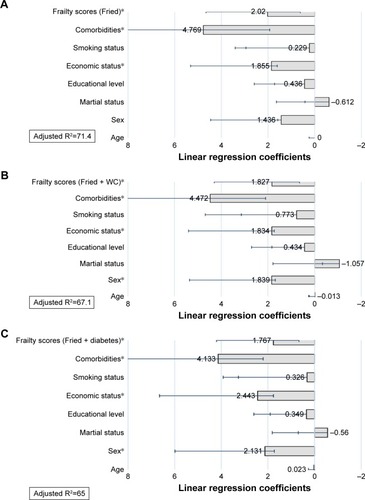
Several explanatory variables differed among outcome groups (). The rate of comorbidity (%) was 3.74 higher in subjects with functional impairment as compared to subjects without functional impairment (P=0.005). All frailty scores and proportions differed between groups (). The frailty scores in each model remained significantly and highly related to the functional scores. However, the number of comorbidities () was the most strongly associated explanatory variable in Fried’s model as well as in the models in which weight loss was replaced by either WC or diabetes (). Female sex explained significantly the functional level only in the modified models, but not in the Fried model ().
Table 3 Participants’ general and frailty characteristics with stratification to functional status by the comprehensive functional assessment questionnaire (outcome)
Figure 2 The adjusted correlation between frailty scores (by the three detective models) to function scores using linear regression.
Abbreviation: WC, waist circumference.
Discussion
This preliminary study has been assessed for the first time the pertinence of accepted and common frailty criteria applied specifically in obese younger elderly subjects. In our survey, characterized by the common presence of obesity and/or diabetes, the Fried criteriaCitation9 as well as the five-item FRAIL scale screening toolCitation2 were able to detect functional impairment, an accepted outcome in this age section of the population. Notably, non-intentional weight loss, one of the Fried criteria, appeared uncommon in our cohort, which agrees with our clinical experience and a recent analysis of the last national representative survey of the Israeli elderly population.Citation42 The relative rarity of unwanted weight loss in the present study (~6%)Citation42 is also in line with its rate in an Israeli general population sample study of community-dwelling elderly with obesity (~5%).Citation43 In fact, weight gain in the latter study was twice as common as the rate of weight loss in subjects free of current or recent malignancy. Because obesity is so common in subjects over the age of 65 years, and in view of the growing evidence that obesity in older subjects is linked to sarcopenia,Citation5 we examined herein the possibility that the degree obesity levels and the presence of diabetes might serve as alternative variables to non-intentional weight loss in this age group.
The most significant and novel contribution of this study is that altering the accepted Fried model in obese younger elderly population by replacing the weight loss criterion with severe abdominal obesity or diabetes presence is both feasible and valid. When all cutoffs for determining FP states were examined, the level of abdominal obesity and/or the presence of diabetes showed the highest sensitivity in detecting functional impairment, compared to the original Fried model as well as to the altered models using other anthropometric/metabolic variables (level of % body fat, level of BMI, and level of high BMI–high WC; ). We have also shown here for the first time, to our knowledge, that in obese younger elderly subjects (aged 65–75 years), the anthropometric/metabolic factor most strongly associated with the common frailty components (in Fried model) and with functional impairment is the level of abdominal obesity ( and S1). Of note is the observation that the frailty-disability link did not change due to this alterations in the Fried model: traditional explanatory variables for functional impairment were kept unchanged when the frailty model was altered by the introduction of high level of WC or diabetes as replacement for weight loss ().
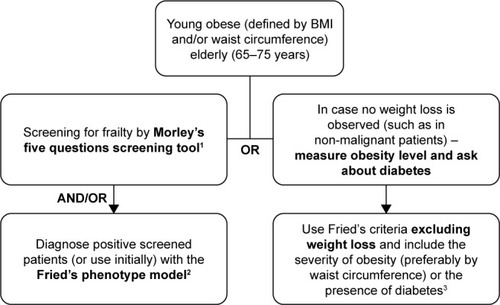
While existing literature has discussed in depth the role of BMI vs WC in the frailty state,Citation15–Citation17 we suggest that in the direct assessment of obese young elderly and severity of abdominal obesity or diabetes may be included in the frailty model itself. A screening flow sheet for the diagnosis of frailty in obese young elderly is presented in . Mechanistically, centralized obesity and diabetes may be more valuable to predict frailty and its outcomes (such as functional impairment) as it may reflect or correlate with multiple potentially disabling processes such as inflammation and insulin resistance.Citation5 Diabetes in particular is of growing interest regarding its relationship with frailty/sarcopenia and functional impairment, for example, through “anabolic-resistance.”Citation44
Figure 3 Optional screening and/or diagnosing flow for obese younger elderly subjects.
Abbreviations: WC, waist circumference; BMI, body mass index.
Although we used a selective sample of apparently homogenous subjects, our findings are concordant with reports that frailty and functional impairment co-segregate with factors such as economic status and comorbidities.Citation9,Citation11,Citation14,Citation45 Female gender was significantly and independently associated with functional impairment only in the adjusted models (coefficients of 1.8–2.5). Caution should be made in interpreting this finding due to the possibility of residual confounding and their higher levels of obesity than males (unlike in the general population), all of which may be due to selection/volunteer bias of females in studies and in our unit in particular.
Interestingly, the 5-item FRAIL scale screening toolCitation2 showed relatively high sensitivity in the total study population and in particular with female subjects (using cut-offs ≥1 scores and >2 scores). This may reflect its subjective nature which is also the case for the functional report. Whereas previous studies have shown that this tool is highly predictive and detective for functional outcomes,Citation46 not focusing on obese older patients. The higher sensitivity in women may be partially explained by their potentially higher self-awareness and higher tendency to report difficulties particularly when obesity is present.Citation47
The observation in the present preliminary study indicating that the weight reduction criterion in the Fried model can be safely replaced by the presence of severe abdominal obesity or diabetes cannot be generalized at the present but might instigate further research in a representative sample. If present, weight loss should be viewed as an important factor, even in the obese as it is clearly associated with increased mortality risk in frail, nursing home residents.Citation48 On the other hand, as obesity becomes a more prevalent phenomenon, obesity-related features should not be overlooked in the context of frailty detection and classification.
An important limitation of this study is that it is a highly selective group with respect to age and source of recruitment. The subjects recruited for the preliminary study tended to present a lower level of function and higher presence of frailty compared to a sample of community-dwelling younger elderly (16% vs 12.6% and 14% vs 8.4%, respectively).Citation49 This may be attributed to the hospital setting of the preliminary study population. A second limitation of our report is that it is a cross-sectional study, such that causality may not be assumed. Finally, the small sample size of our study comprises an additional limitation, as the potential effects of high heterogenicity (eg, BMI ranged from 25 to 51 kg/m2) cannot be adjusted for by stratification.
Conclusion
In the consecutive group of obese younger elderly subjects, the inclusion of severe abdominal obesity (75th percentile by sex) or the presence of diabetes in lieu of the traditional trait of unwanted weight loss allowed detection of functional limitations and yielded a slightly higher sensitivity (per same cutoff) and AUC. Therefore, for the detection of frailty in obese younger elderly in the absence of spontaneous weight reduction, severe abdominal obesity or diabetes may comprise a legitimate criterion. These findings need to be examined in larger scale studies to verify their accuracy and validity.
Clinical implications
In obese young elderly subjects without active cancer, screening for frailty, besides weight-reduction, should include severe abdominal obesity or diabetes.
Suggested criteria for severe abdominal obesity are 120/132 cm (male/female, respectively) for outpatient clinic attendants.
Acknowledgments
This work was performed in partial fulfillment of the requirements for a PhD degree by Assaf Buch at the Sackler Faculty of Medicine, Tel Aviv University, Israel. The authors wish to acknowledge the support of all the physicians in the Institute of Endocrinology, Metabolism, and Hypertension who helped in recruitment of the patients. This work was supported by the Sagol Foundation for the Metabolic Syndrome Research Center.Citation3,Citation4
Disclosure
The authors report no conflicts of interest in this work.
References
- Cruz-JentoftAJBaeyensJPBauerJMSarcopenia: European consensus on definition and diagnosisAge Ageing201039441242320392703
- MorleyJEVellasBvan KanGAFrailty consensus: a call to actionJ Am Med Dir Assoc201314639239723764209
- OsherESternNObesity in Elderly SubjectsDiabetes Care200932Suppl 2S398S40219875588
- MorleyJEMalmstromTKRodriguez-MañasLSinclairAJFrailty, sarcopenia and diabetesJ Am Med Dir Assoc2014151285385925455530
- BuchACarmeliEBokerLKMuscle function and fat content in relation to sarcopenia, obesity and frailty of old age – an overviewExp Gerontol201676253226785313
- WalstonJHadleyECFerrucciLResearch agenda for frailty in older adults: toward a better understanding of physiology and etiology: summary from the American Geriatrics Society/National Institute on Aging Research Conference on Frailty in Older AdultsJ Am Geriatr Soc2006546991100116776798
- Porter StarrKNMcdonaldSRWeidnerJABalesCWChallenges in the management of geriatric obesity in high risk populationsNutrients201685262
- LeeYKimJHanESFrailty and body mass index as predictors of 3-year mortality in older adults living in the communityGerontology201460647548224993678
- FriedLPTangenCMWalstonJFrailty in older adults: evidence for a phenotypeJ Gerontol A Biol Sci Med Sci2001563M146M15711253156
- AlibhaiSMGreenwoodCPayetteHAn approach to the management of unintentional weight loss in elderly peopleCMAJ2005172677378015767612
- MorleyJEPerryHMMillerDKEditorial: Something about frailtyJ Gerontol A Biol Sci Med Sci20025711M698M70412403796
- MorleyJEMalmstromTKMillerDKA simple frailty questionnaire (FRAIL) predicts outcomes in middle aged African AmericansJ Nutr Health Aging201216760160822836700
- Abellan van KanGRollandYMMorleyJEVellasBFrailty: toward a clinical definitionJ Am Med Dir Assoc200892717218261696
- VermeulenJNeyensJCvan RossumESpreeuwenbergMDde WitteLPPredicting ADL disability in community-dwelling elderly people using physical frailty indicators: a systematic reviewBMC Geriatr2011113321722355
- Guallar-CastillónPSagardui-VillamorJBanegasJRWaist circumference as a predictor of disability among older adultsObesity200715123323317228052
- García-EsquinasEJosé García-GarcíaFLeón-MuñozLMObesity, fat distribution, and risk of frailty in two population-based cohorts of older adults in SpainObesity201523484785525683024
- StaianoAEReederBAElliottSBody mass index versus waist circumference as predictors of mortality in Canadian adultsInt J Obes2012361114501454
- HardyRCooperRAihie SayerABody mass index, muscle strength and physical performance in older adults from eight cohort studies: the HALCyon programmePLoS One201382e5648323437142
- WatersDLvan KanGACesariMGender specific associations between frailty and body compositionJ Frailty Aging201211182327092933
- HiraniVNaganathanVBlythFLongitudinal associations between body composition, sarcopenic obesity and outcomes of frailty, disability, institutionalisation and mortality in community-dwelling older men: The Concord Health and Ageing in Men ProjectAge Ageing201746341342027932368
- FalsarellaGRGasparottoLPBarcelosCCBody composition as a frailty marker for the elderly communityClin Interv Aging2015101661166726527868
- García-EsquinasEGracianiAGuallar-CastillónPDiabetes and risk of frailty and its potential mechanisms: a prospective cohort study of older adultsJ Am Med Dir Assoc201516974875425986874
- FordESWilliamsonDFLiuSWeight change and diabetes incidence: findings from a national cohort of US adultsAm J Epidemiol199714632142229247005
- WildSRoglicGGreenASicreeRKingHGlobal prevalence of diabetes: estimates for the year 2000 and projections for 2030Diabetes Care20042751047105315111519
- ParkSWGoodpasterBHLeeJSExcessive loss of skeletal muscle mass in older adults with type 2 diabetesDiabetes Care200932111993199719549734
- LeeRHPieperCFColón-EmericCAssociation between clinical fracture risk and type 2 diabetes mellitus among older women is mediated in part by functional impairmentsJ Am Geriatr Soc20156381546155126201005
- JetteAMClearyPDAssessment disabilityPhys Ther19876712185418593685112
- The NIH Toolbox Motor Battery [Internet]The National Institutes of Health [cited 2015 Oct17]. Available from: http://www.health-measures.net/explore-measurement-systems/nih-toolbox/intro-to-nih-toolbox/motorAccessed January 13, 2017
- STEADI Materials for Health Care Providers [Internet]Centers for Disease Control and Prevention [cited 2015 Oct17]. Available from: https://www.cdc.gov/steadi/materials.html#tabs-1205242-7Accessed January 23, 2017
- AndrewsAWThomasMWBohannonRWNormative values for isometric muscle force measurements obtained with hand-held dynamometersPhys Ther19967632482598602410
- CerhanJRMooreSCJacobsEJA pooled analysis of waist circumference and mortality in 650,000 adultsMayo Clin Proc201489333534524582192
- FlegalKMGraubardBIEstimates of excess deaths associated with body mass index and other anthropometric variablesAm J Clin Nutr20098941213121919190072
- ZaslavskyORillamas-SunELacroixAZAssociation between anthropometric measures and long-term survival in frail older women: observations from the Women’s Health Initiative StudyJ Am Geriatr Soc201664227728426889837
- WinterJEMacinnisRJWattanapenpaiboonNNowsonCABMI and all-cause mortality in older adults: a meta-analysisAm J Clin Nutr201499487589024452240
- PadwalRLeslieWDLixLMMajumdarSRRelationship among body fat percentage, body mass index, and all-cause mortalityAnn Intern Med2016164853226954388
- GrafCEKarsegardVLSpoerriABody composition and all-cause mortality in subjects older than 65 yAm J Clin Nutr2015101476076725833973
- FlegalKMKitBKOrpanaHGraubardBIAssociation of all-cause mortality with overweight and obesity using standard body mass index categoriesJAMA20133091718223280227
- VillarealDTAguirreLGurneyABAerobic or resistance exercise, or both, in dieting obese older adultsN Engl J Med2017376201943195528514618
- NapoliNShahKWatersDLEffect of weight loss, exercise, or both on cognition and quality of life in obese older adultsAm J Clin Nutr2014100118919824787497
- VillarealDTBanksMSienerCSinacoreDRKleinSPhysical frailty and body composition in obese elderly men and womenObes Res200412691392015229329
- MurphyJMBerwickDMWeinsteinMCBorusJFBudmanSHKlermanGLPerformance of screening and diagnostic tests: application of receiver operating characteristic analysisArch Gen Psychiatry19874465505553579501
- BuchACarmeliESheferGCognitive impairment and the association between frailty and functional deficits are linked to abdominal obesity in the elderlyMaturitas2018114465329907246
- National Health and Nutrition Survey Ages 65 and over 2005–2006- part 1 [Internet]The Israeli Ministry of Health Available from: http://www.health.gov.il/PublicationsFiles/Mabat_2005-2006-a.pdfAccessed August 17, 2017
- CleasbyMEJamiesonPMAthertonPJInsulin resistance and sarcopenia: mechanistic links between common co-morbiditiesJ Endocrinol20162292R67R8126931135
- AlvaradoBEZunzuneguiM-VBélandFBamvitaJ-MLife course social and health conditions linked to frailty in Latin American older men and womenJ Gerontol A Biol Sci Med Sci200863121399140619126855
- WooJYuRWongMFrailty screening in the community using the FRAIL scaleJ Am Med Dir Assoc201516541241925732832
- DavisonKKFordESCogswellMEDietzWHPercentage of body fat and body mass index are associated with mobility limitations in people aged 70 and older from NHANES IIIJ Am Geriatr Soc200250111802180912410898
- PizzatoSSergiGBolzettaFEffect of weight loss on mortality in overweight and obese nursing home residents during a 5-year follow-upEur J Clin Nutr201569101113111825758838
- BuchAKeinan-BokerLBernerYCarmeliEGoldsmithRSternNEstimated frailty prevalence among Israeli elderly – results from a cross sectional national surveyIsr J Health Policy Res2018711829642949