
Abstract
Purpose
The co-occurrence of frailty and depression in late life, the possibility for symptom reversal, their reciprocal relationship, and the effects on mortality have rarely been investigated. We aimed to examine the co-occurrence of frailty and depressive symptoms in late life, the possibility for symptom reversal, their reciprocal relationship, and the effects on mortality using all the information from a longitudinal study.
Patients and methods
We used the Taiwan Longitudinal Study of Aging (TLSA) for this study. TLSA was initiated in 1989 and followed periodically. We included participants from 1989 to 2007, who had data on frailty and depressive symptoms. Frailty was assessed by accumulation of functional deficits in 6 dimensions including disease status, sensory dysfunction, balance, functional limitations, health risk behaviors, and life satisfaction. Depressive symptoms were measured with the Center for Epidemiologic Studies Depression Scale (CES-D). A multistate model with interval censoring was used to examine the transition between states of frailty with or without depressive symptoms, and finally to death. A mixed model was used to examine the relationships between frailty and depressive symptoms.
Results
The coexistence of frailty and depressive symptoms was associated with higher mortality. Individuals with depressive symptom had a lower probability of reversal to a better state. Previous depression score predicted current frailty, but the coefficient was smaller than that of previous frailty. Previous frailty predicted current depression score, and the coefficient was stronger than that of previous depression.
Conclusion
Depressive symptoms increased the mortality and decreased the probability of reversal in the frail older adults.
Introduction
According to the World Health Organization, the population of people 60 years and older will reach more than 2 billion worldwide in 2050, double the current number.Citation1 Eventually, physical and mental health affect functioning in old age.Citation2 Therefore, it is important to consider not only specific diseases experienced by older adults but also on how various conditions interact and affect trajectories of functioning.Citation3 Functioning is determined not just physically or mentally but also through interactions with the environment. Many define frailty based on functioning in older adults.
Campbell and Buchner defined frailty as a condition or syndrome that results from a multisystem reduction in storage capacity.Citation4 Frailty can also be defined as a state of increasing vulnerability to adverse outcomes.Citation5 It is a multidimensional concept that includes a complex interplay of physical, psychological, social, and environmental factors.Citation2 The widely used definitions can be summarized within 3 models: (1) cumulative burden model,Citation6,Citation7 based on the sum of diseases and health conditions, including psychiatric conditions, and social conditions; (2) a model based on accumulating deficits in physical (e.g. balance), nutritional (e.g. weight loss), cognitive (e.g. memory impairments), and sensory (e.g. vision loss) measuresCitation;8 and (3) the biological syndrome model,Citation9 based on weight loss, exhaustion, inactivity, slowness, and weakness. All models are linked to falls,Citation10–Citation12 sarcopenia,Citation13 health conditions,Citation14 use of health care,Citation2,Citation14 and mortality.Citation12 Rockwood and colleagues used the accumulation of functional deficits to define frailty.Citation15 Their approach includes characteristics that change with age as well as characteristics that do not depend on age.
Currently, physical frailty serves as a common indicator of health status.Citation9 The criteria include (1) unintentional weight loss (10 lb or 4.5 kg in the past year); (2) self-reported exhaustion; (3) weakness (measured by grip strength); (4) slow walking speed; and (5) low physical activity. An individual showing 3 of the 5 items is considered frail, whereas a person with 1 or 2 items is considered pre-frail. Frailty is a predictor of falls, loss of mobility or development of disability, hospitalization, and death.Citation16,Citation17
Frailty and depression in later life predict the same outcomes, such as cognitive impairment,Citation18 disability,Citation19 and mortality,Citation20,Citation21 and they share similar risk factors. The bidirectional relationship has drawn some attention. Mezuk and colleagues reviewed 16 cross-sectional and 23 cohort studies and found that (1) positive bidirectional associations existed between frailty and depression in cross-sectional studies; (2) as reported in 7 cohort studies, subjects with frailty had an onset or worsening of depressive symptom at follow-up; and (3) a bivariate association permitted using depression to predict frailty. However, the association disappeared after accounting for overall health status.Citation22 Another meta-analysis searched 24 studies and found those with frailty to have higher odds of depression after adjusting for confounders. On the other hand, people with depression also increased the odds of frailty. The existence of reciprocal relationship between depression and frailty in older adults was concluded.Citation23 Few longitudinal studies were included in the analysis, not to mention the short follow-up time. Almost all the studies used baseline values to predict outcome. The changes over time are rarely reported. Little is known about the long-term effects of the co-occurrence of an accumulation of functional deficits and the presence of depression on mortality.
Therefore, the purposes of this study were to examine the co-occurrence of frailty and depression and the synergistic effect on the probability of reversal and on mortality and to investigate the reciprocal relationship between frailty and depression. Using data from the Taiwan Longitudinal Study of Aging (TLSA), we hypothesized that (1) individuals with frailty and depressive symptoms would have higher mortality compared with individuals with the same frailty status but lower depressive symptom score; (2) frailty is reversible, but individuals with a higher depressive symptom score have a lower chance of reversal than those with a lower depressive symptom score; and (3) a bidirectional relationship exists between frailty and high depressive symptom scores.
Materials And Methods
Subjects
Subjects were taken from the TLSA. The TLSA was initiated in 1989. A multistage sampling scheme was used to select a nationally representative sample in Taiwan. The survey was conducted by the Health Promotion Administration, Ministry of Health and Welfare of Taiwan, in 1989.Citation24 Individuals aged 60 years or older were eligible. A proxy was permitted for individuals who (1) were severely ill or too frail to answer; (2) had cognitive problems; (3) had hearing or speech problems; or (4) had dementia. However, the proxy could not respond to items pertaining to perceived conditions, such as mental or cognitive state. The interview was repeated every 3 to 4 years, that is, in 1989, 1993, 1996, 1999, 2003, 2007, and 2011. Details are available on the TLSA website (http://www.hpa.gov.tw/English/ClassShow.aspx?No=200803270009). The initial sample size and attrition in each wave are shown in Supplementary Figure S1. Prior to 2007, people took part in the survey after giving verbal consent only. Starting in 2007, signed consent forms were collected by the Health Promotion Administration, Ministry of Health and Welfare of Taiwan. Only the data for 1989 to 2007 are available to the public, and requests are made to the Department of Statistics, Ministry of Health and Welfare. Death registry data are also available. Currently, researchers can ask the data center to link the death information for the cohort. Death-related information such as date of death and cause of death is available. The application procedure for TLSA and death information are described at the website (http://www.mohw.gov.tw/CHT/DOS/DM1_P.aspx?f_list_no=812&fod_list_no=4780&doc_no=51228). This study was approved by the internal review board of the Academia Sinica.
Frailty
A new model that compounds Markel-Reid and Browne and Rockwood definitions was used to access frailty in this study. Six dimensions were included. The first dimension was disease status, which included the presence of diseases or disorders such as arthritis, cataract, respiratory disorders, hypertension, heart disorders, diabetes, liver or gallbladder disorders, stomach or intestinal ulcer, and kidney disorders. Having one of the diseases or disorders was counted as 1 point. Multiple drug use was also counted as 1 point. The maximum score possible was 10 points. The Cronbach’s αCitation25 was 0.72.
The second dimension pertained to sensory dysfunction, including eyesight, hearing, and chewing ability with dentures. Each was scored as 1, and the total possible score was 3. The Cronbach’s αCitation25 was 0.74.
The third dimension was balance while walking. If a problem in walking was present, 1 point was assigned.
The fourth dimension was functional limitations, which comprised incontinence, instruments of activity daily living (IADLs), mobility tasks, and participation in social activities. IADLs consisted of shopping, managing money, riding a bus or train independently, doing heavy work around the house or yard, doing light housework, and using the telephone. Mobility tasks comprised standing continuously for 15 mins, squatting, lifting arms overhead, holding or grasping with fingers, lifting or carrying 12 kg, running or jogging 20 to 30 m, climbing stairs, and walking 200 to 300 m. Activities of daily living (ADLs) included bathing, dressing, eating, movement in bed/transferring, ambulating indoors, and toilet use. Social participation included watching TV, reading newspapers, playing games or cards, conversing, gardening, or participating in group activities. Respondents were asked about their participation in religious organizations, worker unions, political parties, social services, or other social groups. Any difficulty in conducting the above-mentioned items was counted as 1 point. The maximum total possible was 37 points. The average Cronbach’s αCitation25 was 0.71.
The fifth dimension pertained to health risk behaviors, such as smoking, drinking alcohol, and chewing betelnut. The total score was 3, with a Cronbach’s α of 0.92.
The sixth dimension included self-perceived health, satisfaction with life, and depression. Because depression was a focus of the study, the score was not included in the total deficits. Self-perceived health included 2 questions on current condition and a comparison with the past year. A response of “poor” was counted as 1 point, and the sum was 2 points. The Cronbach’s αCitation25 was 0.58. To assess satisfaction with their life, respondents were asked whether they agreed with the following 10 items: “Is your life smoother than that of others?”, “Are you satisfied with your life?”, “Could your life be better than now?”, “If you could relive your life, would you change it?”, “Are these the best years of your life?”, “Most of your life is boring”, “The things you do are meaningful”, “Do you expect that interesting things will happen in the future?”, “Do you feel tired?”, and “Do you feel your life meets your expectations?” After reversing the positive aspects to negative, the maximum total possible is 10 points. The Cronbach’s αCitation25 was 0.72, and the highest score was 66. The Cronbach’s αCitation25 for the overall score in each wave ranged from 0.68 (1998) to 0.80 (2007). We converted scores to between 0 and 100 for each wave by dividing the measured score by the highest possible score and multiplying the result by 100. The totals were then divided into tertiles. Those within the highest tertile were considered frail, whereas those in the lowest were considered robust. Those in the middle were considered pre-frail.
Depressive Symptoms
Depressive symptoms were measured using a shorter version of the Center for Epidemiologic Studies Depression Scale (CES-D), which has been previously validated.Citation26 CES-D contains 10 items. Each item was answered on a scale of 0 (rarely or none of the time) to 3 (most or almost all the time). We recoded the scores as 0 (rarely or none of the time) and 1 (any). The total score is 10. The Cronbach’s α was 0.74. We used the quartile of baseline 1989 distribution to determine high depressive symptoms; in other words, people with scores above the 75th percentile (3 points) were considered as having high depressive symptoms.
Statistical Analysis
Descriptive statistics are expressed as means and standard deviations for continuous variables and numbers and percentages for discrete variables. SAS version 9.2 (SAS Institute, Inc., Cary, NC) was used for calculating descriptive statistics. A multistate model with interval censoring was used to model the transition from robust to pre-frail, frail, or death.Citation27 Seven states were defined: robust with or without depressive symptoms, pre-frail with or without depressive symptoms, frail with or without depressive symptoms, and death. Death is the absorbing state, from which no one moves out. Reversal was allowed for all states, except death (Supplementary Figure S2). Multistate models are governed by transition intensity function. The transition intensity function represents the instantaneous incidence rate of moving from state j to state k at time , where Y(t) is the state occupied at time t. The transition intensities can be used to compute the transition probabilities, that is, the probability of being in state j at time s and moving to state k at time t:
In this study, the exact transition times are interval censored.Citation27 The MSM macro in R package was used for the multistate model. In addition to modeling the transition between states, we also examined the bidirectional relationships longitudinally between accumulation of deficits and depressive symptoms. This examination was accomplished by using the general linear model accounting for repeated measures in SAS version 9.2 (SAS Institute, Inc., Cary, NC).
Results
There were 4049 individuals interviewed in 1989 (Supplementary Figure S1). However, the multistate model required complete information related to each state for the analysis. Thus, we analyzed 3352 individuals (1916 men and 1436 women) with complete information for all the states. The average age, proportion having any form of education, and original and standardized scores of total and each dimension of accumulation of deficits at baseline are listed in . Women were older, fewer of them were educated, and they had a higher number of deficits than men. Health risk behaviors were less prevalent among women than among men. presents the average age, proportion having any form of education, and original and standardized scores of total and each dimension of accumulation of deficits at baseline of the survivors and the dead. Those who died during the study period were older than their counterparts (70.23 ± 6.83 vs 65.38 ± 4.01 years). The frailty score (21.2 ± 7.16) and the depression score (2.27 ± 2.13) were significantly higher in those who died than in the survivors.
Table 1 The Mean And Standard Deviation Of Each Dimension Of Accumulation Deficits At Baseline By Sex (Number In Parentheses Is The Highest Score)
Table 2 The Mean And Standard Deviation Of Each Dimension Of Accumulation Deficits At Baseline By Survivorship At The End Of The Study (Number In Parentheses Is The Highest Score)
Time trends for the standardized frailty score, depression score, and adjusted score for each dimension are depicted in Supplementary Figure S3. Women had higher scores over time, except for health risk behaviors. Most of the scores increased over time, except for health and life dissatisfaction. Supplementary Table S1 lists the number of people moving between each frailty state during the study period. The 5-year transition probabilities between states are listed in and the 20-year transition probabilities in . The probability for each state moving to death in 5 years can be found in the last column (e.g. probability from state 1 [robust] to state 7 [death] is 0.086, whereas probability of the frail with depressive symptoms [state 6] to state 7 is 0.365). The 20-year survival probabilities for the 7 states are plotted in . Individuals with higher depressive symptom scores (dash lines) clearly had worse survival probabilities than those with lower depressive symptom scores (solid lines). People with higher depressive symptom scores were less likely to move to better states than those with lower depressive symptom scores. For example, column 1 in indicates that the robust (state 1) have a probability of 0.391 staying in robust, but robust with depressive symptoms (state 2) have a probability of 0.226 moving back to robust only and 0.119 chance of staying in robust with depressive symptoms in 5 years for all subjects. When comparing pre-frail only (state 3) to pre-frail with depressive symptoms (state 4), the chance of moving to robust only (state 1) is 0.195, whereas the chance of state 4 moving to robust only (state 1) is 0.136 in 5 years. Similar patterns can be found for males and females separately and in 20 years ().
Table 3 The 5-Year Transition Probability Between States Of Frailty With Or Without Depressive Symptoms For All Individuals And By Sex
Table 4 The 20-Year Transition Probability Between States Of Frailty With Or Without Depressive Symptoms For All Individuals And By Sex
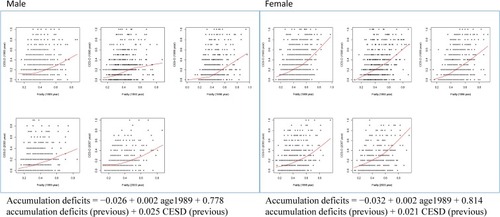
The previous frailty score significantly predicted the current frailty score after controlling for baseline age and previous scores of depression for both males and females (). Similarly, the previous frailty score also significantly predicted the current depression scores (). The majority of the coefficients reached statistical significance, except for the intercept and age for men both in predicting depressive score (CES-D) and frailty score.
Discussion
This study examined the effect of the co-occurrence of frailty and high depressive symptom scores on mortality in the elderly. The results confirmed our 3 hypotheses: (1) the co-occurrence of frailty and depression resulted in higher mortality compared with frailty only; (2) individuals with higher depressive symptom scores have a lower probability of reversal than those with lower depressive symptom scores; and (3) a reciprocal relationship exists between depressive symptoms and accumulation of deficits. To our knowledge, this study is the first to examine these 3 hypotheses using a cohort study. Our contributions include constructing a new frailty model and application of multistate models to investigate the long-term change.
We used a new model to assess frailty using accumulation of deficits. The construction of models to assess the accumulation of deficits varies across studies.Citation2,Citation5 Markle-Reid and Browne summarized the conceptual models into physiological dimension, functional capacity, and social construction.Citation2 We, in turn, constructed a frailty score based on the concepts of Markel-Reid and BrowneCitation2 and Rockwood et alCitation28 and the availability of the data. The Cronbach’s α was calculated for each dimension. The Cronbach’s α in each dimension was reasonable, as was the Cronbach’s α for each wave. This implied that frailty was the obvious sign of the much larger problem of poor health in old age. After stratifying the score into 3 frailty states, the difference in survival probabilities (Supplementary Figure S4) also confirmed that the frailty score was capable of distinguishing the health status of the elderly in Taiwan. We believe our frailty score is a good tool for evaluating the frailty of the elderly in Taiwan, and it could be used to help determine the risks of mortality within this population.
We showed that the probability of moving from even-numbered states to worse states (with a higher number) was higher than that of moving from odd-numbered states (e.g. 2 to 3 [0.096] vs 1 to 3 [0.075]). The intensity was higher in women than in men. The results of the mixed model also showed that a higher depression score previously was significantly associated with a higher current frailty score. Elderly individuals with depressive symptoms might have low motivation to carry out tasks, including health promotion behaviors. People with higher depressive symptom scores have higher chances of feeling sad, despairing, discouraged, and incapable of coping with situations that arise in daily life. Previous study has shown that depression is negatively associated with functional recovery after hip fracture in the elderly, possibly because of reluctance to engage in physical therapy, negative cognition, and symptoms similar to psychomotor retardation.Citation29 Another study showed that depression may impair the immune system and increase the predisposition to infections.Citation30 A cross-sectional study observed that minor depression is associated with overall health in the elderly but not with specific diseases.Citation31 In addition, depression might deter functional recovery in the elderly.Citation32 These results were in line with our study.
Loss in serotonin-producing neurons and the neurotransmitter are common in normal aging.Citation33 It has been suggested that the age-related changes in serotonin-producing neurons may predispose the elderly to develop depression.Citation33 Dysfunction in both frontal and subcortical regions has been observed to be related to aging.Citation34 Both white matter changes and silent lacunar infarctions are associated with the common functional problems that characterize the phenotype of aging, including cognitive impairment, problems in mobility and balance, urinary incontinence, and mood disorders.Citation34 One feature of mood disorders is depression, which was studied separately in our study. All these features of aging were included in our frailty score, except mood disorders. Depression was associated with all those functional deficits.
Many studies have observed the co-occurrence of frailty and depression in later life. In a systematic review, Mezuk and colleagues retrieved 16 cross-sectional and 23 cohort studies on the relationships between frailty and depression.Citation22 They found frailty, its components, and functional impairments predicted depression. The association between depression and frailty was apparent in cross-sectional studies, but the relationship was not consistent in cohort studies.Citation22 Another review looked at the co-occurrence of depressive symptom and frailty in 14 studies published between 2010 and 2015 and found some studies reported depression in up to 69% of the individuals with frailty,Citation35 but the variation was large. That study’s conclusions were opposite those of Mezuk et al, who suggested that depressive symptoms increased the risk and incidence of frailty, but frailty did not increase depressive symptoms.Citation35 In our study, 806 (20.7%) people were frail and had a higher depressive symptom score (CES-D ≥3) at baseline. The co-occurrence was in the range of the study by Vaughan and colleagues.Citation4Citation3 They chose to use only the definition of Fried et alCitation9 for frailty, but with various measures of depressive symptoms (ie, CES-D or the Geriatric Depression Scale). We obtained consistent findings regarding the predictability of depression based on frailty. Our results showed a larger β for the accumulation of deficits predicting the depression score (β = 0.478, SE = 0.034 for men, β = 0.473, SE = 0.037 for women) than depression scores predicting accumulation deficits (β = 0.025, SE = 0.011 for men, β = 0.021, SE = 0.011 for women) given baseline age and previous scores.
In a study to delineate the relationship between depression, frailty, and mortality,Citation36 2565 men aged 75 years or older living in Perth, Australia, were followed for about 5 years. After adjusted for frailty, the authors found that all-cause mortality was higher in men with depression at baseline than in those without a history of depression. Therefore, they suggested treatment of the elderly with depression should also consider individuals’ frailty status.Citation36 We expand on these findings by considering depressive symptoms alongside frailty and finding higher mortality among elderly individuals with frailty and depression than those with frailty alone.
Most studies compared baseline values and outcomes at the end of study and then analyzed the risk of particular factors. We used information collected in each wave and examined the change of status between waves, which allowed determining whether individuals experienced recovery, a worsening of their condition, or death. The information on the chance of recovery is encouraging because it means that aging is not necessarily an untreatable decline in condition. Treating elderly individuals who have depressive symptoms is important because their chances of recovery from frailty are better if they do not have depressive symptoms.
This study had several limitations. The multistate model requires full information on individuals for each state. Incomplete data meant that part of the study population had to be excluded. The majority of nonrespondents likely became ill or were institutionalized during follow-up, but they were still living given that their data were absent from the death registry. Nevertheless, we had information on more than 3000 individuals throughout an 18-year period (1989 to 2007). Another limitation was that no biomarkers were included in this study. In 2006, approximately 1000 individuals were randomly selected for collection of biomarkers.Citation24 The biological data are available at http://www.icpsr.umich.edu/icpsrweb/NACDA/studies/3792/version/5. Adding biological markers allows researchers to examine the interaction between social and biological factors in aging. TLSA has already presented abundant information on the role of socioeconomic status, social participation, and religious involvement in healthy aging,Citation24 and we believe that the dataset was suitable for our study.
Conclusion
This study utilized a longitudinal study of aging in Taiwan (TLSA) with follow-up for 18 years to examine how the co-occurrence of accumulation functional deficits and depressive symptoms affected overall mortality and the chance for reversal. People with worse accumulation functional deficits and depressive symptoms had a lower chance of recovery and a higher chance of dying than individuals with frailty who did not have depressive symptoms. A reciprocal relationship existed between the accumulation of functional deficits and the depressive score. The coefficient was stronger for the accumulation of deficits predicting depressive symptoms rather than the other way around. Depressive symptoms in the elderly cannot be neglected.
Figure 1 Twenty-year survival probability of 3 frailty states (defined by accumulation deficits) with (dashed line) or without depressive symptoms (solid line) for males and females.
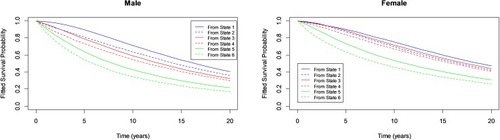
Figure 2 Relationship between baseline age, previous accumulation deficits, depressive scores, and current depressive score by males and females.
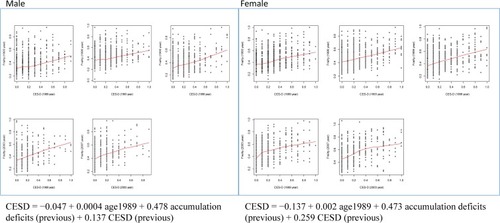
Figure 3 Relationship between baseline age, previous accumulation deficits, depressive scores, and current accumulation deficits by males and females.
Acknowledgments
Authors would like to express their appreciation to Dr. Ching-Yu Chen who helped us construct the accumulation of functional deficits using data from TLSA. Part of this research is funded by Academia Sinica (AS-103-SS-A04).
Disclosure
The authors report no conflicts of interest in this work.
References
- Organization WH. Facts about ageing. 2014 Available from: http://www.who.int/ageing/about/facts/en/. Accessed 710, 2016.
- Markle-Reid M, Browne G. Conceptualizations of frailty in relation to older adults. J Adv Nurs. 2003;44(1):58–68. doi:10.1046/j.1365-2648.2003.02767.x12956670
- Beard JR, Officer AM, Cassels AK. The world report on ageing and health. Gerontologist. 2016;56 Suppl 2:S163–S166. doi:10.1093/geront/gnw03726994257
- Campbell AJ, Buchner DM. Unstable disability and the fluctuations of frailty. Age Ageing. 1997;26(4):315–318. doi:10.1093/ageing/26.4.3159271296
- De Lepeleire J, Iliffe S, Mann E, Degryse JM. Frailty: an emerging concept for general practice. Br J Gen Pract. 2009;59(562):e177–e182. doi:10.3399/bjgp09X42065319401013
- Rockwood K, Mitnitski A. How might deficit accumulation give rise to frailty? J Frailty Aging. 2012;1(1):8–12. doi:10.14283/jfa.2012.227092931
- Rockwood K, Mitnitski A. Frailty in relation to the accumulation of deficits. J Gerontol A Biol Sci Med Sci. 2007;62(7):722–727. doi:10.1093/gerona/62.7.72217634318
- Strawbridge WJ, Shema SJ, Balfour JL, Higby HR, Kaplan GA. Antecedents of frailty over three decades in an older cohort. J Gerontol B Psychol Sci Soc Sci. 1998;53(1):S9–S16. doi:10.1093/geronb/53B.1.S99469175
- Fried LP, Tangen CM, Walston J, et al. Frailty in older adults: evidence for a phenotype. J Gerontol A Biol Sci Med Sci. 2001;56(3):M146–M156. doi:10.1093/gerona/56.3.M14611253156
- Markle-Reid M, Browne G, Gafni A, et al. The effects and costs of a multifactorial and interdisciplinary team approach to falls prevention for older home care clients ‘at risk’ for falling: a randomized controlled trial. Can J Aging. 2010;29(1):139–161. doi:10.1017/S071498080999037720202271
- Li G, Ioannidis G, Pickard L, et al. Frailty index of deficit accumulation and falls: data from the Global Longitudinal Study of Osteoporosis in Women (GLOW) Hamilton cohort. BMC Musculoskelet Disord. 2014;15:185. doi:10.1186/1471-2474-15-18524885323
- Ensrud KE, Ewing SK, Cawthon PM, et al. A comparison of frailty indexes for the prediction of falls, disability, fractures, and mortality in older men. J Am Geriatr Soc. 2009;57(3):492–498. doi:10.1111/j.1532-5415.2009.02137.x19245414
- Briggs AM, Cross MJ, Hoy DG, et al. Musculoskeletal health conditions represent a global threat to healthy aging: a report for the 2015 World Health Organization World Report on Ageing and Health. Gerontologist. 2016;56 Suppl 2:S243–S255. doi:10.1093/geront/gnw00226994264
- Dapp U, Minder CE, Anders J, Golgert S, von Renteln-Kruse W. Long-term prediction of changes in health status, frailty, nursing care and mortality in community-dwelling senior citizens-results from the Longitudinal Urban Cohort Ageing Study (LUCAS). BMC Geriatr. 2014;14:141. doi:10.1186/1471-2318-14-14125522653
- Rockwood K, Andrew M, Mitnitski A. A comparison of two approaches to measuring frailty in elderly people. J Gerontol A Biol Sci Med Sci. 2007;62(7):738–743. doi:10.1093/gerona/62.7.73817634321
- Gary R. Evaluation of frailty in older adults with cardiovascular disease: incorporating physical performance measures. J Cardiovasc Nurs. 2012;27(2):120–131. doi:10.1097/JCN.0b013e318239f4a422334147
- Heuberger RA. The frailty syndrome: a comprehensive review. J Nutr Gerontol Geriatr. 2011;30(4):315–368. doi:10.1080/21551197.2011.62393122098178
- Villarreal AE, Grajales S, Lopez L, Britton GB; Panama Aging Research I. Cognitive impairment, depression, and cooccurrence of both among the elderly in Panama: differential associations with multimorbidity and functional limitations. Biomed Res Int. 2015;2015:718701. doi:10.1155/2015/71870126798641
- Da Silva SA, Scazufca M, Menezes PR. Population impact of depression on functional disability in elderly: results from “Sao Paulo Ageing & Health Study” (SPAH). Eur Arch Psychiatry Clin Neurosci. 2013;263(2):153–158. doi:10.1007/s00406-012-0345-422872105
- Schoevers RA, Geerlings MI, Deeg DJ, Holwerda TJ, Jonker C, Beekman AT. Depression and excess mortality: evidence for a dose response relation in community living elderly. Int J Geriatr Psychiatry. 2009;24(2):169–176. doi:10.1002/gps.208818642389
- Rozzini R, Trabucchi M. Geriatric Depression Scale items and mortality in Italian elderly persons living at home. J Am Geriatr Soc. 2012;60(5):990–991. doi:10.1111/j.1532-5415.2012.03945.x22587865
- Mezuk B, Edwards L, Lohman M, Choi M, Lapane K. Depression and frailty in later life: a synthetic review. Int J Geriatr Psychiatry. 2012;27(9):879–892. doi:10.1002/gps.280721984056
- Soysal P, Veronese N, Thompson T, et al. Relationship between depression and frailty in older adults: a systematic review and meta-analysis. Ageing Res Rev. 2017;36:78–87. doi:10.1016/j.arr.2017.03.00528366616
- Cornman JC, Glei DA, Goldman N, et al. Cohort profile: the Social Environment and Biomarkers of Aging Study (SEBAS) in Taiwan. Int J Epidemiol. 2016;45(1):54–63. doi:10.1093/ije/dyu17925205853
- Tavakol M, Dennick R. Making sense of Cronbach’s alpha. Int J Med Educ. 2011;2:53–55. doi:10.5116/ijme.4dfb.8dfd28029643
- Roberts RE. Reliability of the CES-D Scale in different ethnic contexts. Psychiatry Res. 1980;2(2):125–134. doi:10.1016/0165-1781(80)90069-46932058
- Sutradhar R, Barbera L, Seow H, Howell D, Husain A, Dudgeon D. Multistate analysis of interval-censored longitudinal data: application to a cohort study on performance status among patients diagnosed with cancer. Am J Epidemiol. 2011;173(4):468–475. doi:10.1093/aje/kwq38421193535
- Rockwood K. Frailty and its definition: a worthy challenge. J Am Geriatr Soc. 2005;53(6):1069–1070. doi:10.1111/j.1532-5415.2005.53312.x15935037
- Atay IM, Aslan A, Burc H, Demirci D, Atay T. Is depression associated with functional recovery after hip fracture in the elderly? J Orthop. 2016;13(2):115–118. doi:10.1016/j.jor.2015.02.00127053834
- Phillips AC, Upton J, Duggal NA, Carroll D, Lord JM. Depression following hip fracture is associated with increased physical frailty in older adults: the role of the cortisol: dehydroepiandrosterone sulphate ratio. BMC Geriatr. 2013;13:60. doi:10.1186/1471-2318-13-6023773910
- Beekman AT, Penninx BW, Deeg DJ, Ormel J, Braam AW, van Tilburg W. Depression and physical health in later life: results from the Longitudinal Aging Study Amsterdam (LASA). J Affect Disord. 1997;46(3):219–231. doi:10.1016/s0165-0327(97)00145-69547118
- Shahab S, Nicolici DF, Tang A, Katz P, Mah L. Depression predicts functional outcome in geriatric inpatient rehabilitation. Arch Phys Med Rehabil. 2016.
- Meltzer CC, Smith G, DeKosky ST, et al. Serotonin in aging, late-life depression, and Alzheimer’s disease: the emerging role of functional imaging. Neuropsychopharmacology. 1998;18(6):407–430. doi:10.1016/S0893-133X(97)00194-29571651
- Pugh KG, Lipsitz LA. The microvascular frontal-subcortical syndrome of aging. Neurobiol Aging. 2002;23(3):421–431.11959405
- Vaughan L, Corbin AL, Goveas JS. Depression and frailty in later life: a systematic review. Clin Interv Aging. 2015;10:1947–1958. doi:10.2147/CIA.S6963226719681
- Almeida OP, Hankey GJ, Yeap BB, Golledge J, Norman PE, Flicker L. Depression, frailty, and all-cause mortality: a cohort study of men older than 75 years. J Am Med Dir Assoc. 2015;16(4):296–300. doi:10.1016/j.jamda.2014.10.02325499429