Abstract
Background
The measurements of body mass index (BMI) and percentage of body fat are used in many clinical situations. However, special tools are required to measure body fat. Many formulas are proposed for estimation but these use constant coefficients of age. Age spectrum might affect the predicted value of the body composition due to body component alterations, and the coefficient of age for body fat prediction might produce inconsistent results. The objective of this study was to identify variations of BMI and body fat across the age spectrum as well as compare results between BMI predicted body fat and bioelectrical impedance results on age.
Methods
Healthy volunteers were recruited for this study. Body fat was measured by bioelectrical impedance. The age spectrum was divided into three groups (younger: 18–39.9; middle: 40–59.9; and older: ≥60 years). Comparison of body composition covariates including fat mass (FM), fat free mass (FFM), percentage FM (PFM), percentage FFM (PFFM), FM index (FMI) and FFM index (FFMI) in each weight status and age spectrum were analyzed. Multivariable linear regression coefficients were calculated. Coefficient alterations among age groups were tested to confirm the effect of the age spectrum on body composition covariates. Measured PFM and calculated PFM from previous formulas were compared in each quarter of the age spectrum.
Results
A total of 2324 volunteers were included in this study. The overall body composition and weight status, average body weight, height, BMI, FM, FFM, and its derivatives were significantly different among age groups. The coefficient of age altered the PFM differently between younger, middle, and older groups (0.07; P = 0.02 vs 0.13; P < 0.01 vs 0.26; P < 0.01; respectively). All coefficients of age alterations in all FM- and FFM-derived variables between each age spectrum were tested, demonstrating a significant difference between the younger (<60 years) and older (≥60 years) age groups, except the PFFM to BMI ratio (difference of PFM and FMI [95% confidence interval]: 17.8 [12.8–22.8], P < 0.01; and 4.58 [3.4–5.8], P < 0.01; respectively). The comparison between measured PFM and calculated PFM demonstrated a significant difference with increments of age.
Conclusion
The relationship between body FM and BMI varies on the age spectrum. A calculated formula in older people might be distorted with the utilization of constant coefficients.
Video abstract
Point your SmartPhone at the code above. If you have a QR code reader the video abstract will appear. Or use:
Introduction
Body mass index (BMI) is widely used for nutritional assessment, obesity classification, and as a prognostic variable for mortality.Citation1 However, there are many limitations. First, the BMI could potentially produce an inaccurate diagnosis of “overweight” and “obese” in some special populations such as athletes, body builders, and elderly patients.Citation2–Citation4 Second, BMI-associated mortality in specific situations is controversial.Citation1,Citation5,Citation6 A large retrospective study in critically ill patients demonstrated that only underweight was associated with poor outcomes in contrast with overweight and obesity.Citation7 These results are similar to a large prospective study of nonbariatric surgical patients.Citation8 This difference might be explained by the fat mass (FM) and fat free mass (FFM) proportions in the patients. The decrease of FFM and increase of FM had a negative impact on the overall mortality in an epidemiologic study, especially in males.Citation5,Citation6 Therefore, the combination of BMI and FM might be useful as a clinical prognostic indicator as well as diagnostic criterion for obesity. However, the percentage of FM (PFM) could be predicted with a variety of formulas using BMI, gender, ethnic differences, and age. All of these generate a model based on linear assumption with constant individual variable coefficients.Citation9,Citation10 Although ethnic and gender differences have a proven effect on the relationship between FM and BMI, these have not been analyzed in relation to the age spectrum.Citation4,Citation11,Citation12 The authors, however, suspected that age spectrum might distort this relationship and the coefficient of age might be inconsistent throughout the life span as opposed to gender and race. Therefore, the objectives of this study were to demonstrate the alteration and variation of the relationship between FM and its derivatives and BMI over each age group in the same ethnicity, and to compare this study’s measured FM with previously estimated formulas.
Materials and methods
The authors enrolled healthy Thai volunteers by way of invitation at the Faculty of Medicine, Chiang Mai University, between May 2010 and May 2011. Volunteers were people from the general community. Four research assistants were trained in the measurement of bioelectrical impedance analysis (BIA). Body weight was measured using the same digital weighing apparatus each time (TCA-200 A-RT; Zepper, Bangkok, Thailand) and recorded in kilograms to one decimal point. Height was measured using a standard measuring board; the subjects’ body positions ensured their head, shoulder blades, buttocks, and heels were touching the board during measurement. Height was recorded in centimeters. BMI was calculated by dividing the body weight in kilograms by square height in meters (BMI = body weight [kg]/height [m2]). Volunteers who exhibited any characteristics that might interfere with measured parameters were excluded. These included: subjects <18 years old; pregnant women; persons with any implanted electronic device; those exhibiting signs of chronic steroid use; persons with amputated limb(s), or limited ambulation, inability to lie down, or edematous limb(s); and those with chronic diseases such as liver cirrhosis, renal failure, and heart failure. This study was approved by the Faculty of Medicine, Chiang Mai University Ethics Committee. All volunteers gave informed consent before their enrollment into the study.
A bioelectrical impedance analyzer (Biodynamics BIA 310eTM; Biodynamics Corporation, Seattle, WA) was used to analyze body composition. This machine is a single frequency BIA (SF-BIA) that generates a 50 kHz current, which passes between surface electrodes placed on the hand and foot.Citation13 The machine’s sensor measures the reactance and resistance range up to 300 and 1500 Ohms, respectively. Input data were calculated using the machine’s software and output was reported as PFM, percentage of FFM (PFFM), FM, FFM, and total body water. The machine was always tested by two research assistants to verify accuracy before use. One assistant tested the machine by measuring the BIA results of the other assistant at least twice. The result was considered valid if it did not have an error >5%. Fat mass index (FMI) and fat free mass index (FFMI) were calculated by dividing the fat mass and fat free mass by square height in meters (ie, FMI = FM/height2 [m2]; FFMI = FFM/height2 [m2]).
Because single frequency bioelectrical impedance analysis is not valid under conditions of significantly altered hydration,Citation14 before analysis all volunteers were asked to observe the following pretest guidelines: (1) no alcohol consumption within 24 hours; (2) no exercise, caffeine, or food within 4 hours prior to taking the test, (3) drink two to four glasses of water 2 hours before examination. During the examination, two pairs of sensor electrocardiograph pads were placed on the patient, one on the right wrist and hand and the other on the right foot and ankle. At least 75% of the electrode was required to be in contact with the patient’s skin. Patient data, including gender, age, height, and weight, were entered into the machine’s software before each test. Results of the measurements were recorded and printed.
Comparison of percentage body fat with other fat prediction formulas
The predicted percentage of fat by sex, BMI, and age was calculated using the formulas proposed by Gallagher et al.Citation9 These formulas were selected for three reasons. First, the formulas were generated based on two standard measurements: dual energy X-ray absorptiometry (DXA) and the four compartment model (4C). Second, the formulas considered ethnic differences and integrated ethnic parameters. Finally, the formulas considered the interaction among the parameters involved. The equations were demonstrated as follows:Citation9
DXA model: PFM = 76.0 – 1097.8 (BMI−1) – 20.6 (Sex) + 0.053 (Age) + 95.0 (Asian) (BMI−1) – 0.044 (Asian)(Age) + 154 (Sex) (BMI−1) + 0.034 (Sex) (Age)
4C model: PFM = 63.7 – 864 (BMI−1) – 12.1 (Sex) + 0.12 (Age) + 129 (Asian) (BMI−1) – 0.091 (Asian) (Age) + 0.03 (African American) (Age)
These formulas reported a correlation coefficient of about 0.90 and standard error of estimation of about 4%. Variables were defined as sex = 1 for male and 0 for female; Asian = 1 for Asian and 0 for other races.Citation9
Statistical analysis
Volunteers were categorized according to age into three groups: younger (18–39 years), middle (40–59 years), and older (≥60 years). Each group was further divided into four, using 5-year intervals – except in the first group, which ranged from 18 to 24 years, and the last group, which began at ≥75 years. Weight status was based on BMI using the World Health Organization diagnostic criteria and categorized into four groups: underweight (<18.5 kg/m2), normal (18.5–24.9 kg/m2), overweight (25–29.5 kg/m2), and obese (≥30 kg/m2).Citation15
Differences among the groups were tested depending on data types. Categorized data were tested by chi square. All of the continuous variable data were reported as mean ± standard deviation. The difference among age groups was tested for equal variances using Bartlett’s test and Bonferroni comparison. Group differences were calculated using one-way analysis of variance test for equal variance and the Kruskal–Wallis test for unequal variance. A comparison was made between PFMs to verify the previously used Gallagher et al formulas,Citation9 and paired Student’s t-test was calculated to demonstrate differences in each quartile of each age group. A Bland–Altman plot was performed to demonstrate the error between the predicted PFM formula and the measured PFM for age.
A multivariate regression model was used to test the association between the PFM and independent variables (age, gender, BMI, and status). Weight status was categorized by BMI criteria as previous mentioned and was adjusted for gender and age. The coefficient of age spectrum in older volunteers (≥60 years) was compared with younger (<60 years) by multivariate linear regression, and the interaction between age and age spectrum was tested. Data were analyzed by STATA (v 11.0; STATA Inc, College Station, TX) software. A statistically significant difference was defined as a P value of <0.05.
Results
During this 13-month study, 2324 volunteers (1324 females and 1000 males) were included. The number of females was slightly higher in this study (female 57%; male 43%). The most common three occupations were worker, farmer, and officer, with different proportions in each age group. Ninety-six percent of the study population resides in the northern region of Thailand (). Body weight, height, and BMI were significantly different between age groups and gender. Nearly 60% of the population had a normal weight status. Approximately one quarter of the study population was overweight (24% of females and 26.8% of males) and <10% were underweight or obese (). Although the overall proportion of weight status between genders was comparable, there was a higher percentage of obesity in females in the older age group ().
Table 1 Demographic data of volunteers in each age group
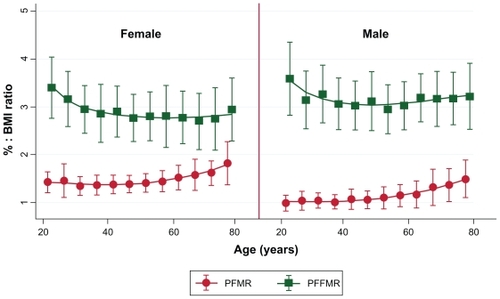
Using a BIA to analyze body fat and FFM as shown in , the volunteers of both genders had significant differences (P < 0.05) between younger, middle, and older age groups of FM, FFM, PFM, PFFM, FMI, FFMI, PFMR (percentage fat mass ratio = PFM:BMI), and PFFMR (percentage fat free mass ratio = PFFM:BMI). However, after subgroup analysis by weight status and gender, differences could be observed in two groups. First, in the under, normal, and overweight status groups there were significant differences between age groups of both genders for all previous parameters mentioned except FM. In the overweight group a significant difference in FM and PFFMR was found only among females in the underweight volunteers. Second, in the obese group, no parameter had significant differences for either gender, but all parameters except for FM and PFFMR were statistically different among the females. The relationships between the PFM, PFFM, BMI PFMR, and PFFMR over the age spectrum in each gender are shown in and . These figures show that PFM and BMI initially increased in parallel with age, diverged at middle age, and separated significantly for those aged >60 years, while the percentage of FFM decreased (). These findings corresponded that the PFMR remained steady over time until 50 years of age when it increased in both genders, while the PFFMR was rather stable into older ages ().
Table 2 Mean and standard deviation of weight, percentage, and ratio to BMI of fat mass and lean body mass in each age group and status
Figure 1 Relationship of BMI, percentage body fat, and percentage lean body mass demonstrated by mean ± standard deviation over age in each gender.
Abbreviations: BMI, body mass index; PFM, percentage of fat mass; PFFM, percentage of fat free mass.
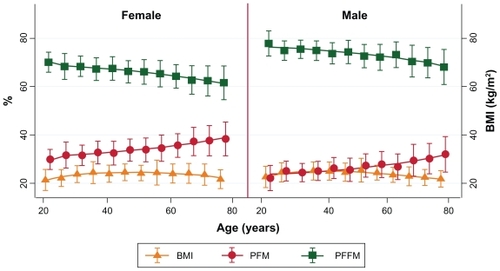
Figure 2 Relationship of PFMR with PFFMR demonstrated by mean ± standard deviation over age in each gender.
Multivariate regression coefficients adjusted for age, gender, BMI, and weight status of PFM are shown in . Of these, all of the parameters had significantly different coefficients in each age group except in the underweight volunteers. The females had higher body fat than males, by approximately 7.44%, which lowered in the middle age group. The coefficient of BMI was 0.5, which was highest in middle age (0.66; P < 0.01) but lowest in older age (0.42; P < 0.01). The relationship between increasing age and body composition showed an orderly increase of PFM over each additional year of aging (0.07%, 0.13%, and 0.26% in the younger, middle, and older groups, respectively). PFM changes in underweight, overweight, and obese groups (compared with normal weight status) had the highest alteration in middle age and the lowest in the older age – except in the underweight category, which was comparable to the younger group ().
Table 3 Multivariate regression coefficient of parameters associated with percentage fat mass measured by bioelectrical impedance analysis
To confirm the coefficient alteration of age spectrums on all FM and FFM variables, the authors compared the age spectrum effects between older age volunteers (≥60 years) and younger ages (<60 years) based on the previously mentioned findings and and . The results are shown in . Of these, PFM, PFFM, FMI, and FFMI had significant differences in coefficient alteration among age spectrums (P < 0.01). However, there were no differences in coefficient change between groups in PFFMR (P = 0.11).
Table 4 Coefficient alteration between age group quarters adjusted by gender and BMI
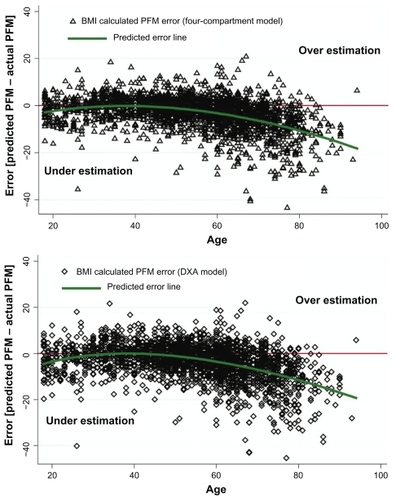
To demonstrate how the age spectrum affected the validity of PFM prediction, the authors compared PFM between measured PFM by BIA and calculated PFMCitation9 on each age spectrum () as well as error of PFM between BIA measurements and calculated PFM ().Citation9 BIA measured as PFM was comparable only in the age range of 30 and 45 years. Differences started at 45–50 years (P < 0.01) and showed significance after that age (P < 0.001). Errors of PFM prediction from BMI-based formulas using four compartments and the DXA model were demonstrated using the Bland–Altman plot in . The predicted error line in these two curves revealed that underestimation might occur in older people using calculated PFM prediction by BMI results.
Figure 3 Comparing measured BIA, calculated PFM and BMI demonstrated by mean ± SD in each age group.
Abbreviations: BMI, body mass index; BIA, bioelectrical impedance analysis; PFM, percentage of fat mass; DXA, dual energy X-ray absorptiometry; 4C, four-compartment method; SD, standard deviation.
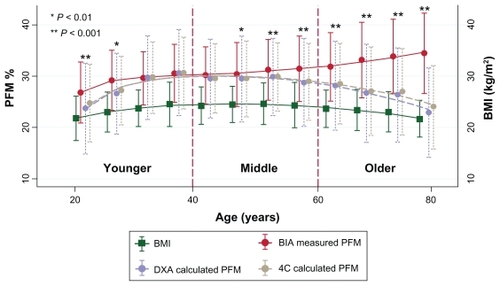
Figure 4 Bland–Altman plot demonstrated error of PFM prediction using BMI in four compartment and DXA model over age.
When taking into account age group, gender, and ethnicity difference, one multinational study of a Japanese-based population suggested that the PFM in that population was associated with a BMI of >30 (obesity diagnosis according to BMI criteria). The results for males and females were PFM (Asian criteria) of 28–29 and 40–41, respectively.Citation9 However, the cutoff point for determining obesity was different from the previous Thai adults study, where obesity was defined using PFM (Thai criteria) cutoff points of 25 for males and 35 for females.Citation10 Using the BMI status definition for obesity diagnosis in this study, the lower cutoff point of PFM Thai criteria was reasonable for obesity classification as it gave less false negative rates of obesity diagnosis (Asian vs Thai criteria; 47.4% [46/97] vs 7.22% [7/97] in females and 21.28% [10/47] vs 8.51% [4/47] in males).
Discussion
The authors stratified weight status into four groups based on previous studies.Citation9,Citation15 In the average body weight, height, and BMI were significantly different between age groups. However, the sample in this study is not a representative sample of the overall proportion of the population by weight status in Thailand: nearly 60% of the volunteers had a normal weight status, 25% were overweight, and <10% were in the extreme weight status groups (underweight or obese). However, referral or sampling bias from the selection process might be of concern due to the enrollment site being a tertiary hospital. Although each weight status classified by BMI was not a prospective cohort, the BMI was an indicator of mortality risk.Citation11 In addition, BMI changed according to variations in body fat.Citation2,Citation16 The BMI criteria were also used for weight status classification. However, the criteria may have been subject to spectrum bias when they were compared with the body fat measurement criteria.Citation15,Citation16 Because of these reasons, consideration of both BMI and fat mass together in each gender and by ethnicity might be more precise when predicting death as well as when diagnosing obesity.
The standard ways of measuring FM and FFM need special investigation. Five commonly used methods for body fat detection as standard references are: body density via underwater weighing, DXA, three- and four-compartment models, deuterium dilution techniques, and bioelectrical impedance.Citation9,Citation10,Citation17,Citation18 Along with the limitations to determining body fat, there are many proposed formulas for the calculation of percentage of body fat that use basic anthropometric parameters (BMI, age, gender, and ethnic differences). These generated prediction formulas are based on previously devised standard measurements;Citation9,Citation10,Citation19,Citation20 they have differences in coefficients regarding age, gender, and ethnic differences. However, gender and ethnicity were categorized data, while age was a continuous variable. In addition, the predictive coefficient of age in these formulas use constant values throughout the life span in the same ethnic group,Citation3,Citation9,Citation10,Citation19 which may have distorted and produced prediction errors from different spectrums in the age groups due to biological distinctions in metabolic synthesis in older people.Citation21 These hypotheses were confirmed in this study, and the age spectrum played an important role in fat mass. To reduce the interaction of BMI differences in each age group in this study, stratified weight status and gender were analyzed (shown in with mean percentage body fat for each). Of these, there were significant differences in PFM and PFFM as well as FMI and FFMI at the same weight status for both males and females, except in the obese volunteers, where age showed a reduced influence in females.
The definition of the percentage of body fat for obesity classification is controversial.Citation9,Citation10 However, in this study the obesity PFM cutoff points of 25 for males and 35 for females had a lower false negative rate than PFMs of 28 and 40, respectively. The changes in PFM, PFFM, and BMI are shown in . With increasing age, BMI and PFM diverged, especially in older volunteers. These contrasted with PFFM, which decreased in parallel with the BMI. To confirm these variables with the age spectrums, multivariate analysis (shown in ) was performed, and this revealed an increased age coefficient in older volunteers. To verify the alteration of the coefficient, the authors analyzed PFMR and PFFMR against age change, as shown in . The age spectrum effected significant differences in all of the FM and FFM variables except the PFFMR. This might be explained by the increase of PFM concurrent with the slightly decreasing PFFM caused by the physiological alterations of aging.Citation19
The authors demonstrated an error of formula for estimating the PFM in terms of constant coefficient of age compared with measured body fat by BIA in and . The overall difference was comparable in the younger and middle-aged groups, but the graph began to diverge at 50 years of age, with the difference increasing as age increased. In all of the findings in this study, the formula predicted that the PFM should be stratified in each age group with different coefficients.
There were a number of potential strengths and weaknesses in this study. The major strength was a large sample size when compared with previous studies and this study’s samples were distributed across all groups of weight status in each subgroup. Also, the bioelectrical impedance analyzer is noninvasive, portable, and is reported to have acceptable validity and accuracy.Citation22 It is widely used in Thailand due to being an inexpensive and portable instrument. However, the criterion validity using the Biodynamics BIA 310e is unknown for Thai people, and the authors noticed a wide range of measurement error if the researcher did not adhere strictly to the examination guidelines. Therefore, thorough checking of the location of the electrocardiograph pads had to be performed and strict following of screening pretest protocols needed to be verified before performing the measurements.
There were a number of inevitable limitations to the study. First, measurement error could occur for some volunteers who did not fully follow the strict pretest preparation. Second, nearly 96% of the volunteers lived in the northern region of Thailand. Even though there are similarities in body type and environment across most rural areas in Thailand, extrapolating these results to other populations should be done with caution due to the differences in lifestyles and eating patterns in each population. Third, the method for screening volunteers was by interview. Some of the volunteers, especially older patients, may have had an unknown health history, such as undetected disease, which may have resulted in selection errors. Fourth, the authors could not control for the volunteers’ occupations, which might have changed throughout their lives. There may have been differences in the amount of vigorous physical activity they engaged in due to their occupation, which may have changed their body composition, but this was not measured in this study. However, it should be noted that none of the volunteers included in the present study were athletes or body builders. Finally, the authors compared measurement results using the BIA to formulas that were created by the DXA and four-compartment methods. Using a different method might have yielded distinctly different results; however, the authors observed that the correlation of measured and calculated PFM intersected in younger volunteers and this might explain the validity of the formula difference in each age spectrum.
Conclusion
The relationship between PFM and BMI shows variation on the age spectrum. A calculated formula in older people might be distorted with the utilization of constant coefficients throughout the life span. Therefore, it is concluded that older people should be considered a special population and a prediction formula should be performed separately.
Acknowledgments
This study was supported by the Medical Association of Thailand (Prasert Prasarttong-osoth) Research Fund. The authors gratefully thank the Surgical Outpatient Department and Hospital Registration Unit, Faculty of Medicine, Maharaj Nakorn Chiang Mai Hospital, Chiang Mai University, Chiang Mai, Thailand, for providing rooms and assistance.
Disclosure
The authors have no conflicts of interest in this work. This study was a part of Assistant Professor Kaweesak Chittawatanarat’s PhD thesis project in clinical epidemiology.
References
- CalleEEThunMJPetrelliJMRodriguezCHeathCWJrBody-mass index and mortality in a prospective cohort of US adultsN Engl J Med1999341151097110510511607
- GohVHTainCFTongTYMokHPWongMTAre BMI and other anthropometric measures appropriate as indices for obesity? A study in an Asian populationJ Lipid Res200445101892189815258201
- DeurenbergPKeyouGHautvastJGJungzhongWBody mass index as predictor for body fat: comparison bebetween Chinese and Dutch adult subjectsAsia Pacific J Clin Nutr199762102105
- DeurenbergPYapMvan StaverenWABody mass index and percent body fat: a meta analysis among different ethnic groupsInt J Obes Relat Metab Disord19982212116411719877251
- AllisonDBZhuSKPlankeyMFaithMSHeoMDifferential associations of body mass index and adiposity with all-cause mortality among men in the first and second National Health and Nutrition Examination Surveys (NHANES I and NHANES II) follow-up studiesInt J Obes Relat Metab Disord200226341041611896498
- ZhuSHeoMPlankeyMFaithMSAllisonDBAssociations of body mass index and anthropometric indicators of fat mass and fat free mass with all-cause mortality among women in the first and second National Health and Nutrition Examination Surveys follow-up studiesAnn Epidemiol200313428629312684196
- TremblayABandiVImpact of body mass index on outcomes following critical careChest200312341202120712684312
- MullenJTMoormanDWDavenportDLThe obesity paradox: body mass index and outcomes in patients undergoing nonbariatric general surgeryAnn Surg2009250116617219561456
- GallagherDHeymsfieldSBHeoMJebbSAMurgatroydPRSakamotoYHealthy percentage body fat ranges: an approach for developing guidelines based on body mass indexAm J Clin Nutr200072369470110966886
- PongchaiyakulCKosulwatVRojroongwasinkulNPrediction of percentage body fat in rural Thai population using simple anthropometric measurementsObes Res4200513472973815897482
- WangJThorntonJCRussellMBurasteroSHeymsfieldSPiersonRNJrAsians have lower body mass index (BMI) but higher percent body fat than do whites: comparisons of anthropometric measurementsAm J Clin Nutr199460123288017333
- WangJDeurenbergPThe validity of predicted body composition in Chinese adults from anthropometry and bioelectrical impedance in comparison with densitometryBr J Nutr19967621751828813893
- KyleUGBosaeusIDe LorenzoADBioelectrical impedance analysis – Part I: review of principles and methodsClin Nutr20042351226124315380917
- GudivakaRSchoellerDAKushnerRFBoltMJSingle- and multifrequency models for bioelectrical impedance analysis of body water compartmentsJ Appl Physiol19998731087109610484581
- World Health OrganizationPhysical status: the use and interpretation of anthropometry. Report of a WHO Expert CommitteeWorld Health Organ Tech Rep Ser19958541452
- CurtinFMorabiaAPichardCSlosmanDOBody mass index compared to dual-energy x-ray absorptiometry: evidence for a spectrum biasJ Clin Epidemiol19975078378439253396
- LanhamDASteadMATsangKDaviesPSThe prediction of body composition in Chinese Australian femalesInt J Obes Relat Metab Disord200125228629111410833
- SvendsenOLHaarboJHassagerCChristiansenCAccuracy of measurements of body composition by dual-energy x-ray absorptiometry in vivoAm J Clin Nutr19935756056088480673
- DeurenbergPWeststrateJASeidellJCBody mass index as a measure of body fatness: age- and sex-specific prediction formulasBr J Nutr19916521051142043597
- KatchFIMcArdleWDPrediction of body density from simple anthropometric measurements in college-age men and womenHum Biol19734534454554750412
- VolpiEMittendorferBRasmussenBBWolfeRRThe response of muscle protein anabolism to combined hyperaminoacidemia and glucose-induced hyperinsulinemia is impaired in the elderlyJ Clin Endocrinol Metab200085124481449011134097
- DemuraSYamajiSGoshiFKobayashiHSatoSNagasawaYThe validity and reliability of relative body fat estimates and the construction of new prediction equations for young Japanese adult malesJ Sports Sci200220215316411811572