
Abstract
Purpose
The objectives of this study were two-fold: 1) to investigate differences in activity duration and amplitude of the submental muscles during swallowing measured with surface electromyography (sEMG) in older patients with sarcopenic dysphagia compared to those without dysphagia and 2) to examine the diagnostic accuracy of submental sEMG signals for sarcopenic dysphagia.
Patients and Methods
Patients (n = 60) aged ≥65 years participated in this cross-sectional study. The submental muscle activity duration parameters were the duration from the onset of swallowing to the maximum amplitude (duration A), duration from the maximum amplitude to the end of the swallowing activity (duration B), and total duration. The amplitude parameters were mean and maximum amplitude. Maximum lingual pressures were also measured for comparison with sEMG parameters.
Results
Duration A was not significantly different between the groups (p = 0.15), but duration B (p < 0.001) and total duration (p < 0.001) were significantly different between the non-dysphagic and sarcopenic dysphagic groups. The mean (p = 0.014) and maximum (p < 0.001) amplitudes were significantly different between the groups. The area under the receiver operating characteristic curve (AUC) was 0.94 (95% confidence interval (CI) 0.87–0.98) for duration B, 0.95 (95% CI 0.89–0.99) for total duration, 0.76 (95% CI 0.63–0.87) for maximum amplitude, and 0.61 (95% CI 0.47–0.75) for mean amplitude. The AUC of the total duration was significantly greater than that of lingual pressure (p = 0.02).
Conclusion
Patients with sarcopenic dysphagia had longer submental muscle activity duration and higher amplitude during swallowing as assessed using sEMG. The findings of this study can be useful in elucidating the underlying pathophysiology of sarcopenic dysphagia and in diagnosing sarcopenic dysphagia.
Introduction
The global population is aging at an increasing rate. As a result of this global aging process, health issues related to sarcopenia have attracted a great deal of attention.Citation1,Citation2 Sarcopenia, a geriatric syndrome, is characterized by accelerated loss of muscle mass and function with advancing age.Citation3 Sarcopenia occurs not only in appendicular skeletal muscle mass, but also in the muscles of the head and neck involved in deglutition.Citation4 This leads to a condition termed “sarcopenic dysphagia” in which these sarcopenia-induced muscular changes impact the biomechanics of swallowing.Citation5,Citation6 However, the pathophysiology of dysphagia in patients with sarcopenia is poorly understood, but is critical for the design of appropriate dysphagia rehabilitation programs.
A variety of muscles are involved in the swallowing process. The tongue is a major muscle group that is critically important for bolus propulsion through the oral cavity and pharynx. Individuals with comorbid sarcopenia and dysphagia have been found to generate low maximum isometric lingual pressures, reflecting reduced tongue strength.Citation7,Citation8 The suprahyoid muscles, including the mylohyoid, stylohyoid, digastric, and geniohyoid muscles, are also important as they elevate the larynx during the swallow.Citation9 Suprahyoid muscles are located superiorly to the hyoid bone of the neck, and, as a result, it is challenging to directly measure the force generation of these muscles.
Electromyography measures electrical activity in motor neurons and muscles during muscle contraction. Surface electromyography (sEMG) records activity within the electrode detection area. sEMG is a non-invasive, radiation-free, inexpensive, and portable method that has been proposed as a diagnostic modality for identifying the presence of dysphagia.Citation10 sEMG of the submental muscles shows activity from the mylohyoid, geniohyoid, and anterior belly of the digastric muscles of the suprahyoid muscle group.Citation11 One study suggested that different etiologies for swallowing impairment result in specific submental sEMG patterns in terms of timing and amplitude.Citation10 However, the diagnostic accuracy of submental sEMG for dysphagia has yet to be determined, and the submental sEMG pattern in patients with sarcopenic dysphagia has not been investigated.
This study had two main objectives: 1) to investigate the characteristics of submental muscle activity using sEMG in patients with comorbid sarcopenia and dysphagia and 2) to examine the diagnostic accuracy of submental muscle activation on sEMG for sarcopenic dysphagia. We hypothesized that patients with comorbid sarcopenia and dysphagia would demonstrate different sEMG activity patterns of the submental muscle activation than those without dysphagia, which may be useful in the diagnosis of sarcopenic dysphagia.
Patients and Methods
Participants
A cross-sectional study was performed with older inpatients in a rehabilitation hospital between January 2018 and May 2019. Inclusion criteria were the following: 1) Mini-Mental State Examination (MMSE) score 21 points or higher; 2) 65 years of age or older; and 3) currently hospitalized for post-acute inpatient rehabilitation. Exclusion criteria were the following: 1) current or prior diagnosis of diseases known to cause dysphagia, including cerebrovascular disease, head and neck cancer, or underlying neuromuscular disease; 2) pacemaker or implantable cardiac defibrillators in place; 3) a history of tracheostomy; 4) current nasogastric tube; or 5) patients who had possible dysphagia on a screening test, but did not undergo a gold standard test. We excluded patients with a nasogastric tube because a nasogastric tube in the pharynx can affect swallowing and submental sEMG activity pattern. Informed consent was obtained from all patients and their families or legal representatives, and the present study was approved by the institutional ethics committee of Setagaya Memorial Hospital, and all procedures were performed in accordance with the principles outlined in the Helsinki Declaration.
Measurement of Submental Muscle Activity
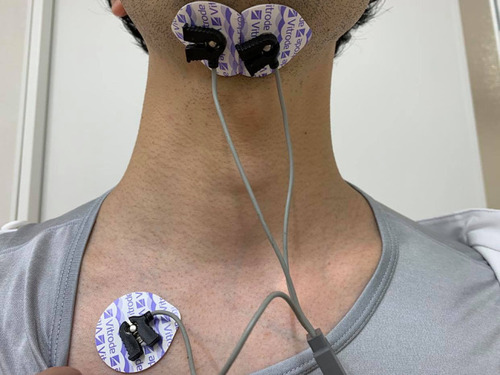
The activity of the submental muscles was recorded using a surface electromyograph (MyoTrace 400; Noraxon USA Inc., Scottsdale, AZ, USA) with a preamplifier (band pass filter 10 Hz–500 Hz, common mode rejection ratio of >100 dB at 60 Hz, input impedance >100 MΩ, amplifier gain 500). A 16-bit analog to digital converter with an anti-aliasing filter set to 1000 Hz frequency was also used. A pair of disposable self-adhesive electrodes (Vitrode L-150; Nihon Kohden Co., Tokyo, Japan) (electrode diameter: 10 mm) were fixed to the skin surface of the submental muscles, which is between the area of the hyoid bone and the chin symmetrically, with centers separated by 20 mm.Citation12 The ground electrode was attached to the skin under the right clavicle. shows the placement of the electrodes. Before attaching the electrodes, the skin surface was shaved, if necessary, and cleaned using alcohol swabs. Patients were comfortably seated upright in their wheelchairs or chairs.
Figure 1 Placement of the electrodes for surface electromyography measurement.
Patients were given 1 mL of tap water on the floor of the mouth with a syringe and asked to swallow by a Speech-Language-Pathologist (SLP). Water swallowing was performed three times per patient. The time interval between water swallows was 30 seconds. After the last 1 mL of water was swallowed, patients were asked to open their jaw as wide as possible for 10 seconds to determine the amplitude as a reference for normalization. Because sEMG amplitude is affected by various tissue conditions, normalization according to a reference muscle contraction is necessary to compare between individual amplitudes.Citation13 To identify water swallowing accurately, simultaneous video recording was used to capture the movement of the mouth and larynx during swallowing. Two raters derived these measurements in order to establish intra-rater and inter-rater reliability. A random sample of 20% of the total number of included patients was selected for repeat reliability measures and the following agreement classes were used: very good (>0.81), good (0.61–0.80), moderate (0.41–0.60), and poor (<0.40).Citation14
Analysis of Submental Muscle Activity
Measurement parameters were mean and maximum amplitude of submental muscle activation during swallowing, duration from the swallow onset to the maximum amplitude point (duration A), duration from the maximum amplitude point to the end of the swallow activity (duration B), and total duration. For amplitudes, the reference amplitude was the amplitude during jaw-opening (contraction). The mean and maximum amplitudes were then as a percentage of jaw opening contraction (% JOC). The reference amplitude was the average amplitude for 3 seconds from the 1 second point after the maximum amplitude during opening of the jaw considering unstable amplitude at the beginning of jaw opening. For the duration parameters, we defined the swallow onset and the end point of the swallow activity as follows: 1) swallow onset was determined when a clear visual increase in sEMG activity above the background activity was observedCitation15 and 2) end point was when the EMG trace returned to within +2 standard deviations (SDs) of the baseline amplitude level.Citation16 Baseline amplitude was defined as the average amplitude at rest for 1 second from the beginning of the sEMG trace. All parameters took an average value of three swallows. sEMG was analyzed using offline software (MyoResearch XP; Noraxon USA Inc.). To analyze the amplitudes and durations, the data from the software was converted to values on a Microsoft Excel worksheet (Microsoft Corp., Redmond, WA, USA).
Assessment of Sarcopenic Dysphagia
Patients were divided into either a non-dysphagic group or sarcopenic dysphagic group. Patients were diagnosed with sarcopenic dysphagia when they had both sarcopenia and dysphagia. Sarcopenia was diagnosed by a low skeletal muscle mass index and low muscle strength based on the criteria of the Asian Working Group for Sarcopenia (AWGS).Citation17 Low skeletal muscle mass index (SMI) was assessed using bioimpedance analysis (men: <7.0 kg/m2, women: <5.7 kg/m2) (InBody S10, InBody Japan Inc., Tokyo, Japan). Low muscle strength was assessed based on grip strength (men: <26 kg, women: <18 kg). Grip strength was measured using a digital grip strength dynamometer (TKK 5401; Takei Scientific Instruments, Tokyo, Japan). Participants were asked to sit in a relaxed position and grip the instrument as hard as possible three times with each hand with full elbow extension and the wrist in a neutral position by physical therapists or occupational therapists. The highest values were used for the analysis. In the algorithm of AWGS, sarcopenia is diagnosed by low SMI and low muscle strength or low physical function. However, we did not use physical function for the diagnosis because our study included participants with orthopedic disease of the legs which could affect physical function.
Dysphagia was assessed using the 100-mL water swallow test (WST),Citation18 which has a reported sensitivity and specificity of up to 85.5% and 91.7%, respectively, and fiberoptic endoscopic evaluation of swallowing (FEES). FEES is one of the gold standard tests to diagnose dysphagia.Citation19 The WST was performed by SLPs on the first day of hospitalization. Patients drank the water in a cup as quickly as possible. Patients with abnormal swallowing speed (<10 mL/s), who coughed within 1 minute after the test or had a wet-hoarse voice after the test were considered as possibly having dysphagia. Patients with possible dysphagia on the WST and those who required food and/or liquid consistency modification based on clinical evaluation by SLPs undertook FEES. FEES was performed the day after sEMG assessment and within one week of hospitalization. FEES was performed using the five levels of drink consistency in the International Dysphagia Diet Standardisation Initiative framework.Citation20 Patient’s swallow was recorded on video and assessed using the penetration-aspiration scale (PAS) which ranges from 1 (material does not enter the airway) to 8 (material enters the airway, passes below the level of the vocal folds, and no effort is made to eject).Citation21 We considered patients with scores of 3 (Material enters the airway, remains above the vocal folds, and is not ejected from the airway) and over on the PAS score as having dysphagia based on previous studies.Citation22 Patients with possible dysphagia on the water-swallow tests who did not need any food and liquid consistency modification did not undertake FEES, and they were not included in our analysis.
Other Measurements
Maximum lingual pressure was measured as an index for sarcopenic dysphagia.Citation23 The measurements were taken on the same day as sEMG measurement. Lingual pressure was measured three times, and the highest result was defined as the maximum lingual pressure. Lingual pressure was measured using an instrument (JMS, Hiroshima, Japan) with a balloon-type oral probe. This instrument measures the pressure of the front part of the tongue by pushing the balloon. An SLP who measured lingual pressure and sEMG was blinded to the patients’ water swallow test results. We assessed the following patient characteristics. The oral intake level was assessed by SLPs using the Functional Oral Intake Scale (FOIS), which ranges from level 1 (nothing by mouth) to 7 (total oral diet with no restrictions).Citation24 Performance in activities of daily living (ADL) was assessed by physical therapists using the Barthel Index (BI), which ranges from 0 (totally dependent) to 100 (independent).Citation25 Nutritional status was assessed by dietitians using the Mini Nutritional Assessment Short-Form (MNA-SF), which is a questionnaire whereby a score of 7 or less indicates malnutrition.Citation26 Morbidity was assessed using the Charlson Comorbidity Index (CCI), for which a higher score means greater morbidity.Citation27
Sample Size Calculation
We calculated the sample size based on data in previous studies to compare the AUC for total duration and lingual pressure.Citation7,Citation28 R version 3.6.2 was used for the calculation with the “pROC” package.Citation29,Citation30 The duration was set to 1.5 seconds in the non-dysphagic group and 2.2 seconds in the sarcopenic dysphagic group, and the SD was 0.3. The lingual pressure was set to 30 kPa in the non-dysphagic group and 21 kPa in the sarcopenic dysphagic group, and the SD was 5. The assumed AUC was 0.88 for the duration and 0.79 for the lingual pressure. The correlation coefficient of the two parameters was set to 0.6. The statistical power was 0.8. The computed sample size was 58 in total. We assumed no differences in sEMG parameters and lingual pressure according to sex based on the previous studies.Citation7,Citation28 However, sarcopenia-related parameters, such as SMI and grip strength, are different according to sex, so we included equal numbers of males and females to compare patient characteristics.
Statistical Analysis
To compare parameters in the non-dysphagic group and sarcopenic dysphagic group, the Mann–Whitney U-test and chi-square test were used. To calculate the diagnostic accuracy of parameters for sarcopenic dysphagia, a receiver operating characteristic (ROC) curve analysis was used. R version 3.6.2 was used for the analysis with the “coin” package for the Mann Whitney U-test, “pROC” for the area under the receiver operating characteristic curve (AUC) with the bootstrap method (2000 replicates), and “cutpointr” with the method of maximizing the sum of sensitivity and specificity for cut-off value.Citation29,Citation31,Citation32 We calculated the diagnostic odds ratio (DOR).Citation33 Higher DORs indicate better discriminatory performance, and potentially useful parameters tended to have a DOR well above 20.Citation34 To assess the association between the duration and the amplitude and other factors in all patients, we used a simple linear regression analysis. A two-sided P of less than 0.05 was considered statistically significant.
Results
Of 836 patients who were admitted to the hospital during the study period, we considered 289 patients to meet the inclusion criteria. Of those patients, we excluded 229 patients: 133 patients with a current or prior diagnosis of diseases known to cause dysphagia, 21 patients with a pacemaker or implantable cardiac defibrillators in place, 32 patients with a history of tracheostomy, 34 patients with a current nasogastric tube, and 9 patients with possible dysphagia on the water swallow test but not on FEES. Finally, a total of 60 patients were included in the analysis, with 30 (15 men) in the non-dysphagic group and 30 (15 men) in the sarcopenic dysphagic group. There were no missing data. The patients with dysphagia could drink 1 mL of water without choking on sEMG assessment. There was no other adverse event during sEMG assessment. shows the patient characteristics. The mean age (SD) in all patients was 87.12 (6.70) years. In the sarcopenic dysphagic group, 96.7% of patients showed malnutrition status, and 53.3% in the non-dysphagic group. The median FOIS level was 6 (total oral diet with multiple consistencies without special preparation, but with specific food limitations) in the non-dysphagic group and 5 (total oral diet with multiple consistencies but requiring special preparation/compensations) in the sarcopenic dysphagic group. Furthermore, 63.3% of the patients in the sarcopenic dysphagic group had all meals by mouth. Regarding primary diseases, 22 patients had orthopedic conditions (hip fracture, 10 in the non-dysphagic group and 6 in the sarcopenic dysphagic group; lumbar compression fracture, 3 in each group). Digestive disorders (n = 14) included intestinal obstruction (2 in the non-dysphagic group and 6 in the sarcopenic dysphagic group), cholecystitis (1 in the non-dysphagic group and 4 in the sarcopenic dysphagic group), and appendicitis (1 in the sarcopenic dysphagic group).
Table 1 Characteristics of Study Participants
shows the comparison of submental muscle activity between the two groups. All parameters, except duration A, were significantly different between the two groups. The duration B and total duration were longer, and the mean and maximum amplitudes were higher in the sarcopenic dysphagic group than in the non-dysphagic group (p = 0.014 for mean amplitude, p < 0.001 for others). shows the sEMG patterns in a patient without dysphagia and with sarcopenic dysphagia. shows the AUC, cut-off value, sensitivity, specificity, and DOR. The AUCs were excellent for duration B (AUC 0.94, 95% CI 0.87–0.98) and total duration (AUC 0.95, 95% CI 0.89–0.99), very good for lingual pressure (AUC 0.81, 95% CI 0.69–0.91), good for maximum amplitude (AUC 0.76, 95% CI 0.63–0.87), and sufficient for duration A (AUC 0.61, 95% CI 0.45–0.75) and mean amplitude (AUC 0.61, 95% CI 0.47–0.75).
Table 2 Comparison of sEMG Parameters and Lingual Pressure in the Non-Dysphagic and Sarcopenic Dysphagic Groups
Table 3 Diagnostic Accuracy of sEMG Parameters and Cut-Off Values for Sarcopenic Dysphagia
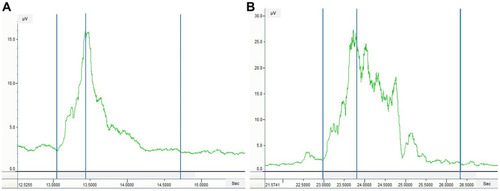
Figure 2 Submental surface electromyography (sEMG) patterns in patients without and with dysphagia. (A) sEMG pattern in a patient without dysphagia. (B) sEMG pattern in a patient with sarcopenic dysphagia. Left-most blue vertical line, swallow onset; middle blue vertical line, maximum amplitude point; right-most blue vertical line, end of the swallowing activity.
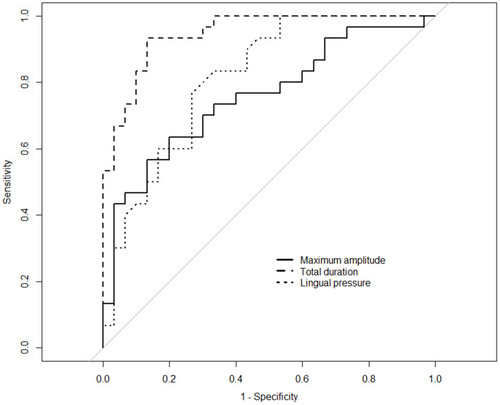
shows the results of the simple linear regression analysis with total duration and maximum amplitude as dependent variables and other sarcopenia-related factors and lingual pressure as independent variables. The total duration was significantly associated with BI, malnutrition, grip strength, and lingual pressure, but maximum amplitude was associated with only SMI. shows the ROC curves for the total duration and maximum amplitude that have the highest AUCs for each parameter, and lingual pressure for the diagnosis of sarcopenic dysphagia. In the comparison of the AUCs between the total duration, in which the AUCs were highest for the sEMG parameters, and lingual pressure, the difference was significant (p = 0.02). The intraclass correlation coefficient (ICC) for intra-rater reliability (ICC 1, 3) was 0.73 (good) for duration A, 0.88 (very good) for duration B, 0.74 (good) for total duration, 0.86 (very good) for mean amplitude, and 0.88 (very good) for maximum amplitude. The ICC for inter-rater reliability (ICC 2, 3) was 0.70 (good) for duration A, 0.82 (very good) for duration B, 0.71 (good) for total duration, 0.81 (very good) for mean amplitude, and 0.86 (very good) for maximum amplitude.
Table 4 Association Between Duration, Amplitude, and Sarcopenia-Related Factors
Figure 3 Receiver operating characteristic curve for the diagnosis of sarcopenic dysphagia.
Discussion
This study revealed differences in submental muscle activity assessed by duration and amplitude using sEMG during swallowing between patients with sarcopenic dysphagia and without dysphagia. The muscle activity duration was longer and the amplitude was higher in patients with sarcopenic dysphagia. The diagnostic accuracy of activity duration for sarcopenic dysphagia assessed using AUC was excellent and the maximum amplitude was good.
A previous study that assessed swallowing physiology using sEMG in healthy adults showed that there was a significant linear increase with age in the duration of swallowing in older adults.Citation28 Although the results of our study did not reveal a significant association between age and the total submental muscle activity duration, these prior data suggest that submental sEMG signals can change due to sarcopenia.Citation28 In our study, ADL, malnutrition, and grip strength were associated with the total duration of submental muscle activity. Thus, secondary sarcopenia due to inactivity and malnutrition may affect submental muscle activity duration during swallowing. Regarding amplitudes, a previous study showed that older adults had lower amplitude of submental muscle activity compared to the younger adults during swallowing.Citation28 Our study showed higher amplitudes during swallowing in patients with sarcopenic dysphagia. This finding may be due to differences in the study subjects. Most of our study subjects had sarcopenia, and patients with sarcopenic dysphagia had lower muscle mass and fat percentage than those without dysphagia. Since subcutaneous tissue attenuates sEMG amplitude,Citation35 higher amplitudes may be associated with thin subcutaneous tissue, especially with lower muscle mass.
The reliability of sEMG measurements was high in both inter-rater and intra-rater assessments. This is consistent with previous studies that showed high reliability in measurements of submental sEMG amplitude and duration.Citation36 Another study demonstrated the accuracy and reliability of identifying swallows from submental sEMG shapes.Citation37 sEMG can be a reliable tool to assess suprahyoid muscle function during swallowing for patients with sarcopenic dysphagia.
The pathophysiology of the suprahyoid muscles in older people with sarcopenia has been rarely studied. In one study using ultrasound, patients with sarcopenic dysphagia demonstrated higher brightness of the geniohyoid muscles, which are part of the suprahyoid muscle group.Citation38 Muscle quality change may impact submental sEMG values. In addition to muscle quality, suprahyoid muscle strength may also be associated with amplitude and/or activity duration on submental sEMG. Since patients with sarcopenic dysphagia had lower grip strength and lingual pressure, they may also have lower suprahyoid muscle strength. These patients may need to generate more power to swallow water safely with more muscle fiber activation to compensate for suprahyoid muscle weakness, which could result in higher amplitude and/or longer activity duration on submental sEMG.
A limitation of our study was that we excluded patients who were positive for dysphagia on the WST, but did not undertake FEES. Thus, the diagnostic accuracy in this study may be overestimated, and the generalizability of our findings needs to be considered with care. Moreover, 63.3% of the patients with sarcopenic dysphagia in this study took all meals by mouth. It is possible that results may have been different if more patients with severe dysphagia not able to take all meals by mouth were included in this study. Lastly, the diagnostic method for sarcopenic dysphagia in this study may have contributed to non-differential misclassification bias which would have the effect of underestimating the strength of association.
Conclusions
This study showed that patients with sarcopenic dysphagia had longer submental sEMG activity duration and higher amplitude of the suprahyoid muscles during swallowing compared to patients without sarcopenic dysphagia. The diagnostic accuracy was excellent for activity duration on sEMG and good for the maximum amplitude. The findings of this study are useful for understanding the pathophysiology of sarcopenic dysphagia and improving its diagnosis.
Disclosure
The authors report no conflicts of interest in this work.
References
- Chen LK, Lee WJ, Peng LN, Liu LK, Arai H, Akishita M. Recent advances in sarcopenia research in Asia: 2016 update from the asian working group for sarcopenia. J Am Med Dir Assoc. 2016;17(8):767.e1–767.e7677. doi:10.1016/j.jamda.2016.05.016
- Cruz-Jentoft AJ, Bahat G, Bauer J, et al. Sarcopenia: revised European consensus on definition and diagnosis. Age Ageing. 2018;48(1):16–31. doi:10.1093/ageing/afy169
- Cruz-Jentoft AJ, Baeyens JP, Bauer JM, et al. Sarcopenia: european consensus on definition and diagnosis: report of the European Working Group on Sarcopenia in Older People. Age Ageing. 2010;39(4):412–423. doi:10.1093/ageing/afq03420392703
- Tamura F, Kikutani T, Tohara T, Yoshida M, Yaegaki K. Tongue thickness relates to nutritional status in the elderly. Dysphagia. 2012;27(4):556–561. doi:10.1007/s00455-012-9407-z22538556
- Kuroda Y, Kuroda R. Relationship between thinness and swallowing function in Japanese older adults: implications for sarcopenic dysphagia. J Am Geriatr Soc. 2017;127(9):1785–1786. doi:10.1111/j.1532-5415.2012.04123.x
- Wakabayashi H. Presbyphagia and sarcopenic dysphagia: association between aging, sarcopenia, and deglutition disorders. J Frailty Aging. 2014;3(2):97–103.27049901
- Sakai K, Nakayama E, Tohara H, et al. Diagnostic accuracy of lip force and tongue strength for sarcopenic dysphagia in older inpatients: a cross-sectional observational study. Clin Nutri. 2019;38(1):303–309. doi:10.1016/j.clnu.2018.01.016
- Maeda K, Akagi J. Decreased tongue pressure is associated with sarcopenia and sarcopenic dysphagia in the elderly. Dysphagia. 2015;30(1):80–87. doi:10.1007/s00455-014-9577-y25248988
- Shaw SM, Martino R. The normal swallow: muscular and neurophysiological control. Otolaryngol Clin North Am. 2013;46(6):937–956. doi:10.1016/j.otc.2013.09.00624262952
- Vaiman M, Eviatar E. Surface electromyography as a screening method for evaluation of dysphagia and odynophagia. Head Face Med. 2009;5:9. doi:10.1186/1746-160X-5-919232090
- Monaco A, Cattaneo R, Spadaro A, Giannoni M. Surface electromyography pattern of human swallowing. BMC Oral Health. 2008;8(1):6. doi:10.1186/1472-6831-8-618366770
- Hermens HJ, Freriks B, Disselhorst-Klug C, Rau G. Development of recommendations for SEMG sensors and sensor placement procedures. J Electromyogr Kinesiol. 2000;10(5):361–374. doi:10.1016/S1050-6411(00)00027-411018445
- Clark DJ, Fielding RA. Neuromuscular contributions to age-related weakness. J Gerontol A Biol Sci Med Sci. 2012;67(1):41–47. doi:10.1093/gerona/glr04121415261
- DG A. Some common problems in medical research In: Practical Statistics for Medical Research. London: Chapman and Hall; 1991.
- Coriolano MdG WS, Belo R. Carneiro D, et al. Swallowing in patients with Parkinson’s disease: a surface electromyography study. Dysphagia. 2012;27(4):550–555. doi:10.1007/s00455-012-9406-022644084
- Archer SK, Garrod R, Hart N, Miller S. Dysphagia in duchenne muscular dystrophy assessed objectively by surface electromyography. Dysphagia. 2013;28(2):188–198.23179024
- Chen LK, Liu LK, Woo J, et al. Sarcopenia in Asia: consensus report of the asian working group for sarcopenia. J Am Med Dir Assoc. 2014;15(2):95–101. doi:10.1016/j.jamda.2013.11.02524461239
- Wu M-C, Chang Y-C, Wang T-G, Lin L-C. Evaluating swallowing dysfunction using a 100-mL water swallowing test. Dysphagia. 2004;19(1):43–47. doi:10.1007/s00455-003-0030-x14745645
- Giraldo-Cadavid LF, Leal-Leano LR, Leon-Basantes GA, et al. Accuracy of endoscopic and videofluoroscopic evaluations of swallowing for oropharyngeal dysphagia. Laryngoscope. 2017;127(9):2002–2010. doi:10.1002/lary.2641927859291
- Cichero JA, Lam P, Steele CM, et al. Development of international terminology and definitions for texture-modified foods and thickened fluids used in dysphagia management: the IDDSI framework. Dysphagia. 2017;32(2):293–314.27913916
- Rosenbek JC, Robbins JA, Roecker EB, Coyle JL, Wood JL. A penetration-aspiration scale. Dysphagia. 1996;11(2):93–98. doi:10.1007/BF04178978721066
- Borders JC, Brates D. Use of the penetration-aspiration scale in dysphagia research: a systematic review. Dysphagia. 2020;35(4):583–597.31538220
- Fujishima I, Fujiu-Kurachi M, Arai H, et al. Sarcopenia and dysphagia: position paper by four professional organizations. Geriatr Gerontol Int. 2019;19(2):91–97.30628181
- Crary MA, Mann GD, Groher ME. Initial psychometric assessment of a functional oral intake scale for dysphagia in stroke patients. Arch Phys Med Rehabil. 2005;86(8):1516–1520. doi:10.1016/j.apmr.2004.11.04916084801
- Mahoney FI, Barthel DW. Functional evaluation: the Barthel index. Md State Med J. 1965;14:61–65.
- Cederholm T, Bosaeus I, Barazzoni R, et al. Diagnostic criteria for malnutrition – an ESPEN consensus statement. Clin Nutri. 2015;34(3):335–340. doi:10.1016/j.clnu.2015.03.001
- Charlson ME, Pompei P, Ales KL, MacKenzie CR. A new method of classifying prognostic comorbidity in longitudinal studies: development and validation. J Chronic Dis. 1987;40(5):373–383. doi:10.1016/0021-9681(87)90171-83558716
- Vaiman M, Eviatar E, Segal S. Evaluation of normal deglutition with the help of rectified surface electromyography records. Dysphagia. 2004;19:2. doi:10.1007/s00455-003-0504-x
- Robin X, Turck N, Hainard A, et al. pROC: an open-source package for R and S+ to analyze and compare ROC curves. BMC Bioinform. 2011;12(1):77. doi:10.1186/1471-2105-12-77
- Obuchowski NA, McClish DK. SAmple size determination for diagnostic accuracy studies involving binormal ROC curve indices. Stat Med. 1997;16(13):1529–1542. doi:10.1002/(SICI)1097-0258(19970715)16:13<1529::AID-SIM565>3.0.CO;2-H9249923
- Hothorn T, Hornik K, Van De Wiel MA, Zeileis A, Lego A. System for conditional inference. Am Stat. 2006;60(3):257–263. doi:10.1198/000313006X118430
- Thiele C cutpointr: determine and Evaluate Optimal Cutpoints in Binary Classification Tasks. R package version 1.0.1.; 2019 Available from: https://CRAN.R-project.org/package=cutpointr. Accessed 101, 2020.
- Glas AS, Lijmer JG, Prins MH, Bonsel GJ, Bossuyt PMM. The diagnostic odds ratio: a single indicator of test performance. J Clin Epidemiol. 2003;56(11):1129–1135. doi:10.1016/S0895-4356(03)00177-X14615004
- Fischer JE, Bachmann LM, Jaeschke R. A readers’ guide to the interpretation of diagnostic test properties: clinical example of sepsis. Intensive Care Med. 2003;29(7):1043–1051. doi:10.1007/s00134-003-1761-812734652
- Nordander C, Willner J, Hansson GA, et al. Influence of the subcutaneous fat layer, as measured by ultrasound, skinfold calipers and BMI, on the EMG amplitude. Eur J Appl Physiol. 2003;89(6):514–519. doi:10.1007/s00421-003-0819-112712347
- Ding R, Larson CR, Logemann JA, Rademaker AW. Surface electromyographic and electroglottographic studies in normal subjects under two swallow conditions: normal and during the Mendelsohn manuever. Dysphagia. 2002;17(1):1–12. doi:10.1007/s00455-001-0095-311820381
- Crary MA, Carnaby Mann GD, Groher ME. Identification of swallowing events from sEMG signals obtained from healthy adults. Dysphagia. 2007;22(2):94–99. doi:10.1007/s00455-006-9059-y17294299
- Ogawa N, Mori T, Fujishima I, et al. Ultrasonography to measure swallowing muscle mass and quality in older patients with sarcopenic dysphagia. J Am Med Dir Assoc. 2018;19(6):516–522. doi:10.1016/j.jamda.2017.11.00729287693