
Abstract
Purpose
Alzheimer’s disease (AD) and vascular dementia shared similar symptoms, the aim of the present study was to identify potential differences in the mechanisms underlying the two diseases.
Materials and Methods
The data set including AD, vascular dementia, and control samples was carried out gene differential expression analysis, weighted gene co-expression network analysis, functional enrichment, protein–protein interaction network construction, and least absolute shrinkage and selection operator analysis to reveal the differences in the mechanisms underlying the two diseases and potential diagnostic gene signature.
Results
We identified the gene modules related to AD or vascular dementia. Enrichment analysis of module genes and construction of a protein–protein interaction network suggested that the “brown” module may be involved in a chemokine pathway, the “blue” module may be involved in cortisol synthesis and secretion, and the “turquoise” module may be involved in cholinergic synapse transmission. The hub gene-based signature index may be a biomarker of AD and vascular dementia and may even differentiate the two diseases from each other with high area under curve.
Conclusion
Our results identified not only core pathways involved in both AD and vascular disease, but also their potentially specific pathways. We proposed the hub gene-based signature index may be useful for diagnosing AD and vascular dementia.
Introduction
The risk of Alzheimer’s disease (AD), one of the most common neurodegenerative diseases, increases with increasing inflammation, autoimmune disease, cholinergic synaptic receptor activity and cortisol secretion.Citation1,Citation2 AD involves the accumulation of extracellular amyloid-β1 (Aβ) and deposits of intracellular tau neurofibrillary tangles.Citation3–Citation5 The main symptoms of AD are difficulty in concentration, memory loss and the gradual loss of specific cognitive function, which eventually leads to loss of independence and death.Citation6 The loss of independence places a heavy burden on patients and their families. So far, AD treatments are only palliative and delay the development of symptoms, without halting or reversing the disease.Citation7
Like AD, vascular dementia manifests as dementia, but it is distinct from AD. Vascular dementia is caused by ischemia, hemorrhage, hypoxia or hypoxic brain damage. Its incidence is increasing, together with the incidence of cerebrovascular diseases in general.Citation8 Although vascular dementia and AD are distinct diseases, they can co-exist in patients, who are then diagnosed as having “mixed dementia”.Citation9 In fact, VD is the second most common cause of dementia, second only to AD.Citation10 The two diseases share several features,Citation11 and both may involve impairment of cholinergic function.Citation12,Citation13 Nevertheless, the two diseases are distinct but can be difficult to distinguish clinically. Research that clarifies similarities and differences between their underlying mechanisms may facilitate differential diagnosis and treatment.
Given the association of AD with cholinergic dysfunction, current treatments focus on acetylcholinesterase inhibitors that act on the central nervous system, which can restore cholinergic input and partially improve memory loss. AD also involves activation of astrocytes and microglia, which can be found in neuronal plaques, as well as an increase in levels of pro-inflammatory molecules. These findings implicate systemic inflammation in AD.Citation14 Consistent with this idea, levels of chemokine receptors, such as CCL2, also known as monocyte chemoattractant protein-1 (MCP-1), can influence the risk of AD and accelerate its development.Citation15 CCL2, secreted mainly by astrocytes and microglia,Citation16 promotes inflammation as well as the differentiation and migration of macrophages.Citation17 After binding to its cognate receptor, CCL2 activates the kinases PKC, PI2K, Akt and ERK Higher CCL2 levels activate microglia near the inflammatory site,Citation18 and such microglia contribute to amyloid plaques, plaque aggregation and cognitive impairment.Citation19,Citation20 Elevated CCL2 levels are risk factors not only for AD but also for neuroinflammatory disease and other neurodegenerative diseases, such as multiple sclerosis, cerebral ischemia, and traumatic brain injury.Citation3 At the same time, CCL2 down-regulation in AD mice also accelerates amyloid pathology.Citation21 These results indicate that too low or too high CCL2 levels can harm the brain’s innate immunity and cognitive function.
In order to further explore the mechanisms of AD and how they may be different from those of vascular dementia, we conducted a comprehensive module exploration based on publicly available data. We found that both diseases involve immune-related biological processes, including the regulation of inflammatory responses and T cell activation. These processes are significantly involved in signaling based on chemokines, cytokines and Toll-like receptors. While AD may be associated with cholinergic synaptic disorder and decreased neurotransmitter secretion, vascular dementia is more likely to be associated with abnormal lipid metabolism and cortisol production.
Materials and Methods
Data Collection and Processing
Gene expression datasets of patients with AD in the Gene Expression Omnibus (GEO) database (www.ncbi.nlm.nih.gov/geo) were searched. GSE122063, which was based on the GPL16699 platform, included brain samples from 56 samples with AD, 36 samples with vascular dementia, and 44 healthy samples. The samples were from cases matched for age, postmortem interval, and sex.
Gene expression in frontal and temporal cortex of patients with AD, patients with vascular dementia or non-demented controls was profiled using data from the University of Michigan Brain Bank. Controls and AD patients had no infarcts in the autopsied hemisphere. The “normalize between arrays” function in the limma package was used to normalize the gene expression profiles.Citation22 If a gene was detected by multiple probes, the expression values of all probes were averaged to obtain the value for the gene.
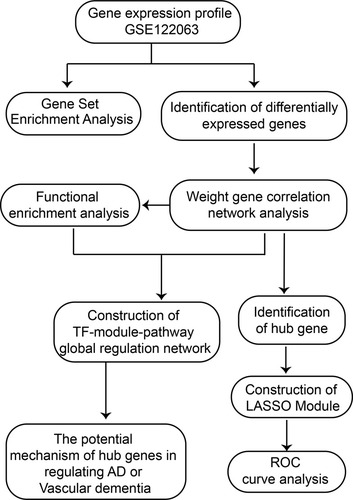
The workflow of the study is shown in .
Figure 1 Flow chart of study design. AD, Alzheimer’s disease; LASSO, least absolute shrinkage and selection operator; ROC, receiver operating characteristic curve; TF, transcription factor.
Analysis of Differentially Expressed Genes (DEGs)
In GSE122063, genes differentially expressed between patients with AD or VD and controls were identified using the limma package in R. DEGs were included in further analysis if |log2 (fold change) | >1 and the P-value after adjustment by the false discovery rate was below 0.05.
Weighted Gene Co-Expression Network Analysis (WGCNA) and Identification of Hub Genes
For WGCNA, the sample phenotypes were converted into a number matrix with three columns (AD, VD, and control) and samples in rows. For example, an AD sample was marked 1 in AD column, 0 in VD and control column. The gene expression profile was rotated into a new matrix with gene in column and observers in rows. We extracted the gene expression profile of DEGs from GSE122063 in order to run the WGCNA package in R.Citation23 First, hierarchical clustering analysis was performed using the “hclust” function, then the soft thresholding power value was screened from 1 to 30 during module construction using the “pickSoftThreshold” function. The average connectivity among different modules and their independence were assessed at the different power values. The power was considered appropriate if the degree of independence exceeded 0.9. Then, coexpression networks (modules) were constructed in the WGCNA package with a minimum module size of 30. Each module was assigned a unique color.
In WGCNA, the module eigengene was the first principal component of the expression matrix for a module. The module eigengene was considered an average gene expression value for genes in a module. Phenotype was converted to a numerical value, and regression was performed between the module eigengene values and the phenotype. Module membership (MM) was defined as the association between a gene and its module, and gene significance (GS) was defined as the correlation of a gene with a phenotype. Genes with GS > 0.2 and MM > 0.8 were considered to be hub genes in the module.
Functional Enrichment
Enrichment for gene ontology (GO) functions and Kyoto Encyclopedia of Genes and Genomes (KEGG) pathways was analyzed using the clusterProfiler package in R.Citation24 Enrichment was considered significant if P < 0.05. The GSEA program (version 2.2.4 in Java) and default parameters were used to screen for GO terms and KEGG pathways that may be related to AD or vascular dementia.Citation25,Citation26 The reference gene sets were c5.bp.v6.2.symbols.gmt and c2.cp.kegg.v6.2. symbols.gmt in the MsigDB V6.2 database.Citation27
Construction of the Protein–Protein Interaction (PPI) Network
Based on the interactions of human transcription factors (TFs) with their target genes in the TRRUST v2 database,Citation28 the hypergeometric test was used to identify TFs that may regulate functional modules. In order to predict complex cellular functions, a PPI was constructed using Cytoscape (http://cytoscape.org/) and the STRING database.Citation29,Citation30
Prediction of Structural Domain Combination
TFs were docked onto potential target genes using hex software (version 8.0.0).Citation31 Results were visualized using PyMOL.Citation32
Definition of an Index to Differentiate AD and Vascular Dementia
The least absolute shrinkage and selection operator (LASSO) is effective at selecting features from high-dimensional data that can be used to make classifications.Citation33,Citation34 Firstly, GSE122063 data set was randomly assigned to the training set (70%) and test set (30%). We used the cv.glmnet function from glmnet package (https://CRAN.R-project.org/package=glmnet) to select the optimal genes with non-zero coefficients, which were entered into a LASSO model to differentiate among patients with AD, patients with vascular dementia and non-demented controls. The two main parameters are “nfolds = 10” representing 10-fold cross-validation, and “family = ‘binomial’” representing two-class logistic regression analysis. A model index for each sample was created by weighting the expression values of the selected genes by the regression coefficients from LASSO:
Index = (expression value × coefficient)gene 1 + (expression value × coefficient)gene 2 + (expression value × coefficient)gene 3 …
The ability of the LASSO model to identify AD or vascular dementia was assessed by receiver operating characteristic curve analysis using the pROC package in R.Citation35
Results
DEGs and Modules Associated with AD or Vascular Dementia
In the data set GSE122063, 8537 DEGs between AD patients and controls were identified, of which 2827 were up-regulated and 3800 were down-regulated in AD. There were 5833 DEGs between patients with vascular dementia and controls, of which 1849 were up-regulated and 2131 were down-regulated in the disease. There were 3027 DEGs between patients with AD and vascular dementia, of which 521 were up-regulated and 1003 were down-regulated in AD. There were 7330 DEGs between AD patients, on one hand, and vascular dementia patients and controls, on the other, of which 2182 were up-regulated and 3097 were down-regulated in AD ().
Figure 2 Differentially expressed gene (DEG) analysis and Weighted Gene Co-Expression Network Analysis. (A) Manhattan map of differential gene expression. (B) Definition of power related to modules. (C) Recognition module. (D) The brown module positively correlated with both AD and vascular dementia, the blue module negatively correlated with vascular dementia, and the turquoise module negatively correlated with AD. The grey module did not correlate with either type of dementia. (E) Module membership and gene significance strongly correlated with each other within each module.
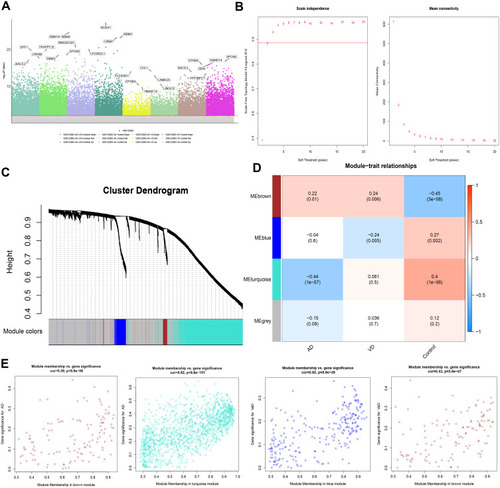
To identify the key module most associated with AD, WGCNA was performed based on the DEG expression profile. The lowest power that gave independence larger than 0.90 was 0.885 (). Four modules were identified (). The brown module positively correlated with AD (correlation coefficient = 0.22, P = 0.01) and vascular dementia (correlation coefficient = 0.24, P = 0.006). The blue module negatively correlated with vascular dementia (correlation coefficient = −0.24, P = 0.005), while the turquoise module negatively correlated with AD (correlation coefficient = −0.44, P = 1 x 10⁻⁷; ). In the brown module, the following 11 genes were identified as up-regulated hub genes in AD and vascular dementia: SLAMF8, C1QB, MS4A6A, C1QC, MS4A4A, SAMSN1, CCR5, STAB1, SLC7A7, EBI3, and ITGB2. In the blue module, six genes were identified as down-regulated hub genes in vascular dementia: DOCK3, WDTC1, IDUA, FBXL19, ARMC6, and CREB3L1. In the turquoise module, 129 genes were identified as down-regulated hub genes in AD (Table S1). Correlation analysis confirmed that hub genes in the brown module were strongly associated with AD and vascular dementia; hub genes in the blue module, with vascular dementia; and hub genes in the turquoise module, with AD ().
The Global Regulatory Landscape of AD and Vascular Dementia
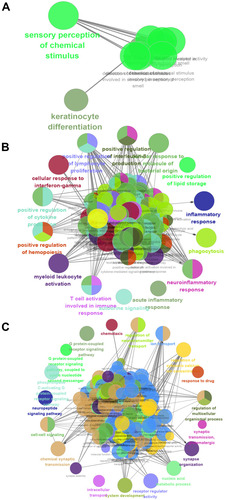
Analysis of function enrichment showed that blue module genes were significantly involved in biological processes related to cell proliferation, such as cell proliferation in the midbrain and negative regulation of apoptosis in development, and in biological processes related to abnormal cortisol and lipid metabolism, such as cortisol synthesis and secretion as well as Cushing syndrome (). Brown module genes were involved in immune-related biological processes, including regulation of innate immune response, T cell activation, regulation of inflammatory response, cellular responses to interferon-g, chemokine signaling, interaction of cytokines with their receptors, and signaling involving Toll-like receptors (). Turquoise module genes were significantly enriched in biological processes regulating neurotransmitter transport, synapse organization, neurotransmitter secretion, neuropeptide signaling, insulin secretion, MAPK signaling, and cholinergic synapse transmission (). ClueGo enrichment analysis confirmed that the main biological processes enriched in the blue module were sensory perception of chemical stimuli and keratinocyte differentiation. The enriched processes in the brown module were cell activation involved in immune responses, cellular responses to interferon-g, neuroinflammatory response, and inflammatory response. The enriched processes in the turquoise module were mainly receptor regulator activity, synapse organization, regulation of neurotransmitter transport, and neuropeptide signaling (–).
Figure 3 Results of functional enrichment. (A) Biological processes involving genes of the blue module. (B) KEGG pathways involving genes of the blue module. (C) Biological processes involving genes of the brown module. (D) KEGG pathways involving genes of the brown module. (E) Biological processes involving genes of the turquoise module. (F) KEGG pathways involving genes of the turquoise module.
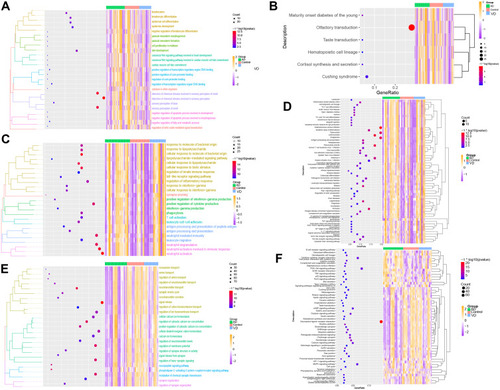
Figure 4 Enrichment analysis using ClueGo. Biological processes significantly enriched in the (A) blue, (B) brown or (C) turquoise modules.
Validation of Biological Processes and Key Pathways in AD and Vascular Dementia
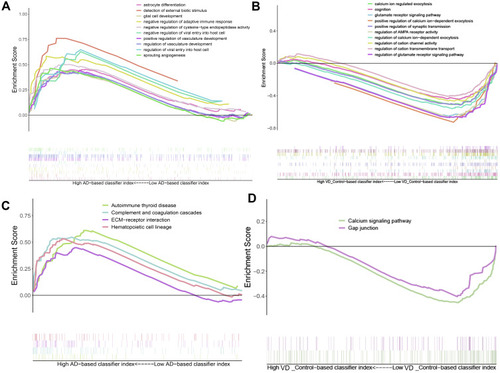
Gene Set Enrichment Analysis (GSEA) showed that biological processes such as astrocyte differentiation glial cell development, negative regulation of adaptive immune response, etc. are significantly enriched in AD (). Biological processes such as calcium ion regulate exocytosis, cognition, glutamate receptor signaling pathway, positive regulation of synaptic transmission were significantly enriched in vascular dementia (). Key pathways in AD were complement and coagulation cascades, interaction between extracellular matrix and receptors, and hematopoietic cell lineage (); key pathways in vascular dementia involved calcium signaling and gap junctions ().
Figure 5 Result of gene set enrichment analysis. (A) Biological processes enriched in AD. (B) Biological processes enriched in vascular dementia. (C) KEGG pathways enriched in AD. (D) KEGG pathways enriched in vascular dementia.
Altered Expression of Hub Genes in Both AD and Vascular Dementia
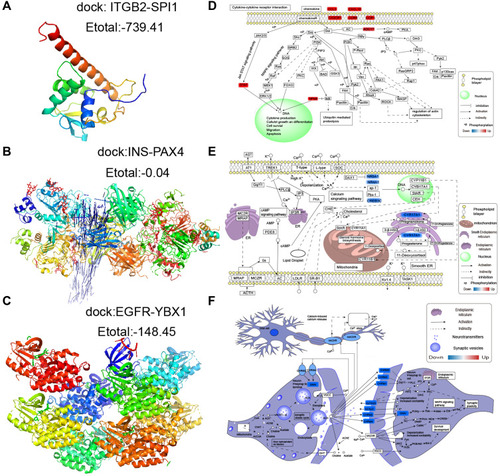
Using the STRING database, we extracted the genes from modules and assembled them into a global regulatory network based on the pathways in which those genes were significantly involved (). TFs regulating the pathways were extracted, and correlations between TFs and pathway genes were further analyzed (–). Docking studies of TFs with target genes suggested that the TF SPI1 and target ITGB2, the TF YBX1 and EGFR as well as the TF PAX4 and INS have negative docking energies (–). Finally, we explored how different modules may contribute to AD or vascular dementia (–).
Figure 6 Integrated regulation of AD or vascular dementia by maladjustment of hub gene expression of modules. (A) Integrated regulatory network of gene pathways. (B–D) Maps of gene-pathway correlations in the (B) blue, (C) brown, or (D) turquoise module.
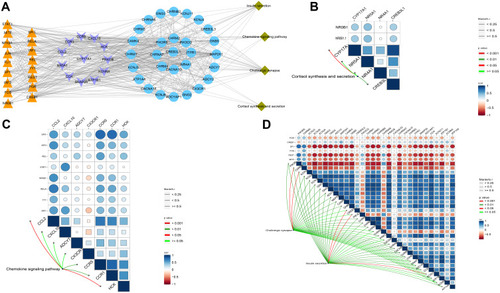
Figure 7 Potential transcription factor-target gene interactions in AD and vascular dementia. (A) Docking of ITGB2 and the transcription factor SPI1. (B) Docking of EGFR and the transcription factor YBX1. (C) Docking of INS and the transcription factor PAX4. (D–F) Potential regulation of genes in the (D) brown, (E) blue or (F) turquoise modules. Up-regulated genes are red; down-regulated genes, blue.
LASSO Can Predict AD and Vascular Dementia
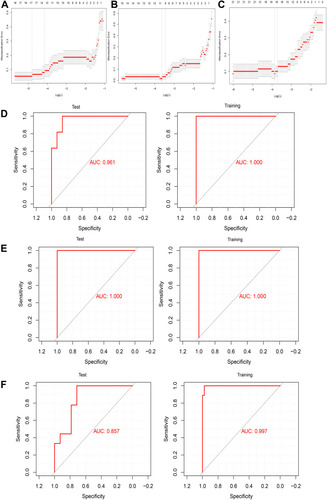
We extracted the expression profile of hub genes to construct a LASSO model (–), in which 146 genes in three modules were found to have non-zero regression coefficients. The model was able to differentiate AD patients from controls with an area under the receiver operating characteristic curve (AUC) of 0.961 in the training set and 1.000 in the test set. Similarly, the index was able to distinguish between vascular patients and controls with an AUC of 1.000 in the training set and 1.000 in the test set. Finally, the index was able to distinguish between patients with AD or vascular dementia with an AUC of 0.857 in the training set and 0.997 in the test set (–). These results suggest the index may be a biomarker of AD and vascular dementia and may even differentiate the two diseases from each other.
Figure 8 Assessment of models for identifying AD and vascular dementia. (A–C) LASSO model. (D–F) Receiver operating characteristic curves for differentiating (D) AD patients and non-demented controls, (E) vascular dementia patients and non-demented controls, or (F) patients with AD or vascular dementia. AUC, area under the curve.
Discussion
AD and vascular dementia are the two most common forms of dementia and place a heavy burden on many families. Despite decades of research, no specific treatments for dementia have been described. In this study, WGCNA identified nine gene modules, among which the brown module positively correlated with the development of both forms of dementia. The brown module mainly involves immune-related biological processes and pathways, such as the innate immune response, T cell activation, inflammatory response regulation, chemokine signaling, interaction between cytokines and their receptors, and Toll-like receptor signaling. These indicated the dysfunction of immune progress may be the similar molecular mechanisms underlying ADCitation36 and vascular dementia. The blue module negatively correlated with the development of vascular dementia, and the turquoise module negatively correlated with the development of AD. These results suggest that AD and vascular dementia result from different dysfunctional gene modules, and the underlying mechanisms of AD and vascular dementia are different. For instance, the blue module involves in NF-kappa B signaling pathway, toll-like receptor signaling pathway, and NOD-like receptor signaling pathway. NF-KB and activator protein 1 (AP1) are modulated by activated toll-like receptor (TLR)-mediated recruiting of adaptor proteins.Citation37 The turquoise module involved in MAPK signaling pathway, insulin signaling, and HIF-1 signaling pathway. Unsurprisingly, all these pathways were reported associated with dementia.Citation38–Citation42 Our results indicated that these pathways show different activities in AD and vascular dementia.
In this study, 146 genes were identified as hub genes. We extracted TFs from each module and constructed a global regulatory network of TF-hub genes-pathways. Through this network, we analyzed how TFs may regulate pathway genes directly or indirectly. Some pathways identified here have already been associated with AD or vascular dementia. In previously, a study identified blood-cell-derived molecular signatures and potential therapeutic targets through integrated analysis in two AD-related data set.Citation43 Another study identified molecular signatures and therapeutic agents in Alzheimer’s disease using a network-based approach.Citation44 A previous study revealed biomarkers and pathways shared by AD and ischemic Stroke.Citation45 The dysfunction of cell adhesion molecules, purine metabolism, intracellular transmembrane protein transport, immune system, and cholesterol metabolism contributes to AD according to the previous genome-wide association study.Citation36,Citation46–Citation49 Compared with these studies, some related pathways were also found in our present study. We also proposed the shared pathways and potentially different pathways between AD and VaD and constructed a potential transcriptional regulatory network.
Mutations in chemokine receptors can increase the risk of AD and accelerate its progression,Citation15 and the chemokine CCL2. Consistent with this literature, we found here that the chemokine pathway positively correlated with the development of AD and vascular dementia. We also found an association between AD and changes in cholinergic synapse transmission. This is consistent with studies that attributed inflammation-related cognitive decline mainly to the degeneration of central cholinergic neurons, altering expression of genes such as those encoding muscarinic and nicotinic receptors. This leads to reduced synthesis and release of acetylcholine and can trigger intracellular signal transduction disorders. Cholinergic dysfunction is often accompanied by the formation and deposition of Aβ, which is a hallmark of AD.Citation13
Analysis of our blue module revealed an association of cortisol synthesis and secretion with vascular dementia. This is consistent with previous reports that suggest that neurosteroids regulate cognitive function. Both AD and vascular dementia can dysregulate the adrenocortical axis.Citation50
A LASSO model based on 146 genes with non-zero regression coefficients was able to distinguish AD or vascular dementia from non-dementia controls with extremely high AUCs. It may be an effective biological index to identify the types of dementia.
Our study shows that bioinformatics analysis can make predictions about the molecular pathways behind AD and vascular dementia and thereby generate testable hypotheses for future experiments in vitro and in preclinical models.
Conclusion
The pathogenesis of AD may involve down-regulation of genes involved in cholinergic synapse transmission, while that of vascular dementia may be more closely related to down-regulation of cortisol metabolism and secretion. The chemokine pathway may be quite dysregulated in both types of dementia. A LASSO model based on hub genes of different modules may be useful for diagnosing the two diseases.
Data Sharing Statement
The raw analyses from this study and codes can be obtained from the corresponding author upon reasonable request.
Author Contributions
FKZ, DYC, GYC, DHZ and XFL conceived and designed the study. All authors contributed to data analysis, drafting or revising the article, have agreed on the journal to which the article will be submitted, gave final approval of the version to be published, and agree to be accountable for all aspects of the work.
Disclosure
The authors declare that this research was conducted in the absence of any commercial or financial relationships that could be construed as a potential conflict of interest.
References
- Calsolaro V, Edison P. Neuroinflammation in Alzheimer’s disease: current evidence and future directions. Alzheimers Dement. 2016;12(6):719–732. doi:10.1016/j.jalz.2016.02.01027179961
- Zou D, Li R, Huang X, et al. Identification of molecular correlations of RBM8A with autophagy in Alzheimer’s disease. Aging. 2019;11(23):11673–11685. doi:10.18632/aging.10257131816601
- Bose S, Cho J. Role of chemokine CCL2 and its receptor CCR2 in neurodegenerative diseases. Arch Pharm Res. 2013;36(9):1039–1050. doi:10.1007/s12272-013-0161-z23771498
- Hardy J, Selkoe DJ. The amyloid hypothesis of Alzheimer’s disease: progress and problems on the road to therapeutics. Science. 2002;297(5580):353–356. doi:10.1126/science.107299412130773
- Jian C, Lu M, Zhang Z, et al. miR-34a knockout attenuates cognitive deficits in APP/PS1 mice through inhibition of the amyloidogenic processing of APP. Life Sci. 2017;182:104–111.28533191
- Zhu JB, Tan CC, Tan L, Yu JT. State of Play in Alzheimer’s Disease Genetics. J Alzheimers Dis. 2017;58(3):631–659.28505974
- Zou C, Wang J, Huang X, Jian C, Zou D, Li X. Analysis of transcription factor- and ncRNA-mediated potential pathogenic gene modules in Alzheimer’s disease. Aging. 2019;11(16):6109–6119.31422384
- Zou D, Liu C, Zhang Q, et al. Association between polymorphisms in microRNAs and ischemic stroke in an Asian population: evidence based on 6083 cases and 7248 controls. Clin Interv Aging. 2018;13:1709–1726.30254431
- Zekry D, Duyckaerts C, Hauw JJ. Démences vasculaires et démences mixtesVascular dementia and mixed dementia. [Vascular dementia and mixed dementia]. Presse Med. 2007;36(10 Pt 2):1469–1476. French.17553655
- Bennett D. Public health importance of vascular dementia and Alzheimer’s disease with cerebrovascular disease. Int J Clin Pract Suppl. 2001;1(120):41–48.
- Roman G. Diagnosis of vascular dementia and Alzheimer’s disease. Int J Clin Pract Suppl. 2001;1(120):9–13.
- Otsuka M, Yamaguchi K, Ueki A. Similarities and differences between Alzheimer’s disease and vascular dementia from the viewpoint of nutrition. Ann N Y Acad Sci. 2002;977(1):155–161. doi:10.1111/j.1749-6632.2002.tb04811.x12480746
- Schliebs R, Arendt T. The cholinergic system in aging and neuronal degeneration. Behav Brain Res. 2011;221(2):555–563. doi:10.1016/j.bbr.2010.11.05821145918
- Heneka MT, Carson MJ, El Khoury J, et al. Neuroinflammation in Alzheimer’s disease. Lancet Neurol. 2015;14(4):388–405.25792098
- Kauwe JS, Bailey MH, Ridge PG, et al. Genome-wide association study of CSF levels of 59 Alzheimer’s disease candidate proteins: significant associations with proteins involved in amyloid processing and inflammation. PLoS Genet. 2014;10(10):e1004758. doi:10.1371/journal.pgen.100475825340798
- Semple BD, Kossmann T, Morganti-Kossmann MC. Role of chemokines in CNS health and pathology: a focus on the CCL2/CCR2 and CXCL8/CXCR2 networks. J Cereb Blood Flow Metab. 2010;30(3):459–473. doi:10.1038/jcbfm.2009.24019904283
- Sokolova A, Hill MD, Rahimi F, Warden LA, Halliday GM, Shepherd CE. Monocyte chemoattractant protein-1 plays a dominant role in the chronic inflammation observed in Alzheimer’s disease. Brain Pathol. 2009;19(3):392–398. doi:10.1111/j.1750-3639.2008.00188.x18637012
- Old EA, Malcangio M. Chemokine mediated neuron-glia communication and aberrant signalling in neuropathic pain states. Curr Opin Pharmacol. 2012;12(1):67–73. doi:10.1016/j.coph.2011.10.01522056024
- Hartlage-Rubsamen M, Waniek A, Meissner J, et al. Isoglutaminyl cyclase contributes to CCL2-driven neuroinflammation in Alzheimer’s disease. Acta Neuropathol. 2015;129(4):565–583. doi:10.1007/s00401-015-1395-225666182
- McGeer EG, McGeer PL. Neuroinflammation in Alzheimer’s disease and mild cognitive impairment: a field in its infancy. J Alzheimers Dis. 2010;19(1):355–361. doi:10.3233/JAD-2010-121920061650
- Westin K, Buchhave P, Nielsen H, Minthon L, Janciauskiene S, Hansson O. CCL2 is associated with a faster rate of cognitive decline during early stages of Alzheimer’s disease. PLoS One. 2012;7(1):e30525. doi:10.1371/journal.pone.003052522303443
- Ritchie ME, Phipson B, Wu D, et al. limma powers differential expression analyses for RNA-sequencing and microarray studies. Nucleic Acids Res. 2015;43(7):e47. doi:10.1093/nar/gkv00725605792
- Langfelder P, Horvath S. WGCNA: an R package for weighted correlation network analysis. BMC Bioinform. 2008;9(1):559. doi:10.1186/1471-2105-9-559
- Yu G, Wang LG, Han Y, He QY. clusterProfiler: an R package for comparing biological themes among gene clusters. OMICS. 2012;16(5):284–287. doi:10.1089/omi.2011.011822455463
- Mootha VK, Lindgren CM, Eriksson KF, et al. PGC-1alpha-responsive genes involved in oxidative phosphorylation are coordinately downregulated in human diabetes. Nat Genet. 2003;34(3):267–273. doi:10.1038/ng118012808457
- Subramanian A, Tamayo P, Mootha VK, et al. Gene set enrichment analysis: a knowledge-based approach for interpreting genome-wide expression profiles. Proc Natl Acad Sci U S A. 2005;102(43):15545–15550. doi:10.1073/pnas.050658010216199517
- Liberzon A, Birger C, Thorvaldsdottir H, Ghandi M, Mesirov JP, Tamayo P. The Molecular Signatures Database (MSigDB) hallmark gene set collection. Cell Syst. 2015;1(6):417–425. doi:10.1016/j.cels.2015.12.00426771021
- Han H, Cho JW, Lee S, et al. TRRUST v2: an expanded reference database of human and mouse transcriptional regulatory interactions. Nucleic Acids Res. 2018;46(D1):D380–D386. doi:10.1093/nar/gkx101329087512
- Shannon P, Markiel A, Ozier O, et al. Cytoscape: a software environment for integrated models of biomolecular interaction networks. Genome Res. 2003;13(11):2498–2504. doi:10.1101/gr.123930314597658
- Szklarczyk D, Morris JH, Cook H, et al. The STRING database in 2017: quality-controlled protein-protein association networks, made broadly accessible. Nucleic Acids Res. 2017;45(D1):D362–D368. doi:10.1093/nar/gkw93727924014
- Macindoe G, Mavridis L, Venkatraman V, Devignes MD, Ritchie DW. HexServer: an FFT-based protein docking server powered by graphics processors. Nucleic Acids Res. 2010;38(WebServer issue):W445–449. doi:10.1093/nar/gkq31120444869
- Mooers BHM. Shortcuts for faster image creation in PyMOL. Protein Sci. 2020;29(1):268–276. doi:10.1002/pro.378131710740
- Lopez-Sanz D, Bruna R, Delgado-Losada ML, et al. Electrophysiological brain signatures for the classification of subjective cognitive decline: towards an individual detection in the preclinical stages of dementia. Alzheimers Res Ther. 2019;11(1):49. doi:10.1186/s13195-019-0502-331151467
- Serra A, Onlu S, Coretto P, Greco D. An integrated quantitative structure and mechanism of action-activity relationship model of human serum albumin binding. J Cheminform. 2019;11(1):38. doi:10.1186/s13321-019-0359-231172382
- Robin X, Turck N, Hainard A, et al. pROC: an open-source package for R and S+ to analyze and compare ROC curves. BMC Bioinform. 2011;12(1):77. doi:10.1186/1471-2105-12-77
- Lambert JC, Grenier-Boley B, Chouraki V, et al. Implication of the immune system in Alzheimer’s disease: evidence from genome-wide pathway analysis. J Alzheimers Dis. 2010;20(4):1107–1118. doi:10.3233/JAD-2010-10001820413860
- Kawai T, Akira S. Signaling to NF-kappaB by Toll-like receptors. Trends Mol Med. 2007;13(11):460–469. doi:10.1016/j.molmed.2007.09.00218029230
- Chami B, Steel AJ, De La Monte SM, Sutherland GT. The rise and fall of insulin signaling in Alzheimer’s disease. Metab Brain Dis. 2016;31(3):497–515.26883429
- Hanke ML, Kielian T. Toll-like receptors in health and disease in the brain: mechanisms and therapeutic potential. Clin Sci. 2011;121(9):367–387. doi:10.1042/CS20110164
- Munoz L, Ammit AJ. Targeting p38 MAPK pathway for the treatment of Alzheimer’s disease. Neuropharmacology. 2010;58(3):561–568. doi:10.1016/j.neuropharm.2009.11.01019951717
- Ogunshola OO, Antoniou X. Contribution of hypoxia to Alzheimer’s disease: is HIF-1α a mediator of neurodegeneration? Cell Mol Life Sci. 2009;66(22):3555–3563. doi:10.1007/s00018-009-0141-019763399
- Seo EJ, Fischer N, Efferth T. Phytochemicals as inhibitors of NF-kappaB for treatment of Alzheimer’s disease. Pharmacol Res. 2018;129:262–273.29179999
- Rahman MR, Islam T, Zaman T, et al. Identification of molecular signatures and pathways to identify novel therapeutic targets in Alzheimer’s disease: insights from a systems biomedicine perspective. Genomics. 2020;112(2):1290–1299.31377428
- Rahman MR, Islam T, Turanli B, et al. Network-based approach to identify molecular signatures and therapeutic agents in Alzheimer’s disease. Comput Biol Chem. 2019;78:431–439.30606694
- Rahman MR, Islam T, Shahjaman M, et al. Discovering Biomarkers and Pathways Shared by Alzheimer’s Disease and Ischemic Stroke to Identify Novel Therapeutic Targets. Medicina. 2019;55:5.
- Hong MG, Alexeyenko A, Lambert JC, Amouyel P, Prince JA. Genome-wide pathway analysis implicates intracellular transmembrane protein transport in Alzheimer disease. J Hum Genet. 2010;55(10):707–709.20668461
- Jones L, Holmans PA, Hamshere ML, et al. Genetic evidence implicates the immune system and cholesterol metabolism in the aetiology of Alzheimer’s disease. PLoS One. 2010;5(11):e13950.21085570
- Liu G, Jiang Y, Wang P, et al. Cell adhesion molecules contribute to Alzheimer’s disease: multiple pathway analyses of two genome-wide association studies. J Neurochem. 2012;120(1):190–198.22017384
- Xiang Z, Xu M, Liao M, et al. Integrating Genome-Wide Association Study and Brain Expression Data Highlights Cell Adhesion Molecules and Purine Metabolism in Alzheimer’s Disease. Mol Neurobiol. 2015;52(1):514–521.25204495
- Bernardi F, Lanzone A, Cento RM, et al. Allopregnanolone and dehydroepiandrosterone response to corticotropin-releasing factor in patients suffering from Alzheimer’s disease and vascular dementia. Eur J Endocrinol. 2000;142(5):466–471.10802523