
Abstract
Purpose
Mid-upper arm circumference (MUAC) is a simple, noninvasive anthropometric indicator. This study evaluated the applicability of MUAC as an alternative screening instrument to appendicular skeletal muscle mass index (ASMI) for detecting sarcopenia, and determined the optimal MUAC cutoff values.
Patients and Methods
A total of 4509 subjects ≥50 years of age from the West China Health and Aging Trend study were included in the present study. ASM was measured by bioelectrical impedance analysis. MUAC, calf circumference (CC), and grip strength were evaluated and the Short Physical Performance Battery and 3-m timed up-and-go test were administered. Low muscle mass was diagnosed based on Asian Working Group for Sarcopenia 2019 (AWGS2019) and updated European Working Group on Sarcopenia in Older People 2 (EWGSOP2) criteria.
Results
ASMI was positively correlated with MUAC in both men (r=0.726, P<0.001) and women (r=0.698, P<0.001). The area under the receiver operating characteristic curve (AUC) for MUAC as an indicator of low muscle mass in men and women was 0.86 (95% confidence interval [CI]: 0.85–0.88) and 0.85 (95% CI: 0.84–0.86), respectively, according to AWGS2019 criteria; and 0.86 (95% CI: 0.85–0.88) and 0.86 (95% CI: 0.85–0.88), respectively, according to EWGSOP2 criteria. Optimal MUAC cutoff values for predicting low muscle mass were ≤28.6 cm for men and ≤27.5 cm for women. There was no significant difference between the AUCs of MUAC and CC in men according to the 2 reference standards (P=0.809), whereas the AUC of CC was superior to that of MUAC in women according to AWGS2019 (P<0.001) and EWGSOP2 (P=0.008) criteria.
Conclusion
MUAC is strongly correlated with ASMI among community-dwelling middle-aged and older adults in China. MUAC can be used as a simple screening instrument to ASMI for diagnosing sarcopenia, especially in men.
Introduction
Sarcopenia is an age-related skeletal muscle disorder characterized by decreases in muscle mass, strength, and function, which has multiple adverse health consequences and significant personal, social, and economic costs.Citation1 A previous study found that sarcopenia at admission was independently associated with 5-fold higher risk of increased hospital costs in older adults.Citation2 With the aging of the world’s population, sarcopenia is likely to become a much more serious public health concern in the future. As such, it is critical to identify and prevent this condition as early as possible to alleviate the burden on public health resources.
Low muscle mass is an essential parameter in the diagnosis of sarcopenia. Given the high equipment costs, risk of radiation exposure, and limited accessibility of currently recommended diagnostic modalities for low muscle mass including dual-energy X-ray absorptiometry (DXA), computed tomography (CT), magnetic resonance imaging (MRI), and bioelectrical impedance analysis (BIA), developing simple screening tools is important for the early identification of sarcopenia, especially in communities or primary care settings. The currently recommended screening tools of sarcopenia include anthropometric measures, case-finding questionnaires and other score charts.Citation3,Citation4 A recent study from Taiwan found that of the 4 standard screening instruments—namely, calf circumference (CC); the Strength, Assistance Walking, Rise from a Chair, Climb Stairs, and Falls (SARC-F) and SARC-F combined with CC (SARC-CalF) questionnaires; and Mini Sarcopenia Risk Assessment 5, CC was the ideal choice for ethnic Chinese older adults in assisted-living situations.Citation5 Another study of community-dwelling Chinese older adults also showed that CC was superior to SARC-F and SARC-CalF for predicting sarcopenia.Citation6 CC, an easy-to-use anthropometric indicator, is associated with appendicular skeletal muscle mass (ASM), and can serve as a surrogate marker of muscle mass for diagnosing sarcopenia.Citation7–Citation9 An international survey conducted in 55 countries found that CC was the most commonly used metric to assess muscle mass in clinical practice.Citation10 Although anthropometric indices can facilitate sarcopenia screening, more detailed studies are needed to validate their clinical utility.Citation11,Citation12
Mid-upper arm circumference (MUAC) is another simple and noninvasive anthropometric indicator often included in geriatric health measurement scales to assess nutritional status, and reflects the amount of muscle mass and subcutaneous fat. A number of studies have demonstrated that low MUAC is associated with an increased risk of all-cause mortality in older adults.Citation13–Citation15 Mid-arm muscle circumference (MAMC), that is, MUAC corrected by triceps skinfold thickness, was strongly correlated with DXA-assessed lean body mass.Citation16 Additionally, MUAC and corrected MUAC were inversely associated with sarcopenia and could be used as alternative indicators to identify sarcopenia in community-dwelling older adults in Brazil.Citation17,Citation18 However, the accuracy of MUAC to predict ASM index (ASMI) among Chinese community-dwelling older adults is unclear.
Given that MUAC is comparable to CC in nutritional assessments while being less susceptible to the fluid changes or limb amputations that often occur in older adults, we speculated that MUAC can be used as a surrogate marker for low muscle mass in diagnosing sarcopenia. To test this hypothesis, we carried out the present study with the following aims: 1) to examine the relationship between MUAC and BIA-assessed muscle mass; 2) to evaluate the applicability of MUAC as an alternative screening instrument to ASMI and determine the optimal cutoff values; and 3) to assess the accuracy of MUAC and CC for diagnosing sarcopenia using baseline data from the West China Health and Aging Trend (WCHAT) study.
Patients and Methods
Study Design and Participants
The study subjects were community-dwelling individuals ≥50 years old who participated in WCHAT, an ongoing longitudinal multi-center prospective study with 7536 participants recruited from July to December in 2018 that is assessing the health and aging status of 18 ethnic groups in China’s Sichuan, Yunnan, Guizhou, and Xinjiang provinces. Multi-stage cluster sampling was applied, and the total response rate was 50.2%.Citation19,Citation20 We excluded individuals for whom an MUAC or CC measurement was unavailable (n=759) and those with missing BIA data (n=2268). Ultimately, 4509 subjects were included in our analysis. This study was registered in the Chinese Clinical Trial Registry (registration no. ChiCTR1800018895) and was approved by the Ethics Committee of West China Hospital, Sichuan University (approval no. 2017–445). Written informed consent was obtained from all participants and/or their proxy respondents.
Anthropometric Measurements
Anthropometric indicators included weight, height, MUAC, and CC; these were measured by investigators trained in standardized measurement methods. Body mass index (BMI) was calculated as body weight divided by the square of height (kg/m2). Body circumference measurement was performed using an inelastic but flexible measuring tape without compressing the skin.Citation21 MUAC was measured with the subject in a stand position. The midpoint of the participant’s upper arm (located between the acromion and olecranon) was marked when the subject’s elbow bent to a 90° angle. Then, the observer wrapped the measuring tape around the marked midpoint with the participants’ arm hung down naturally. CC was measured with the subject in a relaxed and seated position and the knee and ankle bent at 90°. Observer moved the measuring tape up and down to locate the maximum horizontal distance around the calf. MUAC and CC were in centimeters to the nearest decimal place and the average of two measurements of the dominant side was used in the analysis.
Muscle Mass Measurements and Muscle Strength Assessments
ASM was assessed by segmental multifrequency bioelectrical impedance analysis device (Inbody 770; BioSpace, Seoul, Korea), which was proved to be a reliable body composition assessment device and widely used in the diagnosis of sarcopenia.Citation22–Citation24 ASMI was calculated as ASM divided by the square of height. Subjects were asked to stand on the test equipment in a normal posture with their upper arms straight and expose their fingers and heels directly to the electrodes. To ensure safety and accuracy, subjects with pacemakers or severe edema did not participate in this test. Low muscle mass was identified based on European Working Group on Sarcopenia in Older People 2 (EWGSOP2) criteria (<7.0 kg/m2 for men and < 5.5 kg/m2 for women) and Asian Working Group for Sarcopenia 2019 (AWGS2019) criteria (<7.0 kg/m2 for men and <5.7 kg/m2 for women).Citation3,Citation4 Muscle strength in the dominant hand was measured using a grip strength dynamometer (EH101; Camry, Zhongshan, China). The higher value from two independent tests was recorded as hand grip strength.
Physical Performance Assessments
Physical performance was measured with the Short Physical Performance Battery (SPPB) (www.sralab.org/rehabilitation-measures) and 3-m timed up-and-go (TUG) test. The SPPB consisted of a short walk (4 m), 5 repeated chair-stands, and balance assessments including side-by-side, semi-tandem, and tandem positions.Citation25 Each item was scored between 0 and 4, with the total score ranging from 0 to 12. Gait speed was measured by asking participants to walk a 4-m course at their usual pace. The time taken was recorded by an infrared sensor device, and the acceleration phase was excluded. For the chair stands, participants were timed while performing 5 repeats of standing up from/sitting down on a chair as quickly as possible. For the 3-m TUG test, subjects were asked to stand up from a chair without armrests and walk a distance of 3 m, then turn around at a sign, return to the chair, and sit down as quickly as possible.
Statistical Analysis
Continuous data are presented as mean ± standard deviation or median and interquartile range as appropriate. Differences between groups were evaluated with the unpaired t test and Mann–Whitney U-test for continuous data with a normal and non-normal distribution, respectively. Pearson’s correlation coefficient was used to evaluate the relationship between MUAC and ASMI or grip strength in men and women.
Receiver operating characteristic (ROC) curve analysis was carried out to evaluate the utility of MUAC for identifying low muscle mass based on the area under the ROC curve (AUC) and 95% confidence interval (CI). Because of the different cutoff values of low muscle mass between men and women, the results were stratified by sex; the diagnostic performance was determined based on the Youden index (sensitivity + specificity − 1).Citation26 The sensitivity, specificity, and positive and negative likelihood ratios of optimal cutoff points were calculated. We also compared the overall accuracy of MUAC and CC using the DeLong method.Citation27 Based on the optimal MUAC cutoff values, we compared the accuracy of MUAC and CC for diagnosing sarcopenia and severe sarcopenia according to AWGS2019 criteria.
Statistical analyses were performed with Stata v15.1 (Stata Corp, College Station, TX, USA) and MedCalc v15.2 (MedCalc Software, Ostend, Belgium) software programs. Two-sided P values <0.05 were considered statistically significant.
Results
Study Population
The study population included 1615 men and 2894 women; the median age (range) was 64 (57–70) and 61 (55–67) years, respectively. The prevalence of low muscle mass according to AWGS2019 criteria was 29.60% in men and 22.39% in women. Compared to normal participants, individuals with low muscle mass were significantly older and had lower anthropometric indicators including weight, height, BMI, CC, and MUAC. Participants with low muscle mass also had lower grip strength and worse physical performance as evidenced by slower gait speed, longer TUG time, and lower SPPB scores ().
Table 1 Baseline Characteristics of Study Participants (N = 4509)
MUAC as an Indicator of Low Muscle Mass
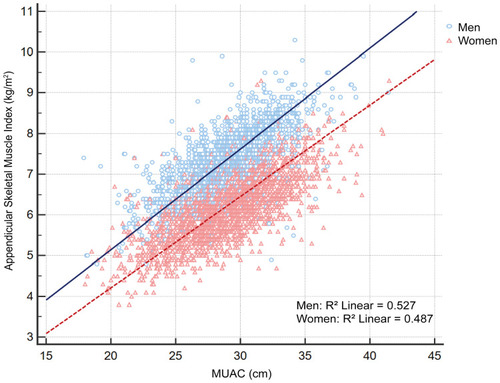
MUAC was positively correlated with ASMI (r = 0.726 in men, r = 0.698 in women, P < 0.001) () and grip strength (r = 0.288 in men, r = 0.222 in women, P < 0.001) (Supplementary Figure 1). In the ROC curve analysis of MUAC, the AUC for low muscle mass in men and women was 0.86 (95% CI: 0.85–0.88) and 0.85 (95% CI: 0.84–0.86), respectively, using AWGS2019 criteria and 0.86 (95% CI: 0.85–0.88) and 0.86 (95% CI: 0.85–0.88), respectively, using EWGSOP2 criteria as the reference standard (Supplementary Figure 2). Based on the Youden index, we calculated the MUAC cutoff values for identifying low muscle mass as ≤28.6 cm for men and ≤27.5 cm for women and the CC cutoff values for identifying low muscle mass as ≤34.1 cm for men and ≤33 cm for women. The results of the sensitivity and specificity analyses for using MUAC to identify AWGS2019/EWGSOP2-defined low muscle mass are shown in . Using AWGS2019 criteria as the reference standard, the sensitivity and specificity were 87.87% (95% CI: 84.6–90.7%) and 71.24% (95% CI: 68.5–73.9%), respectively, in men and 76.70% (95% CI: 73.2–79.9%) and 77.83% (95% CI: 76.1–79.5%), respectively, in women. Similar results were obtained using the EWGSOP2 criteria.
Table 2 Diagnostic Accuracy for Using MUAC to Predict Low Muscle Mass of Different Criteria
Figure 1 Scatterplots and regression lines reflecting the linear correlations between MUAC and appendicular skeletal muscle mass index (blue circle and solid line for men; red triangle and dotted line for women).
Diagnostic Accuracy of MUAC vs CC
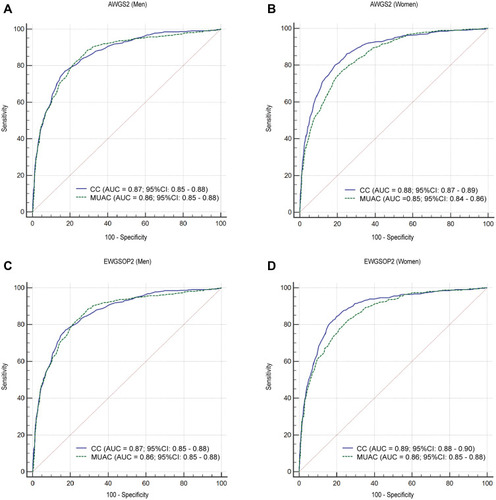
The ROC curves of MUAC and CC against the 2 reference standards of low muscle mass in men and women are shown in . Using the AWGS2019/EWGSOP2 criteria, the AUCs of MUAC and CC in men were 0.86 (95% CI: 0.85‒0.88) and 0.87 (95% CI: 0.85‒0.88), respectively, with no significant difference between the 2 parameters (P=0.809). However, using the AWGS2019 criteria, the AUCs of MUAC and CC in women were 0.85 (95% CI: 0.84‒0.86) and 0.88 (95% CI: 0.87‒0.89), respectively, with the latter showing a superior performance (P<0.001). The same was observed using the EWGSOP2 criteria (MUAC: AUC=0.86 [95% CI: 0.85‒0.88]; CC: AUC=0.89 [95% CI: 0.88‒0.90]; P=0.008).
Figure 2 Receiver operating characteristic curves of MUAC and CC for diagnosing low appendicular skeletal muscle mass index against the AWGS2019 ((A) men, (B) women) and EWGSOP2 ((C) men, (D) women).
shows the sensitivity, specificity, positive and negative likelihood ratios, and AUCs of MUAC and CC for detecting sarcopenia and severe sarcopenia according to AWGS2019 criteria. Compared to the AWGS2019-recommended CC cutoff values (<34 cm for men and <33 cm for women), the optimal cutoff values of MUAC (≤28.6 and ≤27.5, respectively) showed acceptable performance.
Table 3 Diagnostic Accuracy of MUAC and CC for Diagnosing Sarcopenia According to AWGS 2019
Discussion
The results of this study demonstrate a strong correlation between MUAC and ASMI in community-dwelling middle-aged and older adults in China. We also examined the applicability of MUAC as a proxy for ASMI as well as the cutoff values of MUAC for diagnosing sarcopenia. Our results show that MUAC has acceptable accuracy for identifying low skeletal muscle mass, and is thus an easy-to-use alternative screening instrument to ASMI for diagnosing sarcopenia.
MUAC has a long history as a simple and valuable anthropometric marker of malnutrition that is particularly valuable in communities and primary care settings. MUAC measurements are considered as a useful indicator of muscle mass and nutritional status because it is less affected by fluid retention, whereas edema is common in the lower extremities.Citation28 It was reported that MUAC corrected for triceps skinfold thickness was significantly correlated with DXA-measured lean body mass.Citation16 MUAC was shown to be strongly correlated with BIA-measured ASMI, suggesting that it could be used to assess sarcopenia.Citation29 Similarly, we found a strong correlation between MUAC and BIA-assessed ASMI in our cohort that was higher in men than in women. This may be attributable to the higher subcutaneous fat content of women, which may decrease the accuracy of MUAC. Women experience a proportionally greater age-related loss of subcutaneous fat than men;Citation30 whether similar changes in MUAC increase the correlation between MUAC and muscle mass in older women remains to be determined. We also examined the relationship between MUAC and grip strength; although it was weaker than that between MUAC and ASMI, there was a significant positive correlation between the 2 variables, which is in line with previous studies.Citation29,Citation31
In general, AUCs >0.9, 0.7‒0.9, and 0.5‒0.7 indicate high, moderate, and low diagnostic accuracy, respectively.Citation32 In our study, the AUC of MUAC for predicting low muscle mass in men/women according to AWGS2019/EWGSOP2 criteria corresponding to a moderate level of diagnostic accuracy. Interestingly, lower cutoff values of low muscle mass for women according to EWGSOP2 as compared to AWGS2019 resulted in the higher AUC of MUAC. By comparing the AUCs of MUAC and CC, we found that they had similar diagnostic performance, especially in men. Based on the Youden index, the optimal cutoff values of MUAC for BIA-assessed low ASMI were 28.6 cm for men and 27.5 cm for women regardless of the reference standard that was used (EWGSOP2 or AWGS2019). We further used these thresholds to diagnose sarcopenia. According to the different methods for assessing physical performance recommended by the AWGS2019 criteria, the AUC of MUAC (0.699–0.772) for diagnosing sarcopenia and severe sarcopenia was similar to that of CC (0.685–0.783), with a sensitivity of 76.11–88.28% and specificity of 62.60%–69.23%, indicating that MUAC is an acceptable index for diagnosing sarcopenia in communities and primary care settings. In contrast, the widely used case-finding tool SARC-F has low-to-moderate sensitivity but high specificity, and is considered suitable for identifying sarcopenia cases in hospitals, nursing homes, or rehabilitation centers.Citation33,Citation34
A recent study of community-dwelling older adults in Brazil reported that among anthropometric indicators including MUAC, waist circumference, CC, and BMI, MUAC (≤27 cm for both sexes) showed the best performance for identifying older adults with sarcopenia, with a sensitivity and specificity of 100% and 77.34%, respectively, for men and 100% and 70.54%, respectively, for women.Citation17 Another study that used corrected arm muscle area to detect sarcopenia according to EWGSOP2 criteria in older adult women found that the optimal cutoff value of corrected arm muscle area was 27.1 cm2.Citation18 However, in the above studies, muscle mass was calculated using the anthropometric prediction equation rather than recommended methods. One study used MAMC to identify muscle function-dependent sarcopenia and obtained cutoff values ranging from 21.0 to 24.9 cm in men and 19.8 to 23.3 cm in women in different age groups.Citation28 The diagnostic accuracy of MAMC was found to vary according to sex and age, and was higher in younger elderly women and older elderly men.Citation28 However, because of the different study populations and reference standards, the results were not comparable between studies. Investigations comparing the diagnostic utility of various screening tools including MUAC in the same population are needed.
The major strengths of our study were as follows. Firstly, to the best of our knowledge, this is the first research to evaluate the accuracy of MUAC as a surrogate marker of ASMI for diagnosing sarcopenia. Secondly, our study was conducted on a large sample of multi-ethnic community-dwelling middle-aged and older adults in China, and the fact that we used the 3 measures of physical performance proposed by AWGS2019 to identify sarcopenia. There were also some limitations to our study. Firstly, skeletal muscle mass was estimated by BIA—which is portable, noninvasive, and low-cost—instead of the gold standard methods (eg, DXA, CT, and MRI), although the reliability of BIA has been previously reported.Citation35 Secondly, gait speed was calculated based on the 4-m rather than the 6-m walk test. However, the former is an essential item of the SPPB, and previous studies have demonstrated its applicability to the diagnosis of sarcopenia.Citation34,Citation36 Finally, participants with no available BIA, MUAC, or CC data were excluded from our analysis, which may have introduced selection bias in our results. Additional well-designed and high-quality studies are needed in the future to overcome these shortcomings.
Conclusion
MUAC was significantly correlated with BIA-assessed ASMI among community-dwelling middle-aged and older adults in China, and can therefore be used as an alternative screening instrument to ASMI for diagnosing sarcopenia, especially in men.
Abbreviations
ASM, appendicular skeletal muscle mass; ASMI, appendicular skeletal muscle mass index; AUC, area under the receiver operating characteristic curve; AWGS2019, Asian Working Group for Sarcopenia 2019; BIA, bioelectrical impedance analysis; BMI, body mass index; CC, calf circumference; CI, confidence interval; CT, computed tomography; DXA, dual-energy X-ray absorptiometry; EWGSOP2, European Working Group on Sarcopenia in Older People 2; MAMC, mid-arm muscle circumference; MRI, magnetic resonance imaging; MUAC, mid-upper arm circumference; ROC, receiver operating characteristic; SARC-F, Strength, Assistance Walking, Rise from a Chair, Climb Stairs, and Falls; SARC-CalF, Strength, Assistance Walking, Rise from a Chair, Climb Stairs, and Falls Combined with Calf Circumference; SPPB, Short Physical Performance Battery; TUG, timed up-and-go; WCHAT, West China Health and Aging Trend.
Data Sharing Statement
Data in this article are confidential and not publicly available. But those data are available from the corresponding author upon a reasonable request.
Ethics Approval and Informed Consent
The WCHAT study was registered in the Chinese Clinical Trial Registry (registration no. ChiCTR1800018895) and was approved by the Ethics Committee of West China Hospital, Sichuan University (approval no. 2017-445). This study was conducted in accordance with the Declaration of Helsinki and written informed consent was obtained from all participants and/or their proxy respondents.
Author Contributions
All authors met the following conditions 1, 2, 3, 4 and 5.
Made a significant contribution to the work reported, whether that is in the conception, study design, execution, acquisition of data, analysis, and interpretation, or in all these areas.
Have drafted or written, or substantially revised or critically reviewed the article.
Have agreed on the journal to which the article will be submitted.
Reviewed and agreed on all versions of the article before submission, during revision, the final version accepted for publication, and any significant changes introduced at the proofing stage.
Agree to take responsibility and be accountable for the contents of the article.
Acknowledgments
The authors thank the participants in this study and the members of the survey teams. We also thank The Charlesworth Group (www.cwauthors.com) for its linguistic assistance during the preparation of this manuscript.
Disclosure
The authors have no conflicts of interest to declare.
References
- Cruz-Jentoft AJ, Sayer AA. Sarcopenia. Lancet. 2019;393(10191):2636–2646. doi:10.1016/S0140-6736(19)31138-931171417
- Antunes AC, Araújo DA, Veríssimo MT, Amaral TF. Sarcopenia and hospitalisation costs in older adults: a cross-sectional study. Nutr Diet. 2017;74(1):46–50. doi:10.1111/1747-0080.1228728731551
- Cruz-Jentoft AJ, Bahat G, Bauer J, et al. Sarcopenia: revised European consensus on definition and diagnosis. Age Ageing. 2019;48(1):16–31. doi:10.1093/ageing/afy16930312372
- Chen LK, Woo J, Assantachai P, et al. Asian Working Group for sarcopenia: 2019 consensus update on sarcopenia diagnosis and treatment. J Am Med Dir Assoc. 2020;21(3):300–307.e302. doi:10.1016/j.jamda.2019.12.01232033882
- Chen CY, Tseng WC, Yang YH, et al. Calf circumference as an optimal choice of four screening tools for sarcopenia among ethnic Chinese older adults in assisted living. Clin Interv Aging. 2020;15:2415–2422. doi:10.2147/CIA.S28720733380792
- Mo Y-H, Zhong J, Dong X, et al. Comparison of three screening methods for sarcopenia in community-dwelling older persons. J Am Med Dir Assoc. 2021;22(4):746–750.e1. doi:10.1016/j.jamda.2020.05.04132669238
- Kawakami R, Murakami H, Sanada K, et al. Calf circumference as a surrogate marker of muscle mass for diagnosing sarcopenia in Japanese men and women. Geriatr Gerontol Int. 2015;15(8):969–976. doi:10.1111/ggi.1237725243821
- Hwang AC, Liu LK, Lee WJ, Peng LN, Chen LK. Calf circumference as a screening instrument for appendicular muscle mass measurement. J Am Med Dir Assoc. 2018;19(2):182–184. doi:10.1016/j.jamda.2017.11.016
- Kim S, Kim M, Lee Y, Kim B, Yoon TY, Won CW. Calf circumference as a simple screening marker for diagnosing sarcopenia in older korean adults: the Korean Frailty and Aging Cohort Study (KFACS). J Korean Med Sci. 2018;33(20):e151. doi:10.3346/jkms.2018.33.e15129760608
- Bruyère O, Beaudart C, Reginster JY, et al. Assessment of muscle mass, muscle strength and physical performance in clinical practice: an international survey. Eur Geriatr Med. 2016;7(3):243–246. doi:10.1016/j.eurger.2015.12.009
- Tosato M, Marzetti E, Cesari M, et al. Measurement of muscle mass in sarcopenia: from imaging to biochemical markers. Aging Clin Exp Res. 2017;29(1):19–27. doi:10.1007/s40520-016-0717-028176249
- Beaudart C, McCloskey E, Bruyère O, et al. Sarcopenia in daily practice: assessment and management. BMC Geriatr. 2016;16(1):170. doi:10.1186/s12877-016-0349-427716195
- Wijnhoven HA, van Bokhorst-de van der Schueren MA, Heymans MW, et al. Low mid-upper arm circumference, calf circumference, and body mass index and mortality in older persons. J Gerontol a Biol Sci Med Sci. 2010;65(10):1107–1114. doi:10.1093/gerona/glq10020547497
- Tsai AC, Chang TL. The effectiveness of BMI, calf circumference and mid-arm circumference in predicting subsequent mortality risk in elderly Taiwanese. Br J Nutr. 2011;105(2):275–281. doi:10.1017/S000711451000342921129232
- Weng CH, Tien CP, Li CI, et al. Mid-upper arm circumference, calf circumference and mortality in Chinese long-term care facility residents: a prospective cohort study. BMJ Open. 2018;8(5):e020485. doi:10.1136/bmjopen-2017-020485
- Noori N, Kopple JD, Kovesdy CP, et al. Mid-arm muscle circumference and quality of life and survival in maintenance hemodialysis patients. Clin J Am Soc Nephrol. 2010;5(12):2258–2268. doi:10.2215/CJN.0208031020947789
- Esteves CL, Ohara DG, Matos AP, Ferreira VTK, Iosimuta NCR, Pegorari MS. Anthropometric indicators as a discriminator of sarcopenia in community-dwelling older adults of the Amazon region: a cross-sectional study. BMC Geriatr. 2020;20(1):518. doi:10.1186/s12877-020-01923-y33261567
- Pinheiro PA, Coqueiro RDS, Carneiro JAO, Correia TML, Pereira R, Fernandes MH. Anthropometric indicators as screening tools for sarcopenia in older adult women. Enferm Clin. 2020;30(4):269–274. doi:10.1016/j.enfcli.2018.12.01032545065
- Zhang Y, Ge M, Zhao W, et al. Association between number of teeth, denture use and frailty: findings from the West China Health and Aging Trend Study. J Nutr Health Aging. 2020;24(4):423–428. doi:10.1007/s12603-020-1346-z32242210
- Jia S, Zhao W, Zhang Y, et al. Multiple physical symptoms of community-dwelling older people in Western China: prevalence and its association with frailty. Gerontology. 2021:1–9. doi:10.1159/000513246
- WHO. Physical Status: The Use and Interpretation of Anthropometry: Report of a WHO Expert Committee. WHO Technical Report Series No. 854. Geneva: WHO; 1995. Available from: http://www.who.int/childgrowth/publications/physical_status/en/. Accessed 61, 2021.
- Hurt RT, Ebbert JO, Croghan I, et al. The comparison of segmental multifrequency bioelectrical impedance analysis and dual-energy X-ray absorptiometry for estimating fat free mass and percentage body fat in an ambulatory population. J Parenter Enteral Nutr. 2020. doi:10.1002/jpen.1994
- Lin CL, Yu NC, Wu HC, et al. Association of body composition with type 2 diabetes: a Retrospective Chart Review Study. Int J Environ Res Public Health. 2021;18:9. doi:10.3390/ijerph18094421
- Minn YK, Suk SH. Higher skeletal muscle mass may protect against ischemic stroke in community-dwelling adults without stroke and dementia: the PRESENT project. BMC Geriatr. 2017;17(1):45. doi:10.1186/s12877-017-0433-428158989
- Guralnik JM, Simonsick EM, Ferrucci L, et al. A short physical performance battery assessing lower extremity function: association with self-reported disability and prediction of mortality and nursing home admission. J Gerontol. 1994;49(2):M85–M94. doi:10.1093/geronj/49.2.M858126356
- Fluss R, Faraggi D, Reiser B. Estimation of the youden index and its associated cutoff point. Biom J. 2005;47(4):458–472. doi:10.1002/bimj.20041013516161804
- DeLong ER, DeLong DM, Clarke-Pearson DL. Comparing the areas under two or more correlated receiver operating characteristic curves: a nonparametric approach. Biometrics. 1988;44(3):837–845. doi:10.2307/25315953203132
- Akın S, Mucuk S, Öztürk A, et al. Muscle function-dependent sarcopenia and cut-off values of possible predictors in community-dwelling Turkish elderly: calf circumference, midarm muscle circumference and walking speed. Eur J Clin Nutr. 2015;69(10):1087–1090. doi:10.1038/ejcn.2015.4225782425
- Ishii S, Tanaka T, Shibasaki K, et al. Development of a simple screening test for sarcopenia in older adults. Geriatr Gerontol Int. 2014;14(Suppl 1):93–101. doi:10.1111/ggi.1219724450566
- Kuczmarski MF, Kuczmarski RJ, Najjar M. Descriptive anthropometric reference data for older Americans. J Am Diet Assoc. 2000;100(1):59–66. doi:10.1016/S0002-8223(00)00021-310646006
- Chilima DM, Ismail SJ. Nutrition and handgrip strength of older adults in rural Malawi. Public Health Nutr. 2001;4(1):11–17. doi:10.1079/PHN20005011255491
- Yang M, Hu X, Xie L, et al. Screening sarcopenia in community-dwelling older adults: SARC-F vs SARC-F combined with calf circumference (SARC-CalF). J Am Med Dir Assoc. 2018;19(3):277.e271–277.e278. doi:10.1016/j.jamda.2017.12.016
- Ida S, Kaneko R, Murata K. SARC-F for screening of sarcopenia among older adults: a meta-analysis of screening test accuracy. J Am Med Dir Assoc. 2018;19(8):685–689. doi:10.1016/j.jamda.2018.04.00129778639
- Kim M, Won CW. Sarcopenia in Korean community-dwelling adults aged 70 years and older: application of Screening and Diagnostic Tools From the Asian Working Group for Sarcopenia 2019 update. J Am Med Dir Assoc. 2020;21(6):752–758. doi:10.1016/j.jamda.2020.03.01832386844
- Wang H, Hai S, Cao L, Zhou J, Liu P, Dong BR. Estimation of prevalence of sarcopenia by using a new bioelectrical impedance analysis in Chinese community-dwelling elderly people. BMC Geriatr. 2016;16(1):216. doi:10.1186/s12877-016-0386-z28031025
- Yang L, Yao X, Shen J, et al. Comparison of revised EWGSOP criteria and four other diagnostic criteria of sarcopenia in Chinese community-dwelling elderly residents. Exp Gerontol. 2020;130:110798. doi:10.1016/j.exger.2019.11079831816424