
Abstract
Purpose
Carotid atherosclerosis is a kind of systemic atherosclerosis in the carotid arteries. However, the efficiency of treatment is insufficient. Therefore, it is urgent to find therapeutic targets and deepen the understanding of carotid atherosclerosis.
Materials and Methods
In this study, we analyzed differentially expressed genes (DEGs) between atheroma plaque and macroscopically intact tissue (control samples). Furthermore, we performed Gene Ontology (GO) and Kyoto Encyclopedia of Gene and Genomes (KEGG) enrichment analysis based on the DEGs. Four methods were used to identify the hub genes in the protein–protein interaction networks of the DEGs. Furthermore, we also performed network module analysis to reveal carotid atherosclerosis-related gene modules and biological functions.
Results
The enrichment results showed that the biological functions were related to inflammation, immunity, chemokine and cell adhesion molecule, such as PIK-Akt signaling pathway, Rap1 signaling pathway, MAPK signaling pathway, NOD-like receptor signaling pathway and B cell receptor signaling pathway. In addition, we screened the hub genes. A total of 16 up-regulated genes (C3AR1, CCR1, CCR2, CD33, CD53, CXCL10, CXCL8, CXCR4, CYBB, FCER1G, FPR2, ITGAL, ITGAM, ITGAX, ITGB2, and LILRB2) were identified as hub genes. A total of 5 gene modules were obtained. We found that biological functions obtained for each cluster were mostly related to immunity, chemokines and cell adhesion molecules.
Conclusion
The present study identified key DEGs in atheroma plaque compared with control samples. The key genes involved in the development of carotid atherosclerosis may provide valuable therapeutic targets for carotid atherosclerosis.
Introduction
Carotid atherosclerosis is the manifestation of systemic atherosclerosis in the carotid arteries.Citation1 It usually occurs in adolescence and gradually worsens with age. It is currently believed to be closely related to the occurrence of ischemic stroke in the elderly.Citation2 In the early stage of carotid atherosclerosis, it first manifests as intima-media thickening, and then gradually forms atherosclerotic plaques.Citation3 This cause corresponding hemodynamic changes, which in turn leads to ischemic cerebrovascular events. Contrary to the steady or declining trend of most disease, the incidence of atherosclerosis has been shown to increase in both men and women.Citation4 In the past decade, the number of available treatments for carotid atherosclerosis has increased. In particular, immunotherapy and targeted therapy have improved the prospects of treatment. However, the efficiency of treatment is insufficient.Citation5,Citation6 Therefore, it is urgent to find therapeutic targets and deepen the understanding of carotid atherosclerosis.
Some studies have shown that the abnormal expression of some genes is closely related to the development of carotid atherosclerosis. S100A12, a calcium binding protein involved in inflammatory signaling, was also shown to be elevated in patients bearing carotid atherosclerotic lesions.Citation7 Serum levels of TNFα and L-selectin, a lectin type adhesion molecule expressed on leukocytes surface, were shown to associate with larger plaque size.Citation8 A previous study showed that there is an association between histological features of carotid plaque instability and serum levels of circulating matrix metalloproteinase (MMP)-1, MMP-7, tissue inhibitor of matrix protease (TIMP)-1, and IL-8.Citation9 But the molecule mechanism of carotid atherosclerosis has not been fully elucidated. Therefore, it is important to deepen the understanding for the relationship between carotid atherosclerosis and abnormal changes in genes.
In this study, we obtained the differentially expressed genes (DEGs) between atheroma plaque and control samples. We further explored the biological functions of DEGs and constructed a protein–protein interaction (PPI) network. In addition, we obtained 16 hub genes. And we established the carotid atherosclerosis development-related network modules. In summary, we identified of hub genes involved in the development of carotid atherosclerosis. The study may help to provide guideline for the treatment of carotid atherosclerosis.
Materials and Methods
Data Collection and Processing
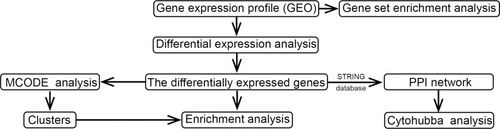
The expression profiling data of hypertensive patients in our study was derived from one published dataset (GSE43292)Citation10 available in Gene expression omnibus (GEO) database. The GSE43292 dataset based on the GPL6244 platform contains 32 atheroma plaque and 32 macroscopically intact tissue (control samples) from 32 hypertensive patients. The dataset was profiled using the Affymetrix Human Gene 1.0 ST Array (Santa Clara, CA) platform. The justRMA method in the affy packageCitation11 was applied to normalize the raw data of the dataset. If one gene corresponded to multiple probes, the average expression value of these probes was considered to be the expression value of the gene. The workflow of this study is shown in .
Figure 1 The workflow of this study.
Analysis of Differentially Expressed Genes (DEGs) for Atheroma Plaque and Control Samples
The limma packageCitation12 was used to analyze differentially expressed genes (DEGs) between atheroma plaque and control samples. The DEGs with P value (adjusted false positive rate) <0.05 and |log2 fold change (FC)| >0.5 were considered significant.
Enrichment Analysis
The clusterProfiler packageCitation13 in R was used to functionally analyze the enriched pathways of the DEGs, including Gene Ontology (GO) terms and Kyoto Encyclopedia of Genes and Genomes (KEGG) pathways. P value <0.05 was considered significant. Gene set enrichment analysis (GSEA) was performed using GSEA java softwareCitation13 against the reference gene sets c2.cp.kegg.v6.2. symbols.gmt and c5.bp.v7.0.entrez.gmt, which were downloaded from the Molecular Signature Database (http://software.broadinstitute.org/gsea/index.jsp).Citation13 The nominal (NOM) P value <0.05 and false discovery ratio (FDR) <0.25 were considered statistically significant.
Protein–Protein Interaction (PPI)
To obtain insights into the interactions among DEGs associated with carotid atherosclerosis. A PPI network was constructed using the Search Tool for the Retrieval of interacting Genes (STRING),Citation14 a database of known and predicted protein interactions. An interaction with score>990 was included in our present study. The PPI network was visualized by Cytoscape 3.8.2 software (http://www.cytoscape.org/).Citation15
Hub Genes Selection and Analysis
CytoHubba is a common tool for analyzing PPI networks.Citation16 The hub genes were selected using the cytoHubba plug-in of Cytoscape software. Those overlap genes in the top 50 genes, from the four ranking methods, were defined as hub genes. The four ranking methods include Degree, density of maximum neighborhood component (DMNC), maximal clique centrality (MCC), maximum neighborhood component (MNC).
Establishment of the Carotid Atherosclerosis-Related Network Modules
We used the MCODE plug-in in the Cytoscape softwareCitation17 to screen the modules concealed in the carotid atherosclerosis occurrence-related network with the following criteria: Max. depth = 100, K-Core = 7, mode score cutoff = 0.2, and degree cutoff = 2. Likewise, the functional specification of the identified module was determined with the clusterProfiler package as mentioned above. A P value (adjusted by Benjamini & Hochberg method) <0.05 was considered statistically significant.
Statistical Analysis
All analyses were performed using R (version 4.0.2, http://www.r-project.org/). We analyzed the expression levels of genes in the atheroma plaque and control samples using unpaired t-tests provided by limma package. Unless otherwise stated, we considered P < 0.05 to be statistically significant.
Results
Identification of DEGs Associated with the Progression of Carotid Atherosclerosis
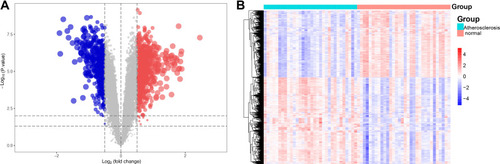
A total of 1328 DEGs, including 749 up-regulated DEGs and 579 down-regulated DEGs, were identified in atheroma plaque compared with control samples (). In addition, we found that the expression patterns of these DEGs may distinguish atheroma plaque from control samples ()
Figure 2 The differentially expressed genes (DEGs) for carotid atherosclerosis and control samples. (A) A volcano plot of the for carotid atherosclerosis and control samples. Red indicated upregulated genes and blue indicated downregulated genes. The gray area showed the gene expression below the threshold criteria. (B) The heatmap of the DEGs.
KEGG and GO Enrichment Analyses of DEGs
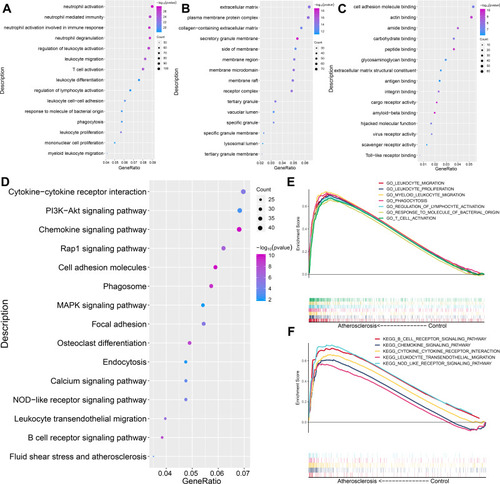
To analyze the biological classification of DEGs, functional and pathway enrichment analyses were performed. As shown in , changes in biological processes (BPs) of DEGs were significantly enriched in the physical activity of immune cells (neutrophil, leukocyte, T cell, lymphocyte and phagocyte). GO analysis result showed that cellar component (CC) and molecular function (MF) were significantly enriched in “extracellular matrix”, “plasma membrane protein complex”, “collagen-containing extracellular matrix”, “cell adhesion molecule binding” “actin binding” and “amide binding” (). The KEGG enrichment analysis result showed that some pathways were related to carotid atherosclerosis, such as PI3K-Akt signaling pathway,Citation18 Chemokine signaling pathway,Citation19 Cell adhesion molecules,Citation20 MAPK signaling pathway,Citation21 Calcium signaling pathway,Citation22 NOD-like receptor signaling pathwayCitation23 and Fluid shear stress and atherosclerosisCitation24 (). Furthermore, we found that the change of BPs was significantly “leukocyte migration”, “leukocyte proliferation”, “myeloid leukocyte migration”, “phagocytosis”, “regulation of lymphocyte activation”, “response to molecule of bacterial origin” and “T cell activation” in atheroma plaque compared with control samples based on GSEA result (). And the KEGG pathways, “B cell receptor signaling pathway”, “chemokine signaling pathway”, “cytokine-cytokine receptor interaction”, “leukocyte trans endothelial migration” “NOD like receptor signaling pathway”, were significantly enriched in atheroma plaque compared with control samples based on GSEA result ().
Figure 3 The biological functions of differentially expressed genes (DEGs). (A) Cellular component, (B) biological process, (C) molecular function and (D) KEGG pathway analysis. The gene set enrichment analysis (GSEA) for (E) GO and (F) KEGG for carotid atherosclerosis and control samples.
PPI Network Construction
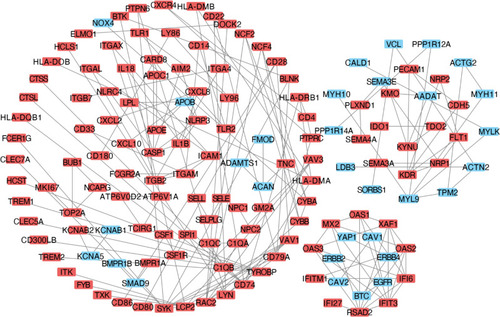
To obtain the interactions between the 1328 DEGs in the atheroma plaque compared with control samples, a PPI network was constructed using the STRING database and visualized by the Cytoscape software. As shown in , the network included 147 nodes and 178 edges.
Figure 4 The PPI network. A graphic representation of the protein–protein network based on differentially expressed genes of carotid atherosclerosis and control samples. Red nodes indicated upregulated genes and light blue nodes indicated downregulated genes in the carotid atherosclerosis group.
Hub Genes Selection and Analysis
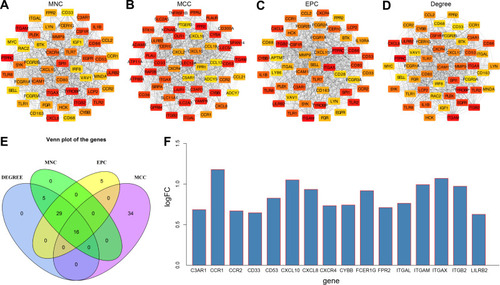
Among the lists of the top 50 genes selected, respectively, by the four ranking methods (–), 16 genes overlapped were identified (). And 16 hub genes (C3AR1, CCR1, CCR2, CD33, CD53, CXCL10, CXCL8, CXCR4, CYBB, FCER1G, FPR2, ITGAL, ITGAM, ITGAX, ITGB2, and LILRB2) were upregulated in carotid atherosclerosis tissue compared with control samples ().
Figure 5 The selection and analysis of hub genes. Top 50 genes selected based the four ranking methods. (A) Degree, (B) DMNC, (C) MCC and (D) MNC. The darker the color of the node, the higher the score. DMNC, density of maximum neighborhood component; MCC, maximal clique centrality. MNC, maximum neighborhood component. (E) Venn plot. Venn plot of the overlapping genes for the top 50 genes selected based on the four ranking methods. Degree, DMNC, MNC, and MCC. (F) The expression levels for 16 hub genes in carotid atherosclerosis samples compared with control samples.
KEGG and GO Enrichment Analyses of Cluster Genes
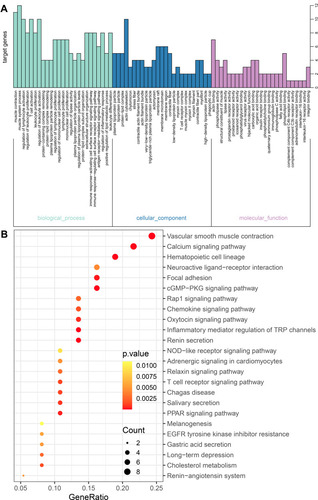
A total of 5 clusters were obtained after MCODE (Molecular Complex Detection) algorithm. In addition, the enrichment analysis result showed that changes in GO function of cluster 1 were significantly enriched in “neutrophil activation”, “secretory granule membrane” and “G protein-coupled peptide receptor activity” (), while the changes in KEGG pathways were significantly enriched in “chemokine signaling pathway” and “cytokine-cytokine receptor interaction” (). The changes in GO function of cluster 2 were significantly enriched in “response to type I interferon”, “defense response to other organism”, “endocytic vesicle”, “plasma membrane protein complex”, “toll-like receptor activity”, “protein tyrosine kinase activity” and “cytokine receptor binding” (), while the changes in KEGG pathways of that were significantly enriched in “Tuberculosis” (). The changes in GO function of cluster 3 were significantly enriched in “neutrophil activation”, “azurophil granule lumen”, “primary lysosome”, “azurophil granule”, “vacuolar lumen”, “secretory granule lumen”, “vesicle lumen”, “receptor ligand activity”, “enzyme activator activity” and “receptor regulator activity” (), while the changes in KEGG pathways of that were significantly enriched in “lysosome” and “rRheumatoid arthritis” (). The changes in GO function of cluster 4 were significantly enriched in “regulation of leukocyte activation”, “cytoplasmic vesicle lumen”, “vesicle lumen”, “ubiquitin-protein transferase activity” and “ubiquitin-like protein transferase activity” (), while the changes in KEGG pathways of that were significantly enriched in “PI3K-Akt signaling pathway”, “human papillomavirus infection”, “endocytosis”, “focal adhesion” and “cell adhesion molecules” (). The changes in GO function of cluster 5 were significantly enriched in “muscle system process”, “actin cytoskeleton” and “actin binding” (), while the changes in KEGG pathways of that were significantly enriched in “vascular smooth muscle contraction” (). These results indicated that the formation of carotid atherosclerosis is the result of a coordination disorder of multiple gene modules and various biological pathways.
Figure 6 The GO and KEGG enrichment analysis for the genes in cluster 1 obtained based the MCODE method. (A) The biological processes and (B) KEGG pathways for genes in cluster 1.
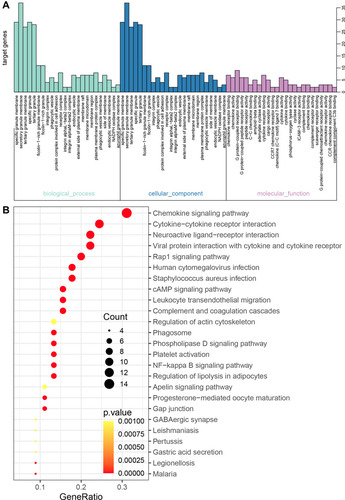
Figure 7 The GO and KEGG enrichment analysis for the genes in cluster 2 obtained based the MCODE method. (A) The biological processes and (B) KEGG pathways for genes in cluster 2.
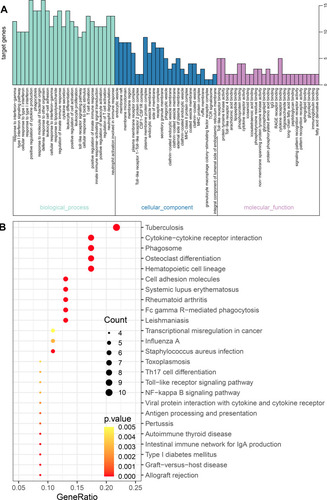
Figure 8 The GO and KEGG enrichment analysis for the genes in cluster 3 obtained based the MCODE method. (A) The biological processes and (B) KEGG pathways for genes in cluster 3.
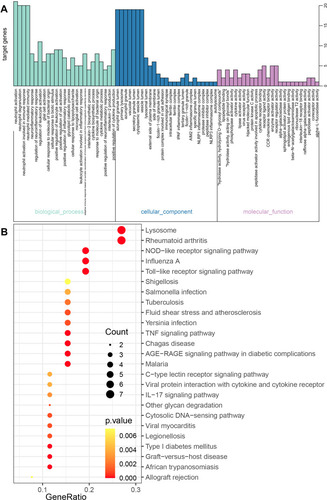
Figure 9 The GO and KEGG enrichment analysis for the genes in cluster 4 obtained based the MCODE method. (A) The biological processes and (B) KEGG pathways for genes in cluster 4.
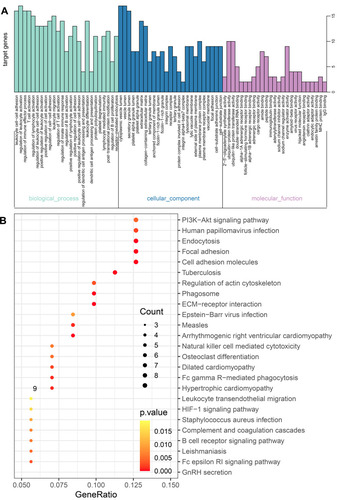
Figure 10 The GO and KEGG enrichment analysis for the genes in cluster 5 obtained based the MCODE method. (A) The biological processes and (B) KEGG pathways for genes in cluster 5.
Discussion
A study showed that about 57.79 million people of 30~70-year-old in the world have atheroma plaque in 2020, an increase of 59.13% from 2000.Citation25 However, the efficiency of treatment was low. To find potentially effective and therapeutic targets, there is an urgent requirement to explore the genes that lead to development of carotid atherosclerosis.
The present study utilized a relatively large sample dataset obtained from GEO. These data were analyzed to identify DEGs between carotid atherosclerosis and control samples. KEGG pathway analysis revealed with the 1328 DEGs mainly involved with PI3K-Akt signaling pathway, Chemokine signaling pathway, Cell adhesion molecules, MAPK signaling pathway, Calcium signaling pathway, NOD-like receptor signaling pathway and Fluid shear stress and atherosclerosis. It is well known that the inhibition of PI3K-Akt signaling pathway may reduce the vulnerability of atherosclerotic plaques.Citation18 And chemokine CXCR4 may limit atherosclerosis by maintaining arterial integrity.Citation19 Furthermore, geniposide may be against atherosclerosis by inhibiting formation of foam cell and lowering reverse lipid transport via MAPK signaling pathway.Citation21 Circulating cell adhesion molecules are correlated with ultrasound-based assessment of carotid atherosclerosis.Citation20 GO enrichment analysis revealed that DEGs were mainly associated with physical activity of immune cells (neutrophil, leukocyte, T cell, lymphocyte and phagocyte). The present results provide bioinformatics evidence for further research.
The 16 overlapping genes among the top 50 genes in the PPI network found using four ranking methods were selected. All 16 genes were upregulated in the carotid atherosclerosis. The result reveals that these genes may serve an important role in the progression of carotid atherosclerosis. And prior the present study, few studies have addressed the gaps in the molecular mechanisms that lead to carotid atherosclerosis development. The genes (C3AR1, CCR1, CCR2, CXCL10, CXCL8, CXCR4) enriched for chemokine-related genes. The genes (ITGAL, ITGAM, ITGAX, ITGB2) enriched for cell adhesion-related molecules. The genes (CD33, CD53, CYBB, FCER1G, FPR2, LILRB2) enriched for immunity-related genes. In carotid plaques, C3aR1Citation26 and FCER1GCitation27 is higher compared to control arteries. CCR1 alters the immuno-inflammatory response in atherosclerosis.Citation28 Anti-CXCL10 treatment in atherosclerosis susceptible mice results in a change into a more stable lesion phenotype.Citation29 The progression of carotid atherosclerosis is related to CD53.Citation30 In the present study, the aim was to focus on DEGs between atheroma plaque and control samples. However, due to lack of experimental validation, it is not clear whether these genes are causal or merely markers. Furthermore, we established of the carotid atherosclerosis development-related network modules based on the MCODE method. A total of 5 clusters were obtained. Furthermore, the enrichment analysis results of each cluster genes showed that biological functions obtained were mostly related to immunity, chemokines and cell adhesion molecules. But there are some differences.
A total of 5 clusters were obtained after MCODE algorithm. And the enrichment analysis result showed that the biological function were associated with carotid atherosclerosis. Interestingly, NF-kb, a crucial transcriptional factor, which controls the transcription of many genes with an established role in atherosclerosis, such as cell proliferation, regulators of apoptosis, acute phase proteins, adhesion molecules, chemokines and cytokines.Citation31 Toll-like receptors (TLRs), key players in innate immunity, are upregulated in atherosclerotic lesions.Citation32 Atherosclerosis is an inflammatory disease associated with the activation of innate immune TLRs and nucleotide-binding oligomerization domain-containing protein (NOD)-like receptor pathways.Citation33 In addition, a previous study showed that a large amount of iron is deposited in the lysosomes of foam cells in early atherosclerotic lesions.Citation34 In summary, we thought the 5 clusters were closely related to carotid atherosclerosis.
There are a few important limitations to the present study. Firstly, the study is only based on the bioinformatics analysis, lack of experimental validation. Secondly, the sample size in this study is not very large. We hope that we can expand the sample size included in the further. Finally, our study is based on a retrospective dataset. We hope that we can verify the findings of this study in a prospective cohort.
Conclusion
In conclusion, the present study identified key DEGs in atheroma plaque compared with control samples. The key genes involved in the development of carotid atherosclerosis may provide valuable therapeutic targets for carotid atherosclerosis.
Data Sharing Statement
Data were downloaded from the Gene Expression Omnibus (GEO) database (https://www.ncbi.nlm.nih.gov/geo/).
Acknowledgments
This study was supported by the Project of Qingxiu District of Nanning Scientific Research and Technology Development Plan (2019039 and 2020058), the Scientific Research Project of Guangxi Health Commission (Z20200212), the High-Level Medical Expert Training Program of Guangxi “139” Plan Funding (G201903049), and Guangxi medical and health key discipline construction project (Department of Cardiology and Department of Emergency Medicine).
Disclosure
The authors report no conflicts of interest related to this work.
References
- Stary HC, Chandler AB, Dinsmore RE, et al. A definition of advanced types of atherosclerotic lesions and a histological classification of atherosclerosis. A report from the Committee on Vascular Lesions of the Council on Arteriosclerosis, American Heart Association. Circulation. 1995;92(5):1355–1374. doi:10.1161/01.cir.92.5.13557648691
- Martinez E, Martorell J, Riambau V. Review of serum biomarkers in carotid atherosclerosis. J Vasc Surg. 2020;71(1):329–341. doi:10.1016/j.jvs.2019.04.48831327598
- Chen WH, Jin W, Lyu PY, et al. Carotid atherosclerosis and cognitive impairment in nonstroke patients. Chin Med J (Engl). 2017;130(19):2375–2379. doi:10.4103/0366-6999.21533128937045
- Forgo B, Medda E, Hernyes A, Szalontai L, Tarnoki DL, Tarnoki AD. Carotid artery atherosclerosis: a review on heritability and genetics. Twin Res Hum Genet. 2018;21(5):333–346. doi:10.1017/thg.2018.4529976271
- Harle LM, Plichart M. [Carotid atherosclerosis and dementia]. Geriatr Psychol Neuropsychiatr Vieil. 2015;13(3):309–316. French. doi:10.1684/pnv.2015.055426395304
- Vigen T, Ihle-Hansen H, Lyngbakken MN, et al. Carotid atherosclerosis is associated with middle cerebral artery pulsatility index. J Neuroimaging. 2020;30(2):233–239. doi:10.1111/jon.1268431889363
- Abbas A, Aukrust P, Dahl TB, et al. High levels of S100A12 are associated with recent plaque symptomatology in patients with carotid atherosclerosis. Stroke. 2012;43(5):1347–1353. doi:10.1161/STROKEAHA.111.64225622382154
- Andersson J, Sundstrom J, Kurland L, et al. The carotid artery plaque size and echogenicity are related to different cardiovascular risk factors in the elderly: the Prospective Investigation of the Vasculature in Uppsala Seniors (PIVUS) study. Lipids. 2009;44(5):397–403. doi:10.1007/s11745-009-3281-y19234732
- Pelisek J, Rudelius M, Zepper P, et al. Multiple biological predictors for vulnerable carotid lesions. Cerebrovasc Dis. 2009;28(6):601–610. doi:10.1159/00024760519844101
- Ayari H, Bricca G. Identification of two genes potentially associated in iron-heme homeostasis in human carotid plaque using microarray analysis. J Biosci. 2013;38(2):311–315. doi:10.1007/s12038-013-9310-223660665
- Gautier L, Cope L, Bolstad BM, Irizarry RA. Affy–analysis of Affymetrix GeneChip data at the probe level. Bioinformatics. 2004;20(3):307–315. doi:10.1093/bioinformatics/btg40514960456
- Yu J, Wu X, Huang K, et al. Bioinformatics identification of lncRNA biomarkers associated with the progression of esophageal squamous cell carcinoma. Mol Med Rep. 2019;19(6):5309–5320. doi:10.3892/mmr.2019.1021331059058
- Yu G, Wang LG, Han Y, He QY. clusterProfiler: an R package for comparing biological themes among gene clusters. OMICS. 2012;16(5):284–287. doi:10.1089/omi.2011.011822455463
- Szklarczyk D, Gable AL, Lyon D, et al. STRING v11: protein-protein association networks with increased coverage, supporting functional discovery in genome-wide experimental datasets. Nucleic Acids Res. 2019;47(D1):D607–D613. doi:10.1093/nar/gky113130476243
- Otasek D, Morris JH, Boucas J, Pico AR, Demchak B. Cytoscape automation: empowering workflow-based network analysis. Genome Biol. 2019;20(1):185. doi:10.1186/s13059-019-1758-431477170
- Chin CH, Chen SH, Wu HH, Ho CW, Ko MT, Lin CY. cytoHubba: identifying hub objects and sub-networks from complex interactome. BMC Syst Biol. 2014;8(Suppl 4):S11. doi:10.1186/1752-0509-8-S4-S1125521941
- Bader GD, Hogue CW. An automated method for finding molecular complexes in large protein interaction networks. BMC Bioinform. 2003;4:2. doi:10.1186/1471-2105-4-2
- Wang N, Zhang X, Ma Z, et al. Combination of tanshinone IIA and astragaloside IV attenuate atherosclerotic plaque vulnerability in ApoE(-/-) mice by activating PI3K/AKT signaling and suppressing TRL4/NF-kappaB signaling. Biomed Pharmacother. 2020;123:109729. doi:10.1016/j.biopha.2019.10972931887543
- Doring Y, Noels H, van der Vorst EPC, et al. Vascular CXCR4 limits atherosclerosis by maintaining arterial integrity: evidence from mouse and human studies. Circulation. 2017;136(4):388–403. doi:10.1161/CIRCULATIONAHA.117.02764628450349
- Rohde LE, Lee RT, Rivero J, et al. Circulating cell adhesion molecules are correlated with ultrasound-based assessment of carotid atherosclerosis. Arterioscler Thromb Vasc Biol. 1998;18(11):1765–1770. doi:10.1161/01.atv.18.11.17659812916
- Shen D, Zhao D, Yang X, Zhang J, He H, Yu C. Geniposide against atherosclerosis by inhibiting the formation of foam cell and lowering reverse lipid transport via p38/MAPK signaling pathways. Eur J Pharmacol. 2019;864:172728. doi:10.1016/j.ejphar.2019.17272831600492
- Zavaczki E, Gall T, Zarjou A, et al. Ferryl hemoglobin inhibits osteoclastic differentiation of macrophages in hemorrhaged atherosclerotic plaques. Oxid Med Cell Longev. 2020;2020:3721383. doi:10.1155/2020/372138332184915
- Shi X, Xie WL, Kong WW, Chen D, Qu P. Expression of the NLRP3 inflammasome in carotid atherosclerosis. J Stroke Cerebrovasc Dis. 2015;24(11):2455–2466. doi:10.1016/j.jstrokecerebrovasdis.2015.03.02426381780
- Chen Z, Qin H, Liu J, et al. Characteristics of wall shear stress and pressure of intracranial atherosclerosis analyzed by a computational fluid dynamics model: a pilot study. Front Neurol. 2019;10:1372. doi:10.3389/fneur.2019.0137232010041
- Song P, Xia W, Zhu Y, et al. Prevalence of carotid atherosclerosis and carotid plaque in Chinese adults: a systematic review and meta-regression analysis. Atherosclerosis. 2018;276:67–73. doi:10.1016/j.atherosclerosis.2018.07.02030036743
- Niyonzima N, Bakke SS, Gregersen I, et al. Cholesterol crystals use complement to increase NLRP3 signaling pathways in coronary and carotid atherosclerosis. EBioMedicine. 2020;60:102985. doi:10.1016/j.ebiom.2020.10298532927275
- Centa M, Jin H, Hofste L, et al. Germinal center-derived antibodies promote atherosclerosis plaque size and stability. Circulation. 2019;139(21):2466–2482. doi:10.1161/CIRCULATIONAHA.118.03853430894016
- Potteaux S, Combadiere C, Esposito B, et al. Chemokine receptor CCR1 disruption in bone marrow cells enhances atherosclerotic lesion development and inflammation in mice. Mol Med. 2005;11(1–12):16–20. doi:10.2119/2005-00028.Potteaux16491201
- Segers D, Lipton JA, Leenen PJ, et al. Atherosclerotic plaque stability is affected by the chemokine CXCL10 in both mice and humans. Int J Inflam. 2011;2011:936109. doi:10.4061/2011/93610922164344
- Zhao B, Wang D, Liu Y, et al. Six-gene signature associated with immune cells in the progression of atherosclerosis discovered by comprehensive bioinformatics analyses. Cardiovasc Ther. 2020;2020:1230513. doi:10.1155/2020/123051332821283
- de Winther MP, Kanters E, Kraal G, Hofker MH. Nuclear factor kappaB signaling in atherogenesis. Arterioscler Thromb Vasc Biol. 2005;25(5):904–914. doi:10.1161/01.ATV.0000160340.72641.8715731497
- Monaco C, Gregan SM, Navin TJ, Foxwell BM, Davies AH, Feldmann M. Toll-like receptor-2 mediates inflammation and matrix degradation in human atherosclerosis. Circulation. 2009;120(24):2462–2469. doi:10.1161/CIRCULATIONAHA.109.85188119948979
- Tang G, Duan F, Li W, et al. Metformin inhibited Nod-like receptor protein 3 inflammasomes activation and suppressed diabetes-accelerated atherosclerosis in apoE(-/-) mice. Biomed Pharmacother. 2019;119:109410. doi:10.1016/j.biopha.2019.10941031518877
- Jerome WG. Lysosomes, cholesterol and atherosclerosis. Clin Lipidol. 2010;5(6):853–865. doi:10.2217/clp.10.7021643524