Abstract
Information regarding the alteration of trabecular bone microarchitecture, which is one of the important criteria to estimate bone condition, induced by osteoarthritis (OA) is sparse. The current study therefore aimed to identify and quantify patterns of alterations in trabecular bone microarchitectural characteristics at tibial epiphysis induced by OA using in vivo microcomputed tomography. Fourteen 8-week-old female Sprague Dawley rats were randomly divided into control (n = 7) and OA (n = 7) groups. Rats in the OA group were administered monoiodoacetate into the knee-joint cavity. The tibial joints were scanned by in vivo microcomputed tomography at 0, 4, and 8 weeks after administration. Two-way analysis of variance with Tukey’s honestly significant difference post hoc test was carried out for statistical analyses. The results showed that patterns of alterations in the trabecular bone microarchitectural characteristics in the OA group were not different from those in the control group from 0 to 4 weeks (P > 0.05), but differed from 4 to 8 weeks (P < 0.05). In particular, both trabecular bone thickness and trabecular bone separation distributions over time (4–8 weeks) differed significantly (P < 0.05). These findings suggest that the patterns of bone microarchitecture changes brought about by OA should be periodically considered in the diagnosis and management of arthritic symptoms over time. Improved understanding of the alteration pattern on trabecular bone microarchitecture may assist in developing more targeted treatment interventions for OA.
Introduction
Osteoarthritis (OA) is the most common form of arthritis.Citation1 OA is most prevalent in the elderly, and about 50% of adults aged 65–75 years and almost 70% of those 75+ years suffer from this disease.Citation2 Also, US$15 billion is estimated to be spent in treating arthritis annually,Citation3 and the number affected is expected to increase from 15% in 1995 to 18% of the total US population in 2020.Citation4 Therefore, the medical bill for OA treatment represents an increasing burden on both individuals and society, and both interest in and the need for degenerative arthritis research are growing.
The direct cause of OA remains unknown, although age, sex, and genetic factors influence the prevalence; also, a lack of complete understanding exists of long-term secondary effects on bones.Citation5,Citation6 The known secondary symptoms of knee OA are currently thought to be caused by the erosion of cartilage in knee joints.Citation7 The cartilage is softened and broken by erosion, resulting in the formation of osteophytes and the fibrosis of synovial membranes.Citation1 Hypertrophy of joint capsules also occurs, and causes pain and gradually debilitates joint function. If these changes worsen, a tibia plateau fracture may occur.Citation8 Drug therapy with nonsteroidal anti-inflammatory drugs or surgical interventions such as knee replacement, arthroplasty, or osteotomy are commonly used for the management of degenerative arthritis.Citation9–Citation11 During pharmacological therapy or surgical intervention, whether to initiate the therapy or procedures, the type of procedure used, and the aim of management all depend upon the clinical judgment of the level of bone damage.Citation10 However, these managements are difficult without a thorough understanding and comprehensive evaluation of the trabecular bone microarchitecture that is one of the important criteria to estimate bone condition.Citation9,Citation12 Thus, for effective management of the bone condition, one must understand the changes in trabecular bone microarchitecture caused by OA. Many investigators have attempted to characterize the changes in trabecular bone microarchitecture caused by OA.Citation13–Citation17 However, these studies, which dealt with changes in trabecular bone microarchitecture, had limitations in terms of continuous and individual tracing.Citation13–Citation17 In other words, they were insufficient because the initial changes in trabecular bone microarchitecture and those that occurred during disease progression were not taken into account, and the time course of changes in each animal was not traced.
We aimed to perform a quantitative analysis of the patterns of changes in the bone microarchitecture at the tibial epiphysis of knee joints periodically and continuously as OA progressed. Furthermore, we intend to establish the standard characteristics of the knee joint trabecular bone microarchitecture upon development of OA, and to provide a greater understanding of OA from the clinical viewpoint and to aid in its treatment.
Materials and methods
Animal model preparation
The animal experiments in this study complied with the animal protection and usage guidelines and regulations of Yonsei University. Fourteen 6-week-old white male rats (Sprague Dawley rats, ~250 ± 7 g) were used. They were housed at Yonsei University Laboratory Animal Research Center for 2 weeks to allow them to adapt to the environment (temperature 23°C ± 3°C, humidity 50% ± 10%). The day/ night cycle was set up every 12 hours. Animals were fed standard rat food (Purina, Nestlé Purina PetCare, Seoul, South Korea) with water available and allowed to exercise freely in cages. In order to minimize any potential stress factors, the animals were monitored throughout the duration of the experiment (8 weeks) by members of Yonsei University Laboratory Animal Research Center. It should be noted that the animals retained full mobility and continued to grow normally. Rats were classified into two groups: the induced osteoarthritis group (OA group; n = 7; OA1–OA7) and the control group, which received no intervention (CON group; n = 7; C1–C7). To induce OA, 1 mg monoiodoacetate (MIA) (Sigma-Aldrich, St Louis, MO) was dissolved in 0.05 mL sterile saline and injected into the right knee joint using a 27-gauge, 0.5-inch needle.Citation7
In vivo micro-computed tomography
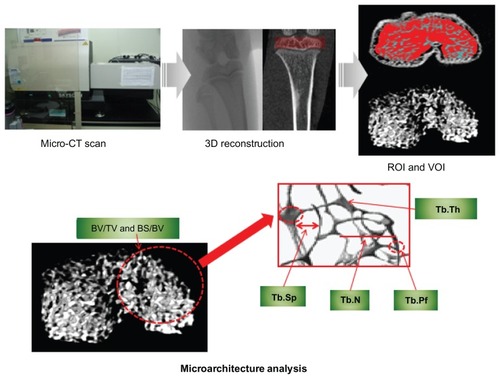
Knee-joint images of the CON and OA groups were obtained using an in vivo micro-computed tomography (μ-CT) examination system (model 1076; SkyScan, Kontich, Belgium) to analyze the patterns of trabecular bone microarchitectural changes (). Each knee joint was scanned at a 35 × 35 × 35-μm isotrophic voxel resolution at the beginning of the experiment (before MIA injection), and at 4 and 8 weeks after MIA injection to assess changes in trabecular bone microarchitecture. Scanning parameters were 100 kV tube voltage, 100 μA tube current, 1.0 mm filter, and a 0.7° gantry rotation angle. Flat-field correction and beam-hardening-factor correction were carried out to rectify the beam-hardening effect.Citation11 In addition, the rats were anesthetized with ketamine hydrochloride (1 mL/ kg; Huons, Seoul, South Korea) and xylazine hydrochloride (0.33 mL/kg; Bayer, Seoul, South Korea) to restrict their movements to obtain the desired image for μ-CT examination. Physical monitoring systems were also used to observe stress levels during the scan, and a shutter was used to block rats’ exposure to radiation.Citation22
Figure 1 Micro-computed tomography (μ-CT) scan, 3-D reconstruction, region of interest (ROI) and volume of interest (VOI) selection, and bone microarchitecture analysis in 3-D trabecular bone.
Trabecular bone microarchitecture and volumetric bone mineral density
Following completion of the reconstruction of two-dimensional images from μ-CT, the trabecular bone of 600 μm epiphysis above the growth plate was chosen as the volume of interest (). Bone microarchitecture variables in both the CON and OA groups were bone volume/tissue volume (BV/TV), bone surface/bone volume (BS/BV), trabecular bone pattern factor (Tb.Pf), trabecular bone number (Tb.N), trabecular bone thickness (Tb.Th), and trabecular bone separation (Tb.Sp). BV/TV indicates the proportion of bone volume in the total tissue volume and is an indicator of changes in the total bone volume. BS/BV is the ratio of the selected bone surface to the bone volume and indicates the level of bone turnover. Tb.Pf is an indicator of the connection level of trabecular bone, meaning that the higher this value is, the lower the connectivity and vice versa. Tb.N is the amount of trabecular bone per unit length, and Tb.Th is an index of trabecular bone thickness: the higher the value of Tb.N or Tb.Th, the higher the level of bone formation. Tb.Sp indicates the average distance between trabecular bones, thus the narrower the gap, the higher the bone density. Analyses of distributions of trabecular bone thickness and separation (Tb.Th and Tb.Sp distribution) were performed to identify the progressive heterogeneity of the trabecular bone microarchitecture in OA over time.Citation26 In addition, volumetric bone mineral density (vBMD) was examined to investigate the rate of bone loss.
Validation of OA
To assess the onset and progress of OA using radiological methods, the surface deformity and damage above the epiphysis were traced and observed on the reconstructed three-dimensional images of knee joints. Mimics 13.0 (Materialise, Leuven, Belgium) was used to analyze external changes in knee joints. Histological examinations were additionally performed to clinically validate the induction of OA. Rats were killed with CO2 immediately after μ-CT was performed at 8 weeks. The tissue was fixed in 10% paraformaldehyde for 8 hours at room temperature, and the remaining fixative was removed by hand-washing after decalcification with 15% EDTA solution. After dehydration, paraffin blocks were produced by impregnation and embedding. Hematoxylin and eosin (H&E) staining was performed on knee-joint sections (4 μm thickness).
Statistical analysis
Two-way analysis of variance along with Tukey’s post hoc analysis were carried out to determine the significance of periodic changes and differences between groups (0, 4, and 8 weeks). The criterion of significance was a value of P < 0.05, and the analysis was performed using SPSS version 17.0 (IBM, Armonk, NY).
Results
Alterations of microarchitectural characteristics (BV/TV, BS/BV, Tb.Pf, Tb.N, Tb.Th, Tb.Sp)
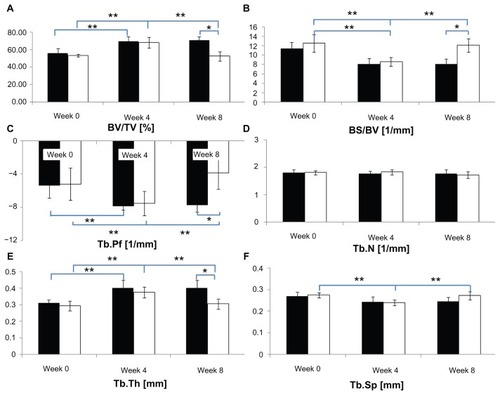
shows the periodic changes in microarchitectural characteristics for CON and OA groups and a comparison of the two groups for each week. In terms of periodic changes, comparing 4 weeks with 0 weeks, the BV/TVs of both groups significantly increased (CON group: 14.13% ± 4.40%; OA group: 15.08% ± 7.46%; P < 0.05). The BS/BVs of both groups decreased significantly (CON group: 3.39 ± 1.40 mm−1; OA group: 3.91 ± 2.19 mm−1; P < 0.05). The Tb.Pfs of both groups decreased significantly (CON group: 2.48 ± 1.21 mm−1; OA group: 2.33 ± 2.50 mm−1; P < 0.05). The Tb.Ths of both groups increased (CON group: 0.09 ± 0.05 mm; OA group: 0.08 ± 0.04 mm; P < 0.05). The Tb.Sp of the OA group decreased significantly (0.03 ± 0.02 mm; P < 0.05). Comparing 8 weeks with 4 weeks, the BV/TV of the OA group decreased significantly (15.82% ± 4.78%; P < 0.05), the BS/BV of the OA group increased significantly (3.45 ± 1.56 mm−1; P < 0.05). Tb.Pf of the OA group increased significantly (3.70 ± 1.20 mm−1; P < 0.05). The Tb.Th of the OA group decreased significantly (0.07 ± 0.03 mm; P < 0.05). The Tb.Sp of the OA group increased significantly (0.03 ± 0.01 mm; P < 0.05). No significant changes were shown in the CON group (P > 0.05). In terms of differences between the groups, no significant difference was seen at both 0 and 4 weeks (P > 0.05). However, at 8 weeks, a 18.31% ± 9.27% difference of BV/TV occurred due to the reduction (15.82% ± 4.78%) in the BV/TV of the OA (52.5% ± 6.1%) group compared to the CON group (70.8% ± 4.4%) (P < 0.05). 4.02 ± 2.25 mm−1 difference of BS/BV occurred due to an increase (3.45 ± 1.16 mm−1) in the OA group (12.10 ± 1.45 mm−1) compared to the CON group (8.08 ± 1.16 mm−1; P < 0.05). 3.88 ± 2.58 mm−1 difference of Tb.Pf at 8 weeks occurred due to an increase (3.70 ± 1.20 mm−1) in the OA group (−3.84 ± 1.99 mm−1) compared to the CON group (−7.72 ± 0.86 mm−1; P < 0.05). 0.10 ± 0.06 mm difference of Tb.Th occurred at 8 weeks due to the reduction (0.07 ± 0.03 mm) in the OA group (0.31 ± 0.03 mm) compared to the CON group (0.40 ± 0.05 mm; P < 0.05). In terms of the Tb.Sp and Tb.N, no significant differences were detected between the groups at 0, 4, or 8 weeks (P > 0.05) ().
Figure 2 (A–F) Relative variables of trabecular bone microarchitecture in the tibial epiphysis at weeks 0, 4, and 8 (black bar, control group; white bar, osteoarthritis group).
Abbreviations: BV/TV, bone volume/tissue volume; BS/BV, bone surface/bone volume; Tb.Pf, trabecular bone pattern factor; Tb.N, trabecular bone number; Tb.Th, trabecular bone thickness; Tb.Sp, trabecular bone separation.
summarizes the incidence of the micorarchitectural alterations in each microarchitectural parameter in terms of the individual analysis for the CON and OA groups. In the individual analysis, comparing 4 weeks with 0 weeks, the BV/TVs of all individuals increased. The BS/BVs of all individuals decreased. The Tb.Pfs of all in the CON group decreased, while those of two individuals in the OA group (OA1, OA3, 28.6%) increased. The Tb.Ns of four individuals in the CON and OA groups (C1, C2, C4, C5, 57.1%; OA1, OA2, OA3, OA6, 57.1%) decreased. The Tb.Ths of all individuals increased. The Tb.Sps of all individuals decreased. Comparing 8 weeks with 4 weeks, the BV/TVs of all in the OA group decreased. The BS/BVs of all in the OA group increased. The Tb.Pfs of all individuals in the OA group increased. The Tb.Ns of five individuals in the CON and OA groups (C1, C3, C4, C6, C7, 71.4%; OA1, OA2, OA3, OA5, OA7, 71.4%) decreased. The Tb.Ths of all individuals in the OA group decreased. The Tb.Sp of all animals in the CON group showed a reverse pattern compared to that of the OA group.
Table 1 Incidence of microarchitectural alterations in each microarchitectural parameter in terms of the individual analysis for control and osteoarthritis groups
Distribution of trabecular bone thickness and separation (Tb.Th and Tb.Sp distribution)
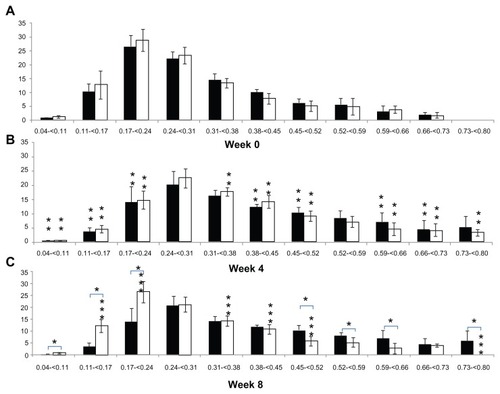
shows a comparison of the periodic changes in the Tb.Th distribution of each group. In terms of the periodic changes in Tb.Th distribution, comparing 4 weeks with 0 weeks, the percentage of Tb.Th that was less than 0.24 mm thick in the CON group decreased significantly (20.02% ± 7.33%; P < 0.05), and the percentage that was 0.38–0.52 and 0.59–0.73 mm thick increased significantly (13.82% ± 6.79%; P < 0.05). The percentage of Tb.Th that was less than 0.24 mm thick in the OA group decreased significantly (20.33% ± 10.67%; P < 0.05), like in the CON group, and the percentage that was 0.31–0.52 and 0.59–0.80 mm, in contrast to the CON group, increased (21.67% ± 7.50%; P < 0.05). Comparing 8 weeks with 4 weeks, no significant differences were detected in the percentage of Tb.Th in the CON group (P > 0.05), but the percentage of Tb.Th less than 0.24 mm thick in the OA group increased significantly (20.33% ± 6.94%; P < 0.05) and that of Tb.Th that was 0.31–0.52 and 0.59–0.80 mm thick decreased significantly (11.83% ± 3.50%; P < 0.05). In a comparison between groups, no significant difference in the Tb.Th distributions was found at 0 and 4 weeks (P > 0.05). However, the percentage of Tb.Th less than 0.24 mm thick was significantly higher (21.58 ± 11.20%; P < 0.05) in the OA group (39.73% ± 6.71%) than in the CON group (18.15% ± 6.40%), and the percentage of Tb.Th thicker than 0.45 mm, excluding those that were 0.66–0.73 mm thick in the OA group (14.16% ± 7.23%), was significantly lower (20.54% ± 14.81%; P < 0.05) than that of the CON group (34.70% ± 11.06%) at 8 weeks ().
Figure 3 Alteration of trabecular bone thickness distribution in the tibial epiphysis at weeks 0, 4, and 8 (vertical axis, trabecular bone thickness, mm; horizontal axis, bone percentage; black bar, control group; white bar, osteoarthritis group).
Abbreviations: BV/TV, bone volume/tissue volume; BS/BV, bone surface/bone volume; Tb.Pf, trabecular bone pattern factor; Tb.N, trabecular bone number; Tb.Th, trabecular bone thickness; Tb.Sp, trabecular bone separation.
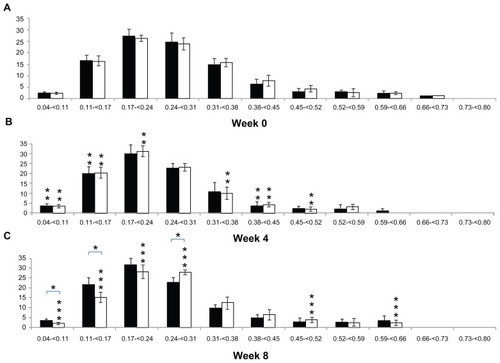
shows a comparison of the periodic changes in the Tb.Sp distribution of each group. When comparing 4 and 0 weeks, the percentage of Tb.Sp that was less than 0.17 mm in the CON group increased significantly (5.75% ± 3.07%; P < 0.05), and the percentage of Tb.Sp that was 0.38–0.45 mm decreased significantly (2.61% ± 2.48%; P < 0.05). The percentage of Tb.Sp less than 0.17 mm in the OA group, as in the CON group, increased significantly (12.69% ± 6.93%; P < 0.05) and the percentage of Tb.Sp that was 0.31–0.52 mm decreased significantly (10.72% ± 4.38%; P < 0.05). Comparing 8 weeks with 4 weeks, no significant difference was observed in the Tb.Sp distribution in the CON group (P > 0.05), but the percentage of Tb.Sp that was less than 0.24 mm in the OA group decreased significantly (12.15% ± 4.32%; P < 0.05) and the percentage of Tb.Sp that was 0.24–0.31, 0.45–0.52, and 0.59–0.66 mm in the OA group increased significantly (7.14% ± 2.22%; P < 0.05). In a comparison between groups, no significant difference was seen at 0 and 4 weeks (P > 0.05). However, the percentage of Tb.Sp that was less than 0.17 mm in the OA group (17.92% ± 2.88%) was significantly lower (8.16% ± 5.20%; P < 0.05) than in the CON group (25.46% ± 3.69%), and the percentage of Tb.Sp that was 0.24–0.31 mm in the OA group (27.86% ± 1.18%) was significantly higher (5.49% ± 1.65%; P < 0.05) than in the CON group (22.38% ± 2.16%) ().
Figure 4 (A–C) Alteration in trabecular bone separation distribution in the tibial epiphysis at weeks 0, 4, and 8 (vertical axis, trabecular bone separation, mm; horizontal axis, bone percentage; black bar, control group; white bar, osteoarthritis group).
Bone mineral density
The mean changes in vBMD of the CON and OA groups during the 8-week follow-up are shown in . In terms of periodic changes, comparing 4 weeks with 0 weeks, the vBMD of both groups significantly increased (CON group 0.12 ± 0.06 g/cm3, OA group 0.11 ± 0.06 g/cm3; P < 0.05). Comparing 8 weeks with 4 weeks, the vBMD of the OA group decreased significantly (0.14 ± 0.04 g/cm3; P < 0.05), while no significant changes were shown in the CON group (P > 0.05). In terms of differences between the groups, at 8 weeks, 0.16 ± 0.08 g/cm3 difference in vBMD occurred due to the reduction (0.14 ± 0.04 g/cm3) in the vBMD of the OA (0.31 ± 0.05 g/cm3) group compared to the CON group (0.47 ± 0.05 g/cm3, P < 0.05).
Table 2 Changes in bone mineral density (vBMD) of control and osteoarthritis groups at 0, 4, and 8 weeks
Validation of OA induction
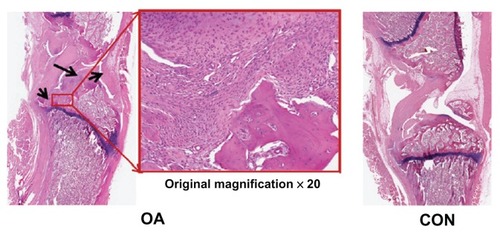
and show the external changes in the tibial epiphysis of the knee joints and the level of damage in the OA groups in the reconstructed three-dimensional and histological images. No external changes, such as deformities or irregularity, occurred on the reconstructed three-dimensional μ-CT images of the OA group at 0 or 4 weeks. In contrast, local bone erosion and osteophytes in both the medial and lateral part of the tibia were evident in the OA group at 8 weeks, accompanied by irregular bone caused by osteophytes at the tibial and femoral joints (). In the histological image (), as shown in the radiographic image of the CON group, the histological image of the knee joint in the CON group showed no deformity or irregularity in external appearance. In contrast, in the representative H&E staining section of the OA group, symptoms of OA, such as cartilage damage, local bone erosion, synovitis, and pannus formation, were evident. Focal erosive area (posteroproximal end of the tibial epiphysis) is well correlated with the three-dimensional radiographic image of the OA group at 8 weeks. Magnification of degraded bone area showed a significant aggregate cell marker staining with few osteoclasts (multinucleate lining cells) in the subchondral bone regions adjacent to the osteochondral interface. In particular, synovial cell nuclei together with some inflammatory cells are broadly shown in the section.
Figure 5 Representative radiological results in osteoarthritic (OA group) and normal (CON group) knee joints at 0, 4, and 8 weeks (white arrowhead, bone erosion and osteophyte formation).
Abbreviations: OA, osteoarthritis; CON, control group.
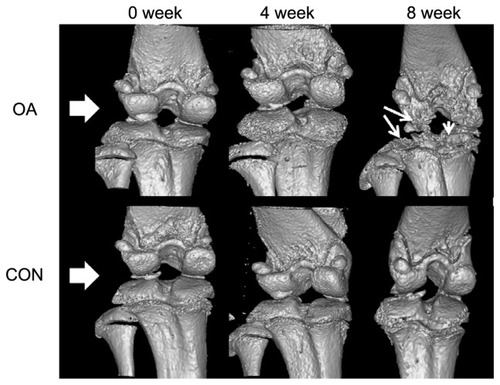
Figure 6 Representative histological sections of osteoarthritis (OA group) and normal (CON group) knee joints (black arrowheads in the ×20 magnification of the OA section show bone erosion, inflammation, pannus formation, and synovial hypertrophy).
Discussion and conclusion
Studies with animal models of induced OA are currently being carried out to understand better the bone characteristics in degenerative arthritis.Citation7,Citation13–Citation17,Citation19,Citation20 Behets et al,Citation13 Calvo et al,Citation14 El Hajjaji et al,Citation15 and Intema et alCitation20 analyzed the bone-characteristic changes in OA using animal models of surgically induced secondary OA, generally by performing anterior cruciate ligament transaction or menisectomy. However, these methods may generate inconsistent results, due to the progression of various uncontrolled weight-bearing patterns, and result in generating unexpected and unsuitable bone-characteristic changes induced by primary OA. The animal model of MIA-induced nontraumatic OA was therefore applied to overcome this limitation in this study.
MIA-induced OA is effective because it is simple to perform and induces a similar form of OA by activating matrix metalloproteinases, suppressing proteoglycan synthesis and inducing cartilage necrosis.Citation21 Despite its simplicity and appropriateness, this method has a limitation in that the symptoms of OA increase with MIA dose.Citation18 However, the time of OA symptom onset was 15–21 days after injection of 0.3–3 mg of MIA, and the severity of OA is consistent in terms of histological scoring (ie, histological score 21.56 ± 0.50 at 0.3 mg, 22.78 ± 0.49 at 3 mg). Indeed, 1 mg MIA was used to induce OA in the studies by Piscaer et alCitation7 and Guzman et al,Citation19 as it was in the present study. Nevertheless, the previous studies were limited in terms of detecting different changes in bone microarchitecture because they evaluated the degree of induced OA by examining the level of proteoglycan loss in cartilage, histological scoring, and bone quantity.Citation7,Citation18,Citation19,Citation24,Citation25 Therefore, additional studies are needed to determine the MIA dose after inspecting the degree of induced OA according to MIA dose in view of the changes in bone microarchitecture. This will be investigated in a future study, the results of which may increase confidence in the results presented here.
The results obtained in the present study indicate that OA causes no damage to trabecular bone microarchitecture in the tibial epiphysis until 4 weeks after OA induction. However, at 8 weeks, significant changes were noted. Other than Tb.N, all other microarchitectural parameters decreased, and BS/BV, Tb.Sp, and Tb.Pf increased significantly in the OA group (P < 0.05). Thus, the bone-volume fraction decreased and bone turnover rate was accelerated in the OA group, and subsequently trabecular bone thickness decreased and trabecular bone connections became weaker. However, no significant changes were observed in trabecular bone number, despite the huge quantitative loss of BV/TV, meaning that the loss of BV/TV was caused by trabecular bone thickness rather than trabecular bone number. Thus, the reduced BV/TV was due to further trabecular bone separation caused by reduction in trabecular bone thickness. These facts were verified by analysis of both Tb.Th and Tb.Sp distribution specifically. Having examined the result of the distribution, the proportion of relatively thin trabecular bone increased, while that of thick trabecular bone decreased as OA progressed. Also, the percentage of close trabecular bone separation decreased and that of distant trabecular bone separation increased. This indicates that the quantitative loss of trabecular bone microarchitecture caused by the qualitative loss may eventually occur during the course of OA. In previous reports on trabecular bone microarchitecture characteristics 8 weeks after induction of OA, BV/TV, Tb.Th, and Tb.Sp of the OA group showed about 41.1%, 28.8%, and 75.9% differences, respectively, compared to the normal group in a study by Kamibayashi et al.Citation12 Also, BV/TV, Tb.Th, Tb.Sp, and Tb.Pf of the OA group showed about 18.2%, 7.0%, 2.8%, and 33.3% differences, respectively, compared to the normal group in a study by Koh et al.Citation17 In the case of previous reports on changes in vBMD after induction of OA, McErlain et alCitation27 reported that no significant difference in vBMD was shown comparing 4 to 0 weeks in the OA group (P > 0.05), whereas significant differences were shown at 8 weeks compared to 0 weeks (OA approximately 26% difference, P < 0.05), and Batiste et alCitation28 also reported that vBMD was decreased significantly through 4–8 weeks postinduction in the OA group (approximately 20% decrease of vBMD, P < 0.01). Taken together, OA caused a reduction in trabecular bone microarchitecture and vBMD compared to controlled knee joints. The results are similar to the pattern of vBMD and bone microarchitecture reduction in this study.
Nevertheless, numerical differences in trabecular bone microarchitectural parameters occurred compared with previous studies. In other words, the level of OA symptoms and its progress can be affected by the undefined individual animal’s ability to adapt, which itself depends on its difference of individual physical ability, eating habits, or by the hands of different invesitigators.Citation23 Therefore, one must analyze the level of undefined individual adaptation ability by quantifying the results of video-camera monitoring of real-time behavioral patterns, along with regular clinical and pathological examination of animals; one can thereby improve the accuracy of results. Therefore, we are currently investigating these ideas in an ongoing study, the results of which may increase confidence in the results presented here. Inspection of trabecular bone microarchitecture changes according to the MIA dose, correlation between changes in cartilage and those in the endochondrial microarchitecture, the elimination of experimental errors, detailed trace studies, and analysis of real mechanical rigidity changes in trabecular bone microarchitecture will improve the reliability of our conclusions. We plan to undertake this research and publish the results. However, the significance of the data we present here is that they overcome some of the limitations of previous studies by tracing changes in trabecular bone microarchitecture characteristics continuously and individually. The analytical method used in this study is also expected to be applied to analyze the efficacy of various anti-inflammatory and antiresorptive agents in terms of improvements in trabecular bone quality.
Acknowledgments
This study was supported by a grant from the Korea Healthcare Technology R&D Project, Ministry for Health, Welfare, and Family Affairs, South Korea (A100023).
Disclosure
The authors report no conflicts of interest in this work.
References
- AltmanRAschEBlochDDevelopment of criteria for the classification and reporting of osteoarthritis. Classification of osteoarthritis of the knee. Diagnostic and Therapeutic Criteria Committee of the American Rheumatism AssociationArthritis Rheum1986298103910493741515
- HintonRMoodyRLDavisAWThomasSFOsteoarthritis: diagnosis and therapeutic considerationsAm Fam Physician200265584184811898956
- JacksonDWSimonTMAbermanHMSymptomatic articular cartilage degeneration: the impact in the new millenniumClin Orthop Relat Res2001391SupplS142511603698
- LawrenceRCHelmickCGArnettFCEstimates of the prevalence of arthritis and selected musculoskeletal disorders in the United StatesArthritis Rheum19984157787999588729
- GoldringMBGoldringSRArticular cartilage and subchondral bone in the pathogenesis of osteoarthritisAnn N Y Acad Sci2010119223023720392241
- PooleARRizkallaGIonescuMOsteoarthritis in the human knee: a dynamic process of cartilage matrix degradation, synthesis and reorganizationAgents Actions199339313
- PiscaerTMWaarsingJHKopsNIn vivo imaging of cartilage degeneration using microCT-arthrographyOsteoarthritis Cartilage20081691011101718342549
- ManidakisNDosaniADimitriouRStengelDMatthewsSGiannoudisPTibial plateau fractures: functional outcome and incidence of osteoarthritis in 125 casesInt Orthop201034456557019440710
- BrooksPMDayRONonsteroidal antiinflammatory drugs – differences and similaritiesN Engl J Med199132424171617252034249
- ColeBJBergerRGoldbergVMRosenbergALower extremity considerations: kneeMoskowitzRWAltmanRDHochbergMCBuckwalterJAOsteoarthritis: Diagnosis and Medical/Surgical Management4th edPhiladelpiaWB Saunders2007395412
- BarrettJFKeatNArtifacts in CT: recognition and avoidanceRadiographics20042461679169115537976
- KamibayashiLWyssUPCookeTDZeeBTrabecular microstructure in the medial condyle of the proximal tibia of patients with knee osteoarthritisBone199517127357577155
- BehetsCWilliamsJMChappardDDevogelaerJPManicourtDHEffects of calcitonin on subchondral trabecular bone changes and on osteoarthritic cartilage lesions after acute anterior cruciate ligament deficiencyJ Bone Miner Res200419111821182615476582
- CalvoECastanedaSLargoRFernandez-ValleMERodriguez-SalvanesFHerrero-BeaumontGOsteoporosis increases the severity of cartilage damage in an experimental model of osteoarthritis in rabbitsOsteoarthritis Cartilage2007151697716861013
- El HajjajiHWilliamsJMDevogelaerJPLenzMEThonarEJManicourtDHTreatment with calcitonin prevents the net loss of collagen, hyaluronan and proteoglycan aggregates from cartilage in the early stages of canine experimental osteoarthritisOsteoarthritis Cartilage2004121190491115501406
- KalffKMEl MoueddenMvan EgmondJPre-treatment with capsaicin in a rat osteoarthritis model reduces the symptoms of pain and bone damage induced by monosodium iodoacetateEur J Pharmacol20106412–310811320538089
- KohYHHongSHKangHSThe effects of bone turnover rate on subchondral trabecular bone structure and cartilage damage in the osteoarthritis rat modelRheumatol Int20103091165117119711077
- GuingampCGegout-PottiePPhilippeLTerlainBNetterPGilletPMono-iodoacetate-induced experimental osteoarthritis: a dose-response study of loss of mobility, morphology, and biochemistryArthritis Rheum1997409167016799324022
- GuzmanREEvansMGBoveSMorenkoBKilgoreKMono-iodoacetate-induced histologic changes in subchondral bone and articular cartilage of rat femorotibial joints: an animal model of osteoarthritisToxicol Pathol200331661962414585729
- IntemaFHazewinkelHAGouwensDIn early OA, thinning of the subchondral plate is directly related to cartilage damage: results from a canine ACLT-meniscectomy modelOsteoarthritis Cartilage201018569169820175978
- JanuszMJHookfinEBHeitmeyerSAModeration of iodoacetate-induced experimental osteoarthritis in rats by matrix metalloproteinase inhibitorsOsteoarthritis Cartilage20019875176011795995
- YangXMengYLuoQGongHHigh resolution in vivo micro-CT with flat panel detector based on amorphous siliconJ Xray Sci Technol201018438139221045275
- SmithMMLittleCBExperimental models of osteoarthritisMoskowitzRWAltmanRDHochbergMCBuckwalterJAGoldbergVMOsteoarthritis: Diagnosis and Medical/Surgical Management4th edPhiladelpiaWB Saunders2007118
- PomonisJDBouletJMGottshallSLDevelopment and pharmacological characterization of a rat model of osteoarthritis painPain2005114333934615777859
- NagaseHKumakuraSShimadaKEstablishment of a novel objective and quantitative method to assess pain-related behavior in monosodium iodoacetate-induced osteoarthritis in rat kneeJ Pharmacol Toxicol Methods2012651293622037051
- LaibAKumerJLMajumdarSLaneNEThe temporal changes of trabecular architecture in ovariectomized rats assessed by MicroCTOsteoporos Int2001121193694111804020
- McErlainDDUliciVDarlingMAn in vivo investigation of the initiation and progression of subchondral cysts in a rodent model of secondary osteoarthritisArthritis Res Ther2012141R2622304985
- BatisteDLKirkleyALavertySThainLMSpougeARHoldsworthDWEx vivo characterization of articular cartilage and bone lesions in a rabbit ACL transection model of osteoarthritis using MRI and micro-CTOsteoarthritis Cartilage2004121298699615564066