Abstract
Objectives
To describe change in functional ability in the oldest-old population during 3 years and examine its relation to life satisfaction (LS). A total of 681 individuals aged 78 and older from the population-based study Good Aging in Skåne took part.
Methods
Functional ability was assessed using Sonn and Åsberg’s Activities of Daily Living (ADL) scale and related to LS assessed by Neugarten et al’s Life Satisfaction Index A (LSI-A).
Results
Fifty-one percent of 87–93-year-olds reported ADL decline during 3 years. Individuals reporting impaired ADL had a mean LSI-A value of 23.0 compared to 26.4 in those unchanged. ADL decline had a stronger negative effect on LS in the younger group (78–84 years), r = 0.207, P < 0.001. In a multiple regression model, one score’s decline in ADL capacity corresponded to 1.5 scores lower LS (P < 0.001).
Discussion
Effort put into keeping the oldest old on a high level of functional ability has the potential to maintain the LS of this population.
Introduction
During the last few decades, there has been great optimism in gerontology due to increased longevity and improved health and quality of life in the elderly population. Researchers such as Baltes and Smith, though, have highlighted the vast difference in prerequisites of the young old and the oldest old, and called for caution in optimism concerning the latter group: the more vulnerable, frail and those “at the limits of their functional ability.”Citation1 Different definitions are in use when it comes to the term “oldest old”; some use it for individuals aged 85 and above, some use 80 as the lower limit. In this study, we chose the latter limit to increase power in the study.
Baltes is well known for his aging theory of selective optimization with compensation (SOC).Citation2 Very briefly, selection implies focusing on areas of high priority as age-related losses in functioning put a limit to previous possibilities. Optimization means investing in behaviors that augment and maximize reserve capacities, and compensation means finding ways – for example, psychological or technological – to compensate for losses. In this framework, he concludes that as people age, the discrepancy between subjective and objective health increases. The elderly individual assesses his/her health as much better than an outside observer would as a psychological means of nurturing well-being and life satisfaction (LS) facing decreasing functional ability and other signs of declining health. Psychological coping strategies have been shown to mediate the effect between declining health and well-being.Citation3 In the oldest old, the capacity to adapt and apply strategies to compensate is pushed to the limit as functional ability decreases; LS is thereby threatened.Citation1
We hypothesized that the ability to compensate for decreasing functional ability measured as diminished activities of daily living (ADL) capacity is exceeded in the oldest old and LS is threatened. This would be true even after controlling for factors such as age, number of symptoms, depressive mood, and personality factors previously known to affect LSCitation4,Citation5 and interact with functional ability. Studies in this area on the oldest old are rare, which is why we had to look for references in studies on somewhat younger individuals.
Asakawa et alCitation6 followed 692 elderly people in Japan for 2 years. All were functionally intact at baseline. Among those, 12.3% experienced functional decline during the follow-up. Those subjects also reported a shrinking social network, increasing depressive symptoms, and lower LS than those that remained functionally intact. Avlund et alCitation7 confirmed that people with decreased functional ability also have a diminished social network, something that is often considered a buffer against the negative impact of declining health.
Bowling and GrundyCitation8 found that worse overall health and functional decline were the most significant predictors of lower LS and more depressive symptoms among people aged 65–84 years in a 3-year follow-up. Studies have also pointed to the fact that the sense of security and the feeling that help (from relatives and/or society) is available reduces the negative influence that functional ability has on LS.Citation9
A paper studying people aged 65 and above in six European countries living with reduced ADL capacityCitation10 concluded that it is not the reduced ADL capacity in itself that influences LS, but rather personality factors such as self-esteem, feeling worried, and the person’s perception of their health. These three factors came out as significant in all six countries taking part in the study, whereas financial and social resources were significant in four out of six countries. But in a Swedish study by Hellström et al,Citation11 a reduced ADL capacity per se led to significantly lower LS among Swedish people aged 75 and above.
The rapid growth of the oldest-old population will mean increasing numbers of people living with some kind of functional disability. The search for clues of how to maintain LS while facing declining functional ability in the oldest old is of great importance.
The aim of this study was to describe the change in functional ability in the oldest-old population during 3 years. The aim was also to analyze possible associations between changes in functional ability during the 3-year follow-up and LS adjusted for possible covariates.
Methods
Study population
The material in this study is from a longitudinal, randomized, population-based study of the elderly called Good Aging in Skåne (GÅS), which is part of the Swedish National Study on Aging and Care.Citation12 It started in 2001 and includes 2931 subjects aged 60 and above. Those aged 78 and above were chosen for this paper. Subjects were reexamined after a 3-year interval.
Five municipalities in southern Sweden were included. Participants underwent medical examination and functional tests, and filled in a questionnaire with identical study protocols at both examinations. Examination took place either at the clinic or in the participant’s home. Informed consent was obtained from the participant and when needed from relatives.Citation12
At baseline, 1253 individuals 78–93 years old participated. Of those, 314 died, eight moved from the area, and 250 chose not to take part in the reexamination. The study population consisted of the 681 individuals who came to the reexamination, including six age cohorts: 78, 81, 84, 87, 90, and 93 years. There was no difference in attrition between men and women, but the participants aged 87 and above had significantly higher attrition for the Life Satisfaction Index A (LSI-A) variable (P < 0.001). A total of 109 individuals did not answer the LSI-A questionnaire in the rexamination (15.9%); those individuals had significantly lower LSI-A in baseline examination (22.6 compared to 26.4 in the group that answered LSI-A at reexamination, P < 0.001). For further details on attrition, refer to Enkvist et al.Citation13
Questionnaires
Neugarten’s LSI-A was used to assess LS.Citation14 It consists of five components of life satisfaction: zest versus apathy; resolution and fortitude; congruence between desired and achieved goals; positive self-concept; and mood tone. It includes 20 questions, scored from 0 to 2, for which participants had three possible answers to choose from: “disagree,” “doubtful,” and “agree.” A high score thus indicates high LS (range 0–40). Cronbach’s alpha reliability for internal consistency was established by Neugarten.Citation14 In our material, Cronbach’s alpha was 0.78.
Functional ability was assessed through self-report according to Sonn and Åsberg’s ADL scale, the revised version.Citation15 The nine activities included in the ADL staircase are divided into four instrumental activities (i-ADL): transportation, cleaning, grocery shopping, and cooking; and five personal activities (p-ADL): bathing, dressing and undressing, toileting, mobility, and food intake. In our study, transportation was excluded due to high attrition for this item. Incontinence was excluded, since this has been considered an ability rather than an activity. In their study, Sonn and Åsberg also tested the scale and found good validity, and reliability was estimated at 0.9 using the Kuder–Richardson formula (KR-20). KR-20 is analogous to Cronbach’s alpha, and a value above 0.65 is considered acceptable. In our study, Cronbach’s alpha for ADL at baseline was 0.84.
The ADL staircase refers to the fact that the activities in the instrument can be arranged cumulatively in the form of a comprehensive nine-step ordinal scale (0–8), where 0 is given for a completely independent individual and 8 to someone dependent in all activities. Individuals needing assistance in activities such as food intake, the highest step, are likely to be dependent in all activities further down the staircase.Citation16 Change in the ADL staircase was calculated as ADL at baseline minus ADL at reexamination. ADL was assessed with identical protocols at baseline and reexamination.
The Montgomery–Åsberg Depression Rating Scale is a subscale of the Comprehensive Psychopathological Rating Scale (CPRS),Citation17 and was used to assess depressive mood. It includes ten questions, each graded in six steps concerning anxiety, sleep, appetite, concentration, initiative, emotional involvement, content of thoughts, and basic mood during the last 3 days. The score ranges from 0 to 60, where 0–6 indicates mental well-being, 7–34 mild to moderate depressive mood, and 35–60 severely depressive mood.Citation18 In our population, no subject scored above 35, so this variable could be split in two groups: 1 for nondepressive (n = 507) and 2 (n = 117) for mildly to moderately depressive mood. The first group had a mean score of 1.7 (standard deviation [SD] 1.9), while the second group’s mean score was 11.3 (SD 4.9).
The number of symptoms was rated with a modified version of the symptom scale from the Göteborg Quality of Life Instrument.Citation19 Originally, the instrument included 30 symptoms; in the GÅS project, the following seven symptoms were added: difficulty walking, difficulty expressing myself verbally, difficulty swallowing, memory impairment, urinary and fecal incontinence, and slow-healing wounds. It thus contained 37 common physical and psychiatric symptoms, such as headache, obstipation, musculoskeletal pain, fatigue, restlessness, low-spiritedness, and sleeping disturbances. Participants responded with “yes” or “no” to whether they had had symptoms during the last 3 months. The score thus ranged from 0 to 37, with a mean value of 11.8 (SD 6.3).
The health locus of control (LoC) scaleCitation20 contains three subscales, one assessing internal LoC, the perception that the individual himself has the main control over his health. “LoC power” represents the notion that health status is mainly in the hands of powerful others, family members, or healthcare professionals. “LoC chance” stands for the perceived importance of luck or fate as the main determinant of personal health. The score of each subscale ranges from 6 to 30, with a higher number indicating stronger beliefs in the aspect of LoC represented by the subscale.
Financial resources were assessed by the question: “Do your financial means cover your needs?” There were five possible answers: “very well,” “well,” “neither well nor insufficient,” “poorly,” and “not at all”. The first two alternatives were categorized as sufficient, and the last three as insufficient.
Married or cohabiting subjects were categorized as married, and singles, widows/widowers, and divorced subjects as singles.
Activities were subjected to a principal component analysis. The correlation matrix revealed many coefficients above 0.3. The Kayser–Meyer–Olkin value was 0.82, and Bartlett’s test of sphericity reached significance (P < 0.001), supporting factorability of the correlation matrix. After inspection of the scree plot, three factors were used for further analysis: social, cultural, and leisure-time activities. Meeting friends/relatives, participation in study circles and nonprofit organizations, and going to restaurants were categorized as social activities. Cultural activities included going to concerts, theaters, movies, museums, art exhibitions, shows, musicals, and attending church services. Finally, leisure-time activities included long walks, gardening, repairing of cars or mechanical equipment, and traveling. Participants that had taken part at least once a year were categorized as active.
Domestic aid was assessed using the questions: “Do you receive help from relatives?” and “Do you receive help from the community?”
The subject was asked if he/she used any walking aids inor outdoors. Answers were categorized as “yes” or “no.”
The subjects were categorized into two groups depending on whether their level of education was elementary school or high school and/or university.
Ethics
The study was approved by the regional ethics committee at Lund University, registration no LU 744-00. All subjects provided written consent for participation in the study.
Statistical methods
Differences in proportions in ADL change between men and women, the younger and the older age-group, higher/lower education, and married/single were tested with the chi-squared test ().
Table 1 Changes in activities of daily living (ADL) functioning broken down by sex, age, marital status, education, and included subitems
The population was stratified by gender, age, marital status, and education. Analysis of variance (ANOVA) was used to calculate mean LSI values for functionally impaired, unchanged, and improved in each group ().
Table 2 Comparison of mean Life Satisfaction Index A (LSI-A) value at reexamination for unchanged, impaired, and improved activities of daily living (ADL) stratified by sex, age, marital status and education
Differences in mean values of LSI-A at reexamination regarding sex, age, marital status, education, walking aids, economic sufficiency, help from relatives, social services, and social, cultural, and leisure-time activities were tested with Student’s t-test (). The LSI-A was normally distributed.
Table 3 Comparison of means of Life Satisfaction Index A (LSI-A, range 0–40) at reexamination and variables at baseline examination
Correlations between LSI-A at reexamination and difference in ADL, depressive mood, and number of symptoms in the baseline examination were calculated using Spearman’s correlation coefficient rho due to skewed distribution (). A linear multiple regression model was constructed with LSI as dependent variable, and regression coefficients were calculated. Independent variables included in the regression model were those that showed significant differences associated with levels of LSI-A when the level of significance was set to P < 0.2. The higher P-value, compared to the more common value of <0.05, was chosen not to exclude variables that might have a decisive influence on LS.
All statistical tests were two-sided. Data analysis was performed using SPSS software version 18.0 (IBM, Armonk, NY).
Results
A total of 177 individuals (30%) reported impaired ADL function 3 years later, 82 of which were impaired by one step, 44 two steps, 24 three steps, 13 four steps, 8 five steps, 4 six steps, and 2 seven steps. On average, this group had declined by 1.7 steps in ADL-function. A total of 367 individuals (62%) reported unchanged ADL, while 44 (8%) scored higher in the reexamination, of whom 40 had increased in ADL function by one step, three subjects by two, and one by three steps. The whole study population was impaired by a mean value of 0.6 steps in the ADL staircase during the 3 years. The younger group – individuals aged 78–84 years – were impaired by 0.4 steps compared to the older group – individuals aged 87–93 – which decreased by 1.0 step (P < 0.001). The greatest decline in ADL was, as might be expected, in the older group, in which 51% reported a decline during the 3 years, compared to 23% among the younger subjects (P < 0.001). Even if results were not significant, the tendency was that more men reported impaired ADL compared to women: 32.1% compared to 28.8% (). When the different items in the ADL staircase were separated, the greatest declines were reported for cleaning, grocery shopping, and cooking.
Differences in mean LSI value stratified for sex, age, marital status, and education were compared for unchanged, impaired, and improved ADL function (). The group that reported impaired ADL had a mean LSI value of 23.0 compared to 26.4 in the group that was unchanged (P < 0.001) (). There were significant differences in LSI-A between all groups except for the married group. Post hoc tests (Tukey) revealed significant differences at the <0.05 level between unchanged and impaired ADL for men, women, 87–93-year-olds, and the group with lower education. For 78–84-year-olds, singles, and the higher educated, differences were significant between unchanged and impaired ADL, as well as for impaired and improved ADL. For married subjects, there were no significant differences depending on change in ADL.
A higher mean value of LSI-A was noted for male gender, lower age, being married, higher education, being without walking aids, better economy, managing without help from family or social services, partaking in different activities, and no depressive mood (). A negative correlation was found between LSI-A and impaired ADL, locus of control chance, and a higher number of symptoms and depressive symptoms, in contrast to a positive correlation for locus of control internal and power ().
Table 4 Correlations between LSI-A at reexamination and parameters from baseline examination
A linear multiple regression model was constructed in order to control for factors previously known to affect LS, such as age, number of symptoms, depressive mood, and personality factors, and factors such as walking aids and help from society or relatives interacting with functional ability. In the adjusted regression model difference in ADL, depressive mood, number of symptoms, health locus of control, education, and marital status in the baseline examination explained levels of LS 3 years later ().
Table 5 A multiple linear regression model with independent variables from baseline examination and Life Satisfaction Index 3 years later as dependent variable
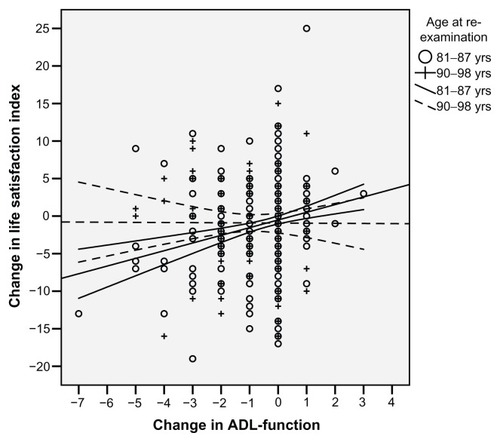
Associations between changes of LSI from baseline to reexamination and change in ADL were analysed and stratified for age (), and the younger group showed a positive association (r = 0.207 [P < 0.001]) in contrast to the older group (r = −0.009 [P = 0.921]).
Figure 1 Change in Life Satisfaction Index A (LSI-A) from baseline to reexamination depending on change in activities of daily living (ADL) in the same period between the younger and the older group (P = 0.0273).
Discussion
As we hypothesized, decline in ADL function predicted lower LS, as did more symptoms independently. Higher education, more internal locus of control, and cohabiting were also related to higher LS. This is in line with results from our previous study.Citation5 Decline in ADL capacity was significantly associated with lower LS, even after adjusting for partaking in social, cultural, and leisure-time activities, age, and other independent factors like economical sufficiency and social support. Reconnecting with Baltes’ SOC theory discussed in the introduction,Citation2 we conclude that in today’s society, the ability to apply SOC strategies to overcome the threat that declining functional ability constitutes on LS is limited.
Twenty-three percent of the 78–84-year-old group showed a decline in ADL function compared to 51% in the older group. This represents an increased vulnerability in the higher ages, even if this group constitutes “survivors.” The main decline was seen in the I-ADL items. (One step’s decline in the ADL staircase means losing independence in one item; for example, not being able to do one’s own grocery shopping or cooking anymore.)
Interestingly, when comparing the older group in our population to the somewhat younger one, it seems the oldest group is less affected in LS when ADL-function decreases. This could reflect lower expectations and more readiness to accept functional decline in the 87–93-year-old group. Other factors, such as an increasing burden from symptoms or losing a spouse or close friends, could have an even higher impact than declining functional ability on LS. However, the 78–93-year-old group with impaired ADL did show lower LS than the same group with unchanged ADL. In the 78–84- year-old group, there was a decline in LS as ADL declined. This could reflect a life crisis in individuals having enjoyed a totally independent life suddenly having to face needing help from spouses or formal care from society.
Functional ability in terms of number of symptoms is one of the most tangible aspects by which the elderly person perceives his health. In our previous workCitation5,Citation13 conducted on the same population, the burden of symptoms had significant influence on LS, especially symptoms in the following categories: depression, tension, gastrointestinal, and musculoskeletal. Specific diagnoses such as heart failure, dementia, stroke, or fracture did not have as strong an influence on LS as the burden of symptoms. The elderly individual seems to perceive his health based on his experiences of daily life rather than objective medical findings, and the elderly person’s perceived health has been shown to influence his LS.Citation21
Asakawa et alCitation6 noted an increase in depressive symptoms with declining functional ability, but it has also been discussed that preventing and treating depression in old age might reduce functional decline.Citation22 Here lies the potential for interdisciplinary interaction to reach results that increase the LS of the elderly.
Our results suggest that a lower functional ability results in lower LS, regardless of the availability of help from community or family caregivers. Though not significant, there was a negative association between receiving help and LS. This might seem contradictory, but the impact on the elderly of having no choice but to receive public services has been related to psychological strain,Citation23 potentially negatively influencing LS. The negative association was there even for receiving help from relatives, and should probably be interpreted as an effect of the elderly persons’ loss of independence rather than having a relative prepared to help. Though the comfort of the presence of loved ones was a positive aspect, feelings of guilt for being a burden on relatives were also evident in Janlöv et al’s study,Citation23 and could further explain the negative association with LS.
In Asakawa et al’s study,Citation6 those reporting impaired functional ability also reported a shrinking social network and lower LS than those that remained functionally intact. We included partaking in different activities as a measure of the subjects’ social life and ability to be a part of the world around them. Impaired functional ability resulted in lower LS even after this adjustment, but being married or cohabiting was associated with higher LS. Living with a spouse could, apart from providing social anchorage, buffer a decline in functional ability, as some degree of help is more available than to those living alone. The need for social services might thus be less pronounced.
Economical sufficiency did not come out as a significant factor in the regression model. Perhaps a reason for this is that the Swedish health-care system provides health care, social services, and different kinds of aids at little or no cost, buffering the impaired functional ability without the extra burden of financial worries.
The study population comprised a sample from the general population covering urban as well as rural areas. It was randomly selected using the Population Registry, thereby increasing generalization of results to the older general population. Higher ages were also included, and no exclusion was made for subjects living in residential care or homes for the elderly. Home visits were made in almost every third case to reduce selection bias. Social, medical, and psychological aspects were included in the model. Further strengths in this study are the longitudinal design and that it comprises a broad context of health-related and psychosocial factors. The instruments used in this study (such as Neugarten, ADL, and CPRS) were standardized and internationally well-known instruments that have shown good reliability in previous validations.Citation14–Citation17 Proxy information was retrieved from next of kin and ward staff to ensure validity and completeness of information. Cognitive assessment by medical examination was done for all participants in a standardized way.
In the attrition analysis, it was noted that the younger participants who were more satisfied with life and had fewer depressive and physical symptoms were those that came back to the reexamination.Citation5 Respondents from the 87–93-year-old group constitute the main attrition in LSI-A. If these had been included, the correlation between age and decline in ADL would have been even stronger, since functional ability declines with higher age. Furthermore, the lack of association between changes of ADL and changes in LS among the oldest old might be influenced by selection bias in this group. People with severe dementia were not able to complete the questionnaire, and this condition is more prevalent with age and related to decline in functioning, thereby introducing possible bias. Efforts were made to include proxy information if possible.
One advantage of using the ADL scale is that each step is represented by a defined categorization, which makes it easy to compare different individuals’ improvement or decline in ADL. It is important to remember that the steps of the scale are not equivalent, and that differences in the experience of the various steps will vary among individuals. In addition, individual differences exist between individuals on the same step.Citation16
The ADL scale is a rather coarse instrument in measuring functional ability, not able to capture milder limitations that might nevertheless be experienced as a great hindrance to the person affected. In a Swedish investigation of almost 1300 people aged 60–89 years, half of the respondents reported feeling hindered by health problems in spite of having no decline in the ADL scale.Citation9 Even milder declines in functional ability, not measurable by ADL, have been shown to be connected with lower LS.Citation6
Conclusion
High LS throughout the life span is an attractive goal to the elderly individual as well as to anyone privately or professionally engaged with individuals in this age-group. The above results confirm the hypothesis that reduced functional ability leads to lower LS, even after controlling for confounders. The results also suggest that investing in the maintenance and/or restoration of ADL capacity in the age-group 78–84 years has the potential to preserve or even increase the LS of the oldest old. If this association is not as strong for the older group, aged 87–93 years, this has consequences for how far different kinds of treatment strategies should be pushed. More research is needed to confirm and further explore these results. Another interesting area for further research would be an intervention study, testing effects on LS after rehabilitation efforts in this age-group.
Disclosure
The authors report no conflicts of interest in this work.
References
- BaltesPSmithJNew frontiers in the future of aging: from successful aging of the young old to the dilemmas of the fourth ageGerontology200349212313512574672
- BaltesPBaltesMSuccessful Aging: Perspectives from the Behavioral SciencesCambridgeCambridge University Press1990
- JonkerAAComijsHCKeesKCDeegDJThe role of coping resources on change in well-being during persistent health declineJ Aging Health20092181063108219833864
- BergAIHassingLBMclearnGEJohanssonBWhat matters for life satisfaction in the oldest-old?Aging Ment Health200610325726316777653
- EnkvistÅEkströmHElmståhlSWhat factors affect life satisfaction (LS) in the oldest-old?Arch Gerontol Geriatr201254114014521555158
- AsakawaTKoyanoWAndoTShibataHEffects of functional decline on quality of life among the Japanese elderlyInt J Aging Hum Dev200050431932811087110
- AvlundKDuePHolsteinBEHeikkinenRLBergSChanges in social relations in old age. Are they influenced by functional ability?Aging Clin Exp Res200214Suppl 3566412475134
- BowlingAGrundyEActivities of daily living: changes in functional ability in three samples of elderly and very elderly peopleAge Ageing19972621071149177667
- FagerströmCHolstGHallbergIRFeeling hindered by health problems and functional ability at 60 years and aboveArch Gerontol Geriatr200744218120116820228
- BorgCFagerströmCBalducciCLife satisfaction in 6 European countries: the relationship to health, self-esteem and social and financial resources among people (aged 65–89) with reduced functional abilityGeriatr Nurs2008291485718267177
- HellströmYAnderssonMHallbergIRQuality of life among older people in Sweden receiving help from informal and/or formal helpers at home or in special accomodationHealth Soc Care Community200412650451615717897
- EkströmHDahlin IvanoffSElmståhlSRestriction in social participation and lower life satisfaction among fractured in pain. Results from the population study “Good aging in Skåne”Arch Gerontol Geriatr200846340942417662482
- EnkvistÅEkströmHElmståhlSLife satisfaction and symptoms among the oldest-old: results from the population study called Good Ageing in SkåneArch Gerontol Geriatr201254114615021632126
- NeugartenBLHavighurstRJTobinSSThe measurement of life satisfactionJ Gerontol19611613414313728508
- SonnUÅsbergKHAssessment of activities of daily living in the elderly. A study of a population of 76-year-olds in Gothenburg, SwedenScand J Rehab Med1991234187191
- ÅsbergKHSonnUThe cumulative structure of personal and instrumental ADL. A study of elderly people in a health service districtScand J Rehab Med1988214171177
- MontgomerySAAsbergMA new depression scale designed to be sensitive to changeBr J Psychiatry1979134382389444788
- SnaithRPHarropFMNewbyDTealeCGrade scores of the Montgomery-Asberg Depression and the Clinical Anxiety ScalesBr J Psychol1986148599601
- TibblinGTibblinBPecivaSKullmanSSvärdsuddK“The Göteborg quality of life instrument” – an assessment of well-being and symptoms among men born 1913 and 1923. Methods and ValidityScand J Prim Health Care Suppl1990133382100362
- WalstonBSWalstonKAKaplanGDMaidesSADevelopment and validation of the Health Locus of Control (HLC) ScaleJ Consult Clin Psychol1976444580585939841
- HilleråsPJormAFHerlitzAWinbladBLife satisfaction among the very old: a survey on a cognitively intact sample aged 90 years or aboveInt J Aging Hum Dev2001521719011310575
- PalmoreEBBurchettBMPredictors of disability in the final year of lifeJ Aging Health19979328329710182394
- JanlövACHallbergIRPeterssonKOlder persons’ experience of being assessed for and receiving public home help: do they have any influence over it?Health Soc Care Community2006141263616324185