
Abstract
Background
Histone deacetylase 9 (HDAC9) is a member of the HDAC gene family that plays essential roles in the organization of transcriptional regulation by catalyzing deacetylation of histone proteins. However, the effects of HDAC9 on osteonecrosis of femoral head (ONFH) have not been investigated. The present study aimed to reveal whether histone deacetylase 9 (HDAC9) regulated osteogenic differentiation.
Methods
A lentiviral knockdown HDAC9 model was established in hBMSCs. Osteoblast-specific gene expression, such as Runx2, OCN was examined by qRT-PCR and Western blot, respectively. Though transcriptome sequencing and enrichment analysis, related signal pathways caused by down-regulation of HDAC9 were screened. The effect of HDAC9 on MAPK signaling pathway was determined by Western blot. Eventually, tert-Butylhydroquinone (tBHQ) was used to examine the effect of MAPK activation on osteogenesis in HDAC9 knockdown hBMSCs.
Results
A lentiviral knockdown HDAC9 model was successfully established in hBMSCs. HDAC9 knockdown significantly inhibited osteoblast-specific gene expression, such as runt-related transcription factor 2 (Runx2), osteocalcin (OCN) and mineral deposition in vitro. Moreover, a total of 950 DEGs were identified in HDAC9-knockdown hBMSCs. We discovered that the MAPK signaling pathway might be related to this process by pathway enrichment analysis. HDAC9 knockdown significantly reduced the expression level of phosphorylated extracellular signal-regulated kinase 1/2 (pERK1/2). Finally, the decreased osteogenesis due to HDAC9 knockdown was partly rescued by a MAPK signaling pathway activator.
Conclusion
Taken together, these results suggest that HDAC9 knockdown inhibits osteogenic differentiation of hBMSCs, partially through the MAPK signaling pathway. HDAC9 may serve as a potential target for the treatment of ONFH.
Introduction
Osteonecrosis of the femoral head (ONFH) is a refractory progressive orthopedic disease that is usually accompanied by necrosis and apoptosis of the bone marrow and osteocytes, leading to collapse of the femoral head.Citation1,Citation2 Epidemiological investigations indicated that its annual incidence ranged from 9.57 to 11.76 cases per 10,000 population, ranking first in hip disease.Citation3 The progression of the disease is considerably rapid and reduces patient quality of life.Citation4 Unfortunately, there is currently no effective treatment because the pathogenesis of ONFH has not yet been elucidated.
Human bone marrow mesenchymal stem cells (hBMSCs) have the potential to differentiate into osteoblasts in vitro and are the main source of ideal seed cells for treating osteonecrosis.Citation5,Citation6 Several researchers have pointed out that the occurrence of some bone and joint diseases is closely related to the dysfunction of these cells; for instance, hBMSCs with reduced activity were found in the bone marrow of patients with nontraumatic ONFH.Citation7 In our previous study, abnormally differentiated hBMSCs in nontraumatic ONFH were found to be involved in weakened osteogenesis.Citation8 Therefore, we speculated that a reduced osteogenic capacity of hBMSCs may be related to the occurrence of ONFH.
Histone deacetylase 9 (HDAC9) belongs to the HDAC family and plays an important role in epigenetic modification.Citation9,Citation10 HDAC9 can not only catalyze the deacetylation of histones but also regulate the structure of chromatin, leading to epigenetic gene regulation.Citation11 Other HDACs, such as SIRT1, SIRT3, HDAC1, HDAC5 and HDAC7, are involved in bone and joint diseases, including ONFH,Citation12–Citation16 through regulating osteoblast differentiation, promoting adipogenesis, and mediating osteoclastogenesis. Although previous studies have demonstrated that HDAC9 may be related to tumorigenesis, angiogenesis, lipogenesis and T cell immunomodulation,Citation17–Citation21 it remains unknown whether HDAC9 is involved in the osteogenesis of MSCs.
The mitogen-activated protein kinase (MAPK) signaling pathway is an indispensable signal transduction system that commonly exists in eukaryotic cells and mediates cellular responses. Previous studies have shown that the MAPK signaling pathway can play a crucial role in osteogenesis of MSCs, which might be related to the pathophysiology of ONFH.Citation22,Citation23 Combined with the role of HDAC9, we hypothesized that HDAC9 could regulate osteogenic differentiation in MSCs through the MAPK signaling pathway, eventually resulting in ONFH.
In the present study, we investigated the key effect of HDAC9 on the osteogenesis of hBMSCs. Our present results revealed that downregulated HDAC9 inhibits osteogenic differentiation in hBMSCs. To further clarify the hidden molecular mechanism, the differentially expressed genes (DEGs) between HDAC9 knockdown hBMSCs and normal control hBMSCs were screened. Furthermore, gene ontology (GO) and pathway enrichment analyses were conducted to identify the pivotal downstream molecules and pathways. The MAPK signaling pathway was found to be related to this process. Finally, we demonstrated that HDAC9 knockdown inhibits the osteogenic differentiation of hBMSCs, partially by suppressing the MAPK signaling pathway.
Materials and Methods
Cell Culture and Identification
hBMSCs were purchased from Cyagen Biosciences (HUXMA-90011, Guangzhou, China). They can differentiate into osteocytes, adipocytes and chondrocytes when cultured in the appropriate corresponding differentiation media. These cells were cultured in complete low glucose Dulbecco’s modified Eagle’s medium (L-DMEM) (HyClone, USA) with 10% fetal bovine serum (FBS) (Gibco, USA), and 100 IU/mL penicillin/streptomycin and incubated at 37°C with 5% carbon dioxide at 95% humidity. Adherent cells were trypsinized and passaged after reaching 80% confluence. Cells from passages 3–9 were used for subsequent experiments. These cells show ≥70% positivity for the expression of the cell surface antigens CD29, CD44 and CD105 and ≤5% positivity for the expression of the cell surface antigens CD34 and CD45.
Lentiviral Packaging and Cell Infection
Lentiviral knockdown HDAC9 (lenti-HDAC9) particles and control lentiviral GFP particles (lenti-control), were prepared by Western Biomedical technology. For infections, 70% confluent hBMSCs were incubated with lentiviral particles and 5.0 μg/mL polybrene in the growth medium at a multiplicity of infection of 40. After 24 h, 95% of the cells were still viable, and the culture medium was then changed. Three days later, all transfected cells were passaged for use in subsequent experiments. The expression of HDAC9 was measured by qRT-PCR and Western blotting analyses.
Cell Proliferation Assay
To evaluate the effect of HDAC9 knockdown on the proliferation of hBMSCs, the cells were seeded into a 96-well plate and allowed to adhere for 24 h. After 24 h, the medium was replaced, and the cells were treated with 5 mg/mL MTT (Sigma, USA) in 100 μL PBS (phosphate-buffered saline) for 4 h at 37 °C. Then, 150 μL DMSO was added to each well and the plate was shaken at low speed for 10 min to fully dissolve the crystals. Absorbance at 490 nm, which is directly proportional to cell proliferation, was measured by a microplate reader (Thermo Fisher, USA).
Osteogenic Differentiation and Alizarin Red Staining
We used complete medium to cultivate mesenchymal stem cells. The medium consisted of L-DMEM (HyClone, USA) with 10% FBS (Gibco, USA) and 100 IU/mL penicillin/streptomycin and the cells were cultured in 6-well cell culture plates at a density of 2 × 10⁴/cm2. All cells were incubated for 48 h at 37°C with 5% CO2. Then, osteogenic induction medium (catalog No. HUXMA-90021, Cyagen, China) was added for further culture. We changed the medium every two days. After culturing the cells for 2 weeks, we then aspirated the medium. After washing 2 times with PBS, the cells were immediately fixed with 4% paraformaldehyde for 30 minutes. Then, after removing the paraformaldehyde, we stained the cells with Alizarin Red Staining Solution (catalog No. S0141, Cyagen, China) for 30 minutes. Cells were clearly visualized via light microscopy (Leica DMIRB, Heidelberg, Germany). Eventually, the stain was desorbed by incubating with 10% cetylpyridinium chloride (Sigma, Shanghai, China) for 1 h. We collected the solution, added 200 μL to each 96-well plate, and used a microplate reader (Thermo Fisher, USA) for data measurement at 560 nm. The readings were normalized to the total protein concentration.
RNA Isolation and qRT-PCR
We collected hBMSCs and used TRIzol to isolate total RNA (Beyotime, Shanghai, China). Additionally, we conducted reverse transcription and then adopted the SYBR Green method to carry out PCR. Glyceraldehyde 3-phosphate dehydrogenase (GAPDH) was used as the internal reference. The cycle conditions were as follows: 95 °C for 30s, followed by 40 cycles at 95 °C for 5s and 60 °C for 30s. The relative target gene expression levels were calculated using the 2−ΔΔCt method. The primer sequences used in the present study are listed in .
Table 1 The Primer Sequences Used for Quantitative Real-Time PCR
Western Blotting Analysis
Western blotting was performed as previously described.Citation24 The primary antibodies used for Western blotting were as follows: HDAC9 (1:1000), RUNX2 (1:1000), OCN (1:1000), PDGF-BB (1:1000), CD31 (1:1000), PPARγ (1:1000), ERK1/2 (1:500), and pERK1/2 (1:500). β-actin (1:500) served as the internal control. The primary antibodies used in the present study are listed in Supplementary Table 1.
Microarray and Data Processing and Bioinformatics Analysis
We used a NanoDrop ND-2000 (Thermo Scientific) to quantify the total RNA. Then, we used an Agilent Bioanalyzer 2100 (Agilent Technologies) to assess RNA integrity. According to the manufacturer’s standard protocols, we conducted sample labeling, microarray hybridization and washing. In short, total RNA was transcribed to double-strand cDNA, then cRNA was synthesized and labeled with biotin. First, the labeled cRNAs were hybridized onto the microarray. Second, after washing and staining, the arrays were scanned by an Affymetrix Scanner 3000 (Affymetrix). Third, the Affymetrix GeneChip Command Console (version 4.0, Affymetrix) was utilized to evaluate array images to obtain raw data. Next, Genespring software (version 14.8; Agilent Technologies) was used to perform the basic analysis of the raw data. Ultimately, the raw data were normalized with the RMA algorithm. DEGs were then identified through analyzing fold change. The threshold standard for up- and downregulated genes was a fold change ≥ 2.0 and p value<0.05. Afterwards, GO analysis and KEGG analysis were applied to determine the roles of these differentially expressed mRNAs. The data are available at the Gene Expression Omnibus database (https://www.ncbi.nlm.nih.gov/geo/) with the access code GSE168056.
Statistical Analysis
All results are presented as the mean ± SD from at least three independent experiments. The statistical analysis was carried out using SPSS 23.0 computer software. Statistical significance was determined using a two-tailed Student’s t-test when comparing two groups and one-way ANOVA followed by Bonferroni’s post hoc test when comparing more than two groups. GraphPad Prism 7 software was used for statistical analysis charting. A p value of 0.05 or less was considered to represent a statistically significant difference.
Results
The Establishment of HDAC9 Knockdown in hBMSCs
To explore the effect of HDAC9 during osteogenic differentiation, a lentiviral vector system was adopted to effectively downregulate the expression of HDAC9 in hBMSCs. We used the ratio of green fluorescent protein (GFP)-positive cells to the total cell number to assess transfection intensity (). Then, the expression level of HDAC9 was measured via qRT-PCR and Western blotting analysis 3 days later. Compared with those in the lenti-control group and mock-treated group (without virus), HDAC9 expression was reduced in the lenti-HDAC9 group ().
Figure 1 Construction of HDAC9-knockdown hBMSCs and lenti-control hBMSCs. (A) hBMSCs after lentiviral transfection and puromycin screening were observed under a normal microscope and a fluorescence microscope. Scale bar =10μm. (B–D) The protein and mRNA levels of HDAC9 were determined by Western blotting and qRT-PCR analysis, respectively, in the lenti-HDAC9, lenti-control, and mock-treated groups. (E) The proliferation rate of hBMSCs was not significantly affected by HDAC9 knockdown. The data are expressed as the means ± S.D. *P<0.05 versus the lenti-control group.
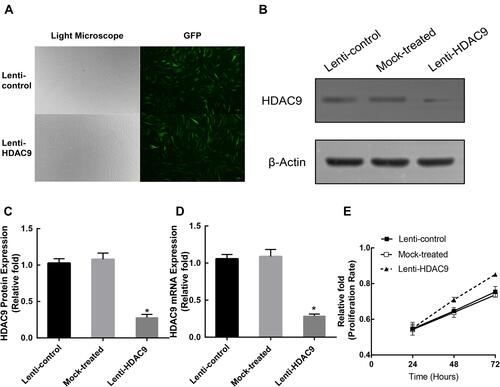
HDAC9 Knockdown Did Not Affect hBMSC Proliferation
To investigate whether HDAC9 knockdown affects the proliferation of hBMSCs, MTT levels in hBMSCs from the three groups were measured. The role of HDAC9 knockdown on hBMSC proliferation at 24, 48, and 72 hours after infection is displayed in . There was no significant difference in the cell proliferation rate between the HDAC9 knockdown group and the control groups.
Silencing of HDAC9 Inhibits Osteoblast Differentiation of hBMSCs
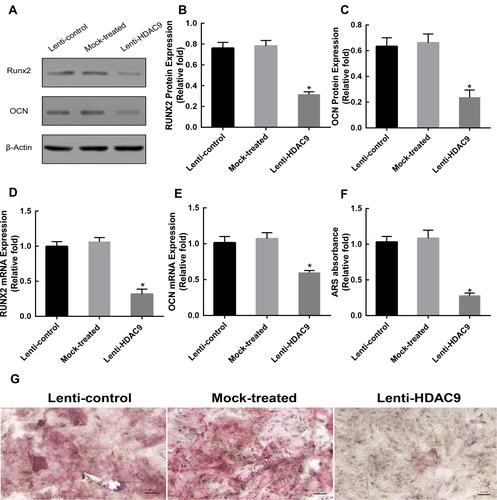
To evaluate the effect of HDAC9 knockdown on osteogenic differentiation, the expression levels of Runx2 and OCN were measured by Western blotting and qRT-PCR analyses. Western blotting analysis showed lower RUNX2 and OCN protein expression levels in the HDAC9 knockdown group than in the control groups at day 14 (). qRT-PCR analysis also showed that the mRNA levels of both Runx2 and OCN were markedly lower in the HDAC9 knockdown group than in the control groups at day 14 (). Furthermore, Alizarin Red staining was performed to detect calcium deposits, and the stained areas were quantified by measuring the absorbance at 560 nm. Fewer calcium deposits appeared in the HDAC9 knockdown group than in the control group at day 14 ().
Figure 2 Knockdown of HDAC9 inhibited the osteogenic differentiation of hBMSCs. (A–C) The expression of RUNX2 and OCN proteins was determined by Western blotting analysis after osteogenic differentiation for 14 days. (D and E) The expression of Runx2 and OCN mRNA was determined by qRT-PCR at day 14 of osteogenic differentiation. (F) Mineralization was quantified by the extraction of Alizarin Red S-stained cells. (G) Alizarin Red S (ARS) staining after osteogenic differentiation for 14 days. Scale bar =50μm. Data were mean ± S.D. *P<0.05 versus the lenti-control group.
Differential Expression Analysis
After quality control, a total of 1164 genes were differentially expressed in HDAC9-knockdown hBMSCs compared with mock-treated hBMSCs. Additionally, a total of 1546 genes were differentially expressed in HDAC9-knockdown hBMSCs compared with lenti-control hBMSCs. The heat map of the DEGs is shown in Supplementary Figure 1. Moreover, as shown in the Supplementary Material, a total of 950 DEGs overlapped in the above groups (Supplementary Table 2).
Functional and Pathway Enrichment Analysis
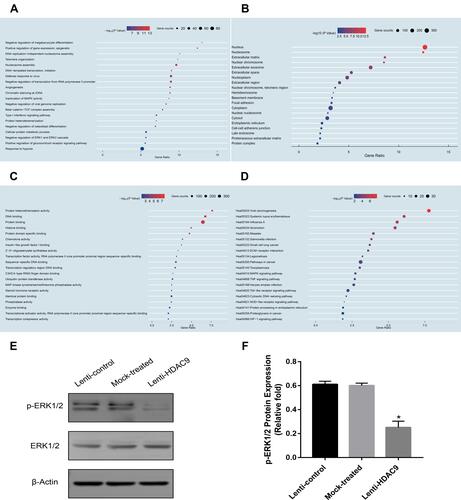
GO analysis was used to evaluate the potential functions of these DEGs. Three factors, biological processes (BP) (), cellular components (CC) () and molecular functions (MF) (), were included in the GO categories. Then, we used KEGG pathway enrichment analysis to identify the biological pathways controlled by the DEGs and found that the MAPK signaling pathway, TNF signaling pathway and Toll-like receptor signaling pathway were among the most enriched pathways (). Additionally, we also found that these DEGs were markedly associated with inactivation of MAPK activity and negative regulation of the ERK1 and ERK2 cascades in biological processes. Moreover, in molecular functions, the outcomes demonstrated that these DEGs might influence MAP kinase tyrosine/serine/threonine phosphatase activity. In summary, we speculated that HDAC9 knockdown-related DEGs may regulate the classic ERK/MAPK signaling pathway.
Figure 3 Functional enrichment analysis of DEGs and MAPK signaling pathway verification. (A) Gene ontology analysis of biological processes for DEGs. (B) Gene ontology analysis of cellular components for DEGs. (C) Gene ontology analysis of molecular functions for DEGs. (D) Gene ontology analysis of KEGG for DEGs. (E and F) The expression of pERK1/2 and ERK1/2 proteins was determined by Western blotting analysis. Data were mean ± S.D. *P<0.05 versus the lenti-control group.
HDAC9 Knockdown Represses the MAPK Signaling Pathway
To validate the above findings, the expression level of pERK1/2 was measured by Western blotting. The outcomes of the Western blotting analyses displayed lower expression of pERK1/2 in the HDAC9-knockdown group than in the control groups ().
Decreased Osteogenic Differentiation of HDAC9-Knockdown hBMSCs Was Partially Rescued by a MAPK Signaling Pathway Activator
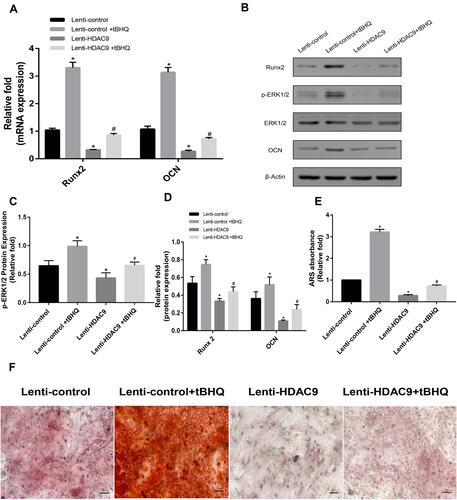
To explore the involvement of the MAPK signaling pathway, we examined the effect of MAPK activation on osteogenesis in HDAC9 knockdown cells. Three days after the addition of tBHQ, an activator of the MAPK signaling pathway, the level of the expression level of pERK1/2 was significantly increased compared with the level in HDAC9-knockdown hBMSCs without the activator (). Furthermore, activation of the MAPK signaling pathway partially reversed the decrease in osteogenesis of hBMSCs, as indicated by the expression of osteospecific genes and proteins (). In addition, fewer calcium deposits appeared in HDAC9-knockdown hBMSCs than in the lenti-HDAC9 + tBHQ group ().
Figure 4 The decreased osteogenesis caused by HDAC9 knockdown could be partially rescued by the addition of a MAPK signaling activator (tBHQ). (A) The expression of Runx2 and OCN mRNA in the lenti-control, lenti-control + tBHQ, lenti-HDAC9, and lenti-HDAC9 + tBHQ groups was determined by qPCR. (B–D) The expression of pERK1/2, ERK1/2, Runx2 and OCN in the lenti-control, lenti-control + tBHQ, lenti-HDAC9, and lenti-HDAC9 + tBHQ groups was determined by Western blotting analysis. (E) Alizarin red staining area determined by measuring the absorbance at 560 nm. (F) Alizarin red staining in the lenti-control, lenti-control + tBHQ, lenti-HDAC9, and lenti-HDAC9 + tBHQ groups at day 14 of osteogenic differentiation. Scale bar =50μm. Data were mean ± S.D. *P<0.05 versus the lenti-control group. #P<0.05 versus the lenti-HDAC9 group.
Discussion
Bone can continuously self-renew throughout life, and its function can be maintained by a precise balance between osteoclasts and osteoblasts. Once an imbalance in this process occurs, bone disease will arise, for instance, osteonecrosis. However, this balance can also be disrupted by the decline of the osteogenic potential of MSCs, which results in the decline of osteogenesis and osteonecrosis in the bones.Citation25 Additionally, the results of our previous study also demonstrated that abnormally differentiated hBMSCs from nontraumatic ONFH could weaken osteogenesis. Therefore, correcting these osteogenesis disorders is a major focus of ONFH treatment development.
In our study, we demonstrated that HDAC9 knockdown suppressed the osteogenesis of hBMSCs. Thus, HDAC9 might be a vital target for treating ONFH. HDAC9 is classified as a member of the class IIa family of HDACs, which includes HDACs 4, 5 and 7, and these proteins can function as transcription coregulators by recruiting other molecular chaperones (eg, HP1, NF-AT3c and N-CoR).Citation26,Citation27 Therefore, this class IIa subfamily may be able to regulate cell differentiation destiny by attracting partner proteins in addition to performing their own histone deacetylase function. Additionally, some previous studies have shown that HDAC1, HDAC3, HDAC4 and HDAC7 knockdown could promote osteoblastic differentiation of hBMSCs through the modification of histones or by direct interaction with Runx2.Citation28–Citation31 These findings seem to oppose our results. The reasons for this contradiction may be as follows: (1) compared with other members of this protein family, HDAC9 lacks the C-terminal and catalytic domains and does not possess intrinsic HDAC activity; (2) class II HDAC family members might adjust various cellular processes by a variety of modes of action, such as binding to particular transcription factors; and (3) diversified HDACs could take part in the precise coordination of the same cellular process but benefit distinct functions at the different stages of the cellular process.
To explore the potential mechanism, a bioinformatic analysis was performed to identify the DEGs between HDAC9-knockdown hBMSCs and normal control hBMSCs and their related pathways. By complete KEGG pathway analysis, the MAPK signaling pathway was found to be associated with the above factors. In addition, the biological processes of these DEGs were also markedly associated with inactivation of MAPK activity and negative regulation of the ERK1 and ERK2 cascades. Moreover, in the analysis of molecular functions, the outcomes demonstrated that these DEGs might influence MAP kinase tyrosine/serine/threonine phosphatase activity. Therefore, we measured the expression level of pERK1/2 by Western blot and found that its expression was lower in HDAC9-knockdown hBMSCs. Additionally, we found that the decreased osteogenesis due to HDAC9 knockdown was partly rescued by a MAPK signaling pathway activator. This indicated that HDAC9 knockdown suppressed the osteogenesis of hBMSCs partly via the classic ERK/MAPK signaling pathway. Many studies have shown that this pathway is one of the most important pathways in osteoblastic differentiation.Citation32–Citation34 ERK can regulate osteoblast proliferation by modulating cell cycle regulators.Citation35 Moreover, the results of previous studies have also confirmed that the osteogenic activity of Runx2 and OCN might be modified by phosphorylated MAPK, which could further promote their ability to bind with each other.Citation36 However, no reports on how HDAC9 regulates the osteogenic differentiation of MSCs through the MAPK signaling pathway have been published.
Conclusion
In summary, our present study confirms that HDAC9 knockdown suppresses the osteogenesis of hBMSCs partially via the MAPK signaling pathway by inhibiting phosphorylated ERK1/2 expression, which provides a potential therapeutic target for ONFH.
Data Sharing Statement
All the data in our study will be made available by the authors upon reasonable request from Yong Feng.
Author Contributions
All authors met the following conditions:
Made a significant contribution to the work reported, whether that is in the conception, study design, execution, acquisition of data, analysis and interpretation, or in all these areas.
Have drafted or written, or substantially revised or critically reviewed the article.
Have agreed on the journal to which the article will be submitted.
Reviewed and agreed on all versions of the article before submission, during revision, the final version accepted for publication, and any significant changes introduced at the proofing stage.
Agree to take responsibility and be accountable for the contents of the article.
Disclosure
The authors declare no conflicts of interest.
Additional information
Funding
References
- Weinstein RS, Hogan EA, Borrelli MJ, Liachenko S, O’Brien CA, Manolagas SC. The pathophysiological sequence of glucocorticoid-induced osteonecrosis of the femoral head in male mice. Endocrinology. 2017;158(11):3817–3831. doi:10.1210/en.2017-00662
- Chughtai M, Piuzzi NS, Khlopas A, Jones LC, Goodman SB, Mont MA. An evidence-based guide to the treatment of osteonecrosis of the femoral head. Bone Joint J. 2017;99-b(10):1267–1279. doi:10.1302/0301-620X.99B10.BJJ-2017-0233.R2
- Zhao DW, Yu M, Hu K, et al. Prevalence of nontraumatic osteonecrosis of the femoral head and its associated risk factors in the Chinese population: results from a nationally representative survey. Chin Med J. 2015;128(21):2843–2850. doi:10.4103/0366-6999.168017
- Houdek MT, Wyles CC, Sierra RJ. Osteonecrosis of the femoral head: treatment with ancillary growth factors. Curr Rev Musculoskelet Med. 2015;8(3):233–239. doi:10.1007/s12178-015-9281-z
- Håkelien AM, Bryne JC, Harstad KG, et al. The regulatory landscape of osteogenic differentiation. Stem Cells. 2014;32(10):2780–2793. doi:10.1002/stem.1759
- Liu Y, Wu J, Zhu Y, Han J. Therapeutic application of mesenchymal stem cells in bone and joint diseases. Clin Exp Med. 2012;14(1):13–24. doi:10.1007/s10238-012-0218-1
- Lee JS, Lee JS, Roh HL, Kim CH, Jung JS, Suh KT. Alterations in the differentiation ability of mesenchymal stem cells in patients with nontraumatic osteonecrosis of the femoral head: comparative analysis according to the risk factor. J Orthop Res. 2006;24(4):604–609. doi:10.1002/jor.20078
- Hao C, Yang S, Xu W, et al. MiR-708 promotes steroid-induced osteonecrosis of femoral head, suppresses osteogenic differentiation by targeting SMAD3. Sci Rep. 2016;6(1):22599. doi:10.1038/srep22599
- Witt O, Deubzer HE, Milde T, Oehme I. HDAC family: what are the cancer relevant targets? Cancer Lett. 2009;277(1):8–21. doi:10.1016/j.canlet.2008.08.016
- Liu F, Zong M, Wen X, et al. Silencing of histone deacetylase 9 expression in podocytes attenuates kidney injury in diabetic nephropathy. Sci Rep. 2016;6(1):33676. doi:10.1038/srep33676
- Clocchiatti A, Florean C, Brancolini C. Class IIa HDACs: from important roles in differentiation to possible implications in tumourigenesis. J Cell Mol Med. 2011;15(9):1833–1846. doi:10.1111/j.1582-4934.2011.01321.x
- Yang G, Hamadeh IS, Katz J, et al. SIRT1/herc4 locus associated with bisphosphonate-induced osteonecrosis of the jaw: an exome-wide association analysis. J Bone Miner Res. 2018;33:91–98. doi:10.1002/jbmr.3285
- Hawtree S, Muthana M, Wilkinson JM, Akil M, Wilson AG. Histone deacetylase 1 regulates tissue destruction in rheumatoid arthritis. Hum Mol Genet. 2015;24(19):5367–5377. doi:10.1093/hmg/ddv258
- Ho L, Wang L, Roth TM, et al. Sirtuin-3 promotes adipogenesis, osteoclastogenesis, and bone loss in aging male mice. Endocrinology. 2017;158(9):2741–2753. doi:10.1210/en.2016-1739
- Jin Z, Wei W, Dechow PC, Wan Y. HDAC7 inhibits osteoclastogenesis by reversing RANKL-triggered beta-catenin switch. J Mol Endocrinol. 2013;27(2):325–335. doi:10.1210/me.2012-1302
- Li H, Xie H, Liu W, et al. A novel microRNA targeting HDAC5 regulates osteoblast differentiation in mice and contributes to primary osteoporosis in humans. J Clin Invest. 2009;119(12):3666–3677. doi:10.1172/JCI39832
- Hu Y, Sun L, Tao S, et al. Clinical significance of HDAC9 in hepatocellular carcinoma. Cell Mol Biol. 2019;65(4):23–28. doi:10.14715/10.14715/cmb/2019.65.4.4
- Salgado E, Bian X, Feng A, Shim H, Liang Z. HDAC9 overexpression confers invasive and angiogenic potential to triple negative breast cancer cells via modulating microRNA-206. Biochem Biophys Res Commun. 2018;503(2):1087–1091. doi:10.1016/j.bbrc.2018.06.120
- Kaluza D, Kroll J, Gesierich S, et al. Histone deacetylase 9 promotes angiogenesis by targeting the antiangiogenic microRNA-17-92 cluster in endothelial cells. Arterioscler Thromb Vasc Biol. 2013;33(3):533–543. doi:10.1161/ATVBAHA.112.300415
- Wong RH, Chang I, Hudak CS, Hyun S, Kwan HY, Sul HS. A role of DNA-PK for the metabolic gene regulation in response to insulin. Cell. 2009;136(6):1056–1072. doi:10.1016/j.cell.2008.12.040
- Han X, Han X, Wang Z, Shen J, Dong Q. HDAC9 regulates ox-LDL-induced endothelial cell apoptosis by participating in inflammatory reactions. Front Biosci. 2016;21:907–917. doi:10.2741/4428
- Wang L, Wu F, Song Y, Duan Y, Jin Z. Erythropoietin induces the osteogenesis of periodontal mesenchymal stem cells from healthy and periodontitis sources via activation of the p38 MAPK pathway. Int J Mol Med. 2018;41(2):829–835. doi:10.3892/ijmm.2017.3294
- Wang Y, Chen X, Yin Y, Li S. Human amnion-derived mesenchymal stem cells induced osteogenesis and angiogenesis in human adipose-derived stem cells via ERK1/2 MAPK signaling pathway. BMB Rep. 2018;51(4):194–199. doi:10.5483/BMBRep.2018.51.4.005
- Park M, Park TS, Wu D, Xu A, Sweeney GJCR Abstract P247: APPL1 transgenic mice are protected from high-fat diet–induced lipotoxic cardiomyopathy. 2011:AP247.
- Fakhry M, Hamade E, Badran B, Buchet R, Magne D. Molecular mechanisms of mesenchymal stem cell differentiation towards osteoblasts. World J Stem Cells. 2013;5:136–148. doi:10.4252/wjsc.v5.i4.136
- Martin M, Kettmann R, Dequiedt F. Class IIa histone deacetylases: conducting development and differentiation. Int J Dev Biol. 2009;53(2–3):291–301. doi:10.1387/ijdb.082698mm
- Yang XJ, Grégoire S. Class II histone deacetylases: from sequence to function, regulation, and clinical implication. Mol Cell Biol. 2005;25(8):2873–2884. doi:10.1128/MCB.25.8.2873-2884.2005
- Lee HW, Suh JH, Kim AY, Lee YS, Park SY, Kim JB. Histone deacetylase 1-mediated histone modification regulates osteoblast differentiation. J Mol Endocrinol. 2006;20(10):2432–2443. doi:10.1210/me.2006-0061
- Schroeder TM, Kahler RA, Li X, Westendorf JJ. Histone deacetylase 3 interacts with runx2 to repress the osteocalcin promoter and regulate osteoblast differentiation. J Biol Chem. 2004;279(40):41998–42007. doi:10.1074/jbc.M403702200
- Kang JS, Alliston T, Delston R, Derynck R. Repression of Runx2 function by TGF-beta through recruitment of class II histone deacetylases by Smad3. EMBO J. 2005;24(14):2543–2555. doi:10.1038/sj.emboj.7600729
- Jensen ED, Schroeder TM, Bailey J, Gopalakrishnan R, Westendorf JJ. Histone deacetylase 7 associates with Runx2 and represses its activity during osteoblast maturation in a deacetylation-independent manner. J Bone Miner Res. 2008;23(3):361–372. doi:10.1359/jbmr.071104
- Liu GX, Ma S, Li Y, et al. Hsa-let-7c controls the committed differentiation of IGF-1-treated mesenchymal stem cells derived from dental pulps by targeting IGF-1R via the MAPK pathways. Exp Mol Med. 2018;50(4):25. doi:10.1038/s12276-018-0048-7
- Zhang W, Dong R, Diao S, Du J, Fan Z, Wang F. Differential long noncoding RNA/mRNA expression profiling and functional network analysis during osteogenic differentiation of human bone marrow mesenchymal stem cells. Stem Cell Res Ther. 2017;8(1):30. doi:10.1186/s13287-017-0485-6
- Zhu JH, Liao YP, Li FS, et al. Wnt11 promotes BMP9-induced osteogenic differentiation through BMPs/Smads and p38 MAPK in mesenchymal stem cells. J Cell Biochem. 2018;119(11):9462–9473. doi:10.1002/jcb.27262
- Lu M, Guo S, Hong F, et al. Pax2 is essential for proliferation and osteogenic differentiation of mouse mesenchymal stem cells via Runx2. Exp Cell Res. 2018;371(2):342–352. doi:10.1016/j.yexcr.2018.08.026
- Artigas N, Ureña C, Rodríguez-Carballo E, Rosa JL, Ventura F. Mitogen-activated protein kinase (MAPK)-regulated interactions between Osterix and Runx2 are critical for the transcriptional osteogenic program. J Biol Chem. 2014;289(39):27105–27117. doi:10.1074/jbc.M114.576793