 ?Mathematical formulae have been encoded as MathML and are displayed in this HTML version using MathJax in order to improve their display. Uncheck the box to turn MathJax off. This feature requires Javascript. Click on a formula to zoom.
Abstract
Background
One of the key clinical features of Alzheimer’s disease (AD) is impairment in daily functioning. Patients with mild cognitive impairment (MCI) also commonly have mild problems performing complex tasks. Information and communication technology (ICT), particularly techniques involving imaging and video processing, is of interest in order to improve assessment. The overall aim of this study is to demonstrate that it is possible using a video monitoring system to obtain a quantifiable assessment of instrumental activities of daily living (IADLs) in AD and in MCI.
Methods
The aim of the study is to propose a daily activity scenario (DAS) score that detects functional impairment using ICTs in AD and MCI compared with normal control group (NC). Sixty-four participants over 65 years old were included: 16 AD matched with 10 NC for protocol 1 (P1) and 19 MCI matched with 19 NC for protocol 2 (P2). Each participant was asked to undertake a set of daily tasks in the setting of a “smart home” equipped with two video cameras and everyday objects for use in activities of daily living (8 IADLs for P1 and 11 for P2, plus 4 temporal execution constraints). The DAS score was then computed from quantitative and qualitative parameters collected from video recordings.
Results
In P1, the DAS score differentiated AD (DASAD,P1 = 0.47, 95% confidence interval [CI] 0.38–0.56) from NC (DASNC,P1 = 0.71, 95% CI 0.68–0.74). In P2, the DAS score differentiated MCI (DASMCI,P2 = 0.11, 95% CI 0.05–0.16) and NC (DASNC,P2 = 0.36, 95% CI 0.26–0.45).
Conclusion
In conclusion, this study outlines the interest of a novel tool coming from the ICT world for the assessment of functional impairment in AD and MCI. The derived DAS scores provide a pragmatic, ecological, objective measurement which may improve the prediction of future dementia, be used as an outcome measurement in clinical trials and lead to earlier therapeutic intervention.
Keywords:
Introduction
One of the key clinical features of Alzheimer’s disease (AD) is impairment in daily functioning. Activities of daily living (ADLs) consist of bathing, dressing, going to the toilet, transferring, continence, and feeding.Citation1 Instrumental ADLs (IADLs) are the activities often performed by a person who is living independently in a community setting during the course of a normal day, such as using the telephone, shopping, food preparation, housekeeping, laundry, mode of transportation, responsibility for own medication, and ability to handle finances.Citation2 The inability to perform ADLs and IADLs leads to loss of independence, affects quality of life of patients with dementia, and increases the burden of caregivers by shifting to them many daily responsibilities.Citation3
Mild cognitive impairment (MCI) is often a precursor to AD and other forms of dementia, as 12% of individuals with MCI convert to AD within 1 year,Citation4 and as many as 60% of individuals with MCI develop AD over a 5-year period.Citation5 It has been shown that more complex IADL may already be impaired in the early stages of cognitive decline before a diagnosis of dementia is warranted.Citation6–Citation9 As indicated in the recommendations from the National Institute on Aging-Alzheimer’s Association (NIA-AA),Citation10 persons with MCI commonly have mild problems performing complex tasks. Nevertheless, they generally maintain their independence with minimal assistance. It is recognized that the application of this criterion is challenging but also necessary for the determination of whether a person has dementia. Methods to assess IADL comprise self-reported questionnaires, performance-based assessment, and informant-based questionnaires. These measurements have some limitationsCitation11 because they do not offer accurate, reproducible, objective, and ecological perspectives. Moreover, these assessment batteries and standardized tools rely on quantitative scales, which are often lacking sensitivity.
For this reason, information and communication technology (ICT), particularly techniques involving imaging and video processing, is of interestCitation12 and may overcome the limitations in reducing the inter/intra-rater variability due to human interpretation. Such techniques enable the patients’ performances and actions in real time and real life situations to be captured and accurately evaluated.
In France, a third Alzheimer plan was launched in 2008 (French National Plan for “Alzheimer and Related Disorders” 2008–2012)Citation13 to strengthen research on Alzheimer’s disease and related disorders, promote earlier diagnosis, and improve both patient management and support for carers. In this context, the French National Research Agency (ANR) launched a call to promote research projects in health and autonomy through innovative concepts and technological breakthrough. This call was proposed to engineers and companies involved in innovative computer sciences but also to clinical practitioners. This explains why clinical centers belonging to the nationwide network comprising 27 “memory resource and research centers” (CMRRs: centres mémoire de ressources et de recherche) also participated.
The overall aim of the SWEET Home (ANR TecSan 2009) project was to demonstrate that it is possible using a video monitoring system (VMS), to obtain a quantifiable assessment of IADLs in AD and in MCI.
Study participants and methods
This study was promoted by the Nice University Hospital (study 11-pp-03) and funded by the National Research Agency in France (ANR-09-TECS-016-01). Ethical approval was received from the Protection of Persons Committee “Sud Méditerranée V” (CPP N°11029 from May 24, 2011) and the “Agence Française de Sécurité Sanitaire des Aliments et des Produits de Santé” (AFSSAPS N°B110465-30 from April 14, 2011). Informed consent was obtained before the first assessment.
Participants and clinical assessment
Sixty-four individuals aged 65 or older were recruited at the Nice Research Memory Center within two consecutive protocols: P1 for AD and normal controls (NC), P2 for MCI (NIA-AA criteria) and NC.
For the AD group, the diagnosis was determined using the NINCDS-ADRDA criteria.Citation14 For the MCI group, patients with a mini-mental state examination (MMSE) score higher than 24 were included using the Petersen clinical criteria.Citation4 Subjects were not included if they had a history of head trauma with loss of consciousness, psychotic or major depressive disorder according to the Diagnostic and Statistical Manual of Mental Disorders, 4th edition criterion, or aberrant motor activity (tremor, rigidity, Parkinsonism) as defined by the Movement Disorder Society Unified Parkinson Disease Rating Scale.Citation15 Participants were administered a cognitive and behavioral examination prior to completing the video monitoring session. Global cognitive functioning was assessed using the MMSE.Citation16 Other cognitive functions were assessed with the frontal assessment battery,Citation17 5 Words,Citation18 clock drawing test,Citation19 and verbal fluencies.Citation20 Depressive symptoms were assessed using MADRSCitation21 and GDS.Citation22 Finally, functions were assessed using the IADL scale (IADL-E)Citation23 during a clinical interview with the caregivers.
Ecological assessment of autonomy based on a VMS
The ecological assessment of IADLs was conducted in an observation room located in the Nice Research Memory Center. This room was equipped with everyday objects for use in ADLs and IADLs, eg, an armchair, a table, a tea corner, a television, a personal computer, and a library. Two fixed monocular video cameras (eight frames per second) were installed to capture the activity of the participants during the experiment. The aim of this ecological assessment of autonomy was to determine the extent to which the participant could undertake a list of daily activities with the respect of constraint after having been given a set of instructions. To achieve this aim, two functional scenarios which could realistically be undertaken within the confines of the room were proposed to participants: one for the AD and NC participants (P1), and the other for the MCI and NC participants (P2). All assessments were performed at the same time of day, between 2 pm and 3 pm. The rating of the videos was made by engineers specialized in video signal analysis working at the Institut National de Recherche en Informatique et en Automatique.
Daily activity scenario (DAS).,n associated with protocol P1
For the protocol P1 scenario, participants were assessed in their ability to carry out a list of seven activities (eg, reading the newspaper, turning on the television) in a specific order within a timeframe of 20 minutes (see ).
Table 1 Daily activity scenarios characteristics in protocols 1 (P1) and 2 (P2)
DAS associated with protocol P2
For the functional scenario associated with P2, participants were assessed in their ability to carry out a list of ten activities in a logical order respecting temporal execution constraints within a timeframe of 15 minutes (see ). Prior to leaving the room, the examiner described each of the activities and the location and use of various objects needed to undertake the tasks. The examiner left the room only after it was clear that the participant understood the tasks. The participant kept the list of instructions and referred to them at any point during the assessment. He/she could leave the room when he/she felt that he/she had completed the required tasks. The participant was also told that the examiner would be available for questions on the other side of the door and that he/she could leave the room at any point should he/she choose to do so. During the clinical scenario, an examiner located outside of the room monitored the safety of the participants.
The DAS score [DAS.,.()] for assessing the scenario
The first step (Step 1) was to manually select and collect the clinical relevant data to be extracted from videos. Secondly (Step 2), the mathematical algorithm for assessing the scenario (DAS score) was constructed, and then parameters ki,n included in the expression of the DAS score were determined using a fitting procedure (Step 3). The final step (Step 4; to validate the procedure and the values of parameters ki,n) was done using the leave-one-out cross-validation (LOOCV) methodology. All these steps are described below.
Step 1: DAS.,.() development – annotated data
Researchers blinded to a participant’s clinical status viewed and annotated the video to extract relevant parameters. To avoid inter- and intra-rater variability due to subjective interpretation of performed activities, the beginning and the end of each activity were defined using specific criteria (). A ratio related to the percentage of time participants carried out goal-oriented behaviors was computed as follows: REff = (total time [in seconds] spent by the participant in performing the listed activities/total time spent in the room), REff € R[0,1].
Table 2 Observable criteria used to annotate video sequences of the protocol 2 (P2)
For the DAS associated with P1, the following parameters were extracted: a1,P1 number of activities omitted, a1,P1 € [1,7]; a2,P1 total number of repetitions, a2,P1 € N; a3,P1 order error, a3,P1 € {0,1} with a3,1 = 1 if order error was done; and a4,P1 total number of attempts before completing a given activity, a4,P1 € N.
For the DAS associated with P2, the following parameters were extracted: a1,P2 number of activities omitted, a1,P2 € [0,10]; a2,P2 total number of repetitions excluding the leisure activities (“watching television,” and “reading”), a2,P2 € N; a3,P2 the number of activities performed but not achieved, a3,P2 € [0,10]; and a4,P2 parameter related to the respect of temporal execution constraints a4,P2 € {0,1} with a4,P2 = 1 if more than two or three temporal constraints were not respected.
Step 2: DAS.,.() development – mathematical expression of DAS score
The score DASj,n, n € {P1, P2}, for a participant j was expressed by:
with k1,P1, k2,P1, k3,P1, and k4,P1 verifying the following relationship 0 < k1,P1 < k2,P1 < k3,P1 < k4,P1 < 1, and no constraints were established for ki,P2 parameters i € [1,4].
Step 3: Fitting procedure
To determine values of the model parameter set (k1,n, k2,n, k3,n, k4,n), n € {P1, P2}, the fitting procedure was divided into two steps. Firstly, 50,000 different combinations of parameter values, consistent with constraints of order (P1), and no specific constraints for (P2) were drawn up using a random number generator. Secondly, multiple model parameter sets (k1,n, k2,n, k3,n, k4,n) to produce a “good fit” were selected if their associated score was both strongly and positively correlated with MMSE score, as well as being strongly and negatively correlated with IADL score using a nonparametric Spearman correlation coefficient as the criterion distance of good fit. For the analyses, the final functional DAS.,n (k1,n, k2,n, k3,n, k4,n) score was calibrated by using the combination of the mean of the parameters which were selected as the model parameter set during the second step of fitting procedure.
Step 4: Cross-validation methodology
Predictive performance of the DAS.,n score, n € {P1, P2} was done by a LOOCV given the small sample sizes. Criteria used for validating the model with other current neuropsychological rating scales were the Spearman correlation between the DAS.,n score with both MMSE and IADL-E. Criteria used for performing the predictive performance of the model were accuracy rate, positive predictive value, negative predictive value, false-positive rate, and false-negative rate computed from test data according to the LOOCV methodology.Citation24
Statistical analysis
All analyses were performed following the per-protocol analyses, including all patients who correctly finished the protocol. Results are presented as means and their 95% confidence intervals (CIs) or standard deviations (SDs) (mean, 95% CI; or mean ± SD) for continuous variables, and as the value and its associated proportion (n, %) for categorical variables. Intergroup comparisons for continuous variables were performed using a nonparametric Mann–Whitney test. Analyses of association between two categorical variables (two modalities) were studied using the Fisher’s exact test. Analyses of associations were measured using Spearman rank correlation. The significance level was set at an alpha risk of 5% (P < 0.05). The receiver operating curves (ROCs) and its area under the ROC was also provided to assess the predictive performance of the DAS.,n scores computed from all data. All calculations were performed using SPSS Statistics (IBM Corporation, Somers, NY) software, version 19.0, and R software, version 2.13.2.
Results
Protocol 1
Population
Sixteen AD patients (age = 76.7 ± 7.6) and 10 NC (age = 73.9 ± 6.2) were included in protocol 1. shows the clinical and demographic data of the participants. Significant intergroup differences in demographic factors (gender and age) were not seen. The mean MMSE for the AD group was 20.7 (±2.0) and 28.1 (±1.3) for the NC group (P < 0.001), and the mean IADL-E scores also differed between groups, with the AD group having significantly different mean IADL-E scores (14.3 ± 5.9) compared with the NC group (10.5 ± 1.1) (P < 0.05).
Table 3 Characteristics of the participants in protocol 1 (P1)
LOOCV results for DAS.,P1
shows predictive performances results of the assessment methodology to classify the new test data as AD observation (refers to a positive case) or NC observation (refers to a negative case) using its DAS.,P1() score fitted using the value of parameter set (k1,P1, k2,P1, k3,P1, k4,P1) defined from the training dataset.
Table 4 Characteristics of the participants in protocol 2 (P2)
Table 5 Evaluation of predictive performance of our assessment methodology based on the DAS scores: Leave-one-out cross-validation (LOOCV) resultsTable Footnotea
Assessment based on DAS.,P1
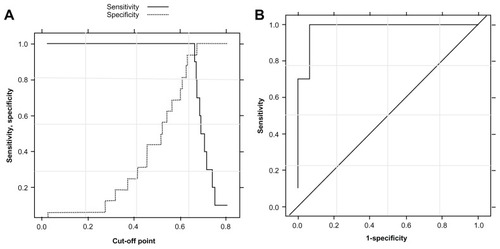
shows evolution of the indexes fitted from all data (n = 26). The differentiation between the AD and NC groups increased progressively when the cumulative impact of parameters k1,P1, k2,P1, k3,P1, and k4,P1 were taken into account. The DAS.,P1() scores fitted from all data (n = 26) differed significantly (Mann–Whitney, P < 0.001) between AD (DASAD,P1 = 0.47, 95% CI 0.38–0.56) and NC (DASNC,P1 = 0.71, 95% CI 0.68–0.74). The Spearman correlation coefficients were ρ (DAS.,P1, MMSE) = 0.81, ρ (DAS.,P1, IADL-E) = −0.65, and ρ (DAS.,P1, diagnosis) = −0.76 (diagnosis = 0 refers to NC group, and diagnosis = 1 refers to AD group) (see ). Based on the measurement of DAS.,P1 scores fitted from all data (n = 26), the test performance provided an area under the ROC of 0.98, 95% CI 0.92–1.00, and for a cutoff point of 0.65 (±0.01), the sensitivity and specificity were 100% and 94% (see ).
Table 6 Spearman’s correlation coefficients between DAS.,n() scores with Diagnosis, MMSE and IADL-E
Figure 1 DAS.,P1 scores for AD patients and NC participants for protocol 1 (P1). The first line (A) represents the ratio of efficacy for the two groups (Grey dots for NC and Black dots for AD). Then the next lines (B–E) show the evolution of the index from ratio of efficacy (index 0) to DAS.,P1 score (index 4) including omission (B), repetition (C), order error (D), and bad completion at the first attempt (E). Measurements represented for each participant j: (A) REff = Index0,P1(j) (Percentage of time spent in the room to behave directed to perform a listed activities). (B)
(impact of omission mistakes on the REff). (C)
(cumulative impact of omission and repetition mistakes on the REff). (D)
(cumulative impact of omission, repetition, and order mistakes on the REff). (E) Final DAS score
(cumulative impact of omission, repetition, order mistakes, and bad completion at the first attempt on the REff).
![Figure 1 DAS.,P1 scores for AD patients and NC participants for protocol 1 (P1). The first line (A) represents the ratio of efficacy for the two groups (Grey dots for NC and Black dots for AD). Then the next lines (B–E) show the evolution of the index from ratio of efficacy (index 0) to DAS.,P1 score (index 4) including omission (B), repetition (C), order error (D), and bad completion at the first attempt (E). Measurements represented for each participant j: (A) REff = Index0,P1(j) (Percentage of time spent in the room to behave directed to perform a listed activities). (B) Index1,P1(j)=[REff(j)]×∏i=14k1,P1a1,F (impact of omission mistakes on the REff). (C) Index2,P1(j)=[REff(j)]×∏i=14k1,P1a1,F1(j) (cumulative impact of omission and repetition mistakes on the REff). (D) Index3,P1(j)=[REff(j)]×∏i=12k1,P2a1,F2(j) (cumulative impact of omission, repetition, and order mistakes on the REff). (E) Final DAS score Sj,P1(k1,P1, k2,P1, k3,P1, k4,P1,) (j)=[REff(j)]×∏i=14k1,P1a1,F1 (j) (cumulative impact of omission, repetition, order mistakes, and bad completion at the first attempt on the REff).](/cms/asset/743098ae-0b15-4ed9-9665-acd125a0ac66/dcia_a_36297_f0001_b.jpg)
Figure 2 Performance evaluation of the assessment methodology to classify observation data as AD group or NC group. (A) Specificity and sensitivity in function of the cutoff point of DAS.,P1() scores. (B) Receiver operating curve associated with protocol 1.
Protocol 2
Population
Nineteen MCI patients (age = 75.2 ± 4.25) and 19 NC (age = 71.7 ± 5.4) were included in protocol 2. shows the clinical and demographic data of the participants. Significant intergroup differences in demographic factors (gender and age) were not seen. The mean MMSE for the MCI group was 25.8 (±2.2) and 28.8 (±1.0) for the NC group (P < 0.001), and the mean IADL-E scores did not differ between groups, with the MCI group having a mean IADL-E score of 9.9 (±1.7) and 9.6 (±1.1) for the NC group.
LOOCV results for DAS.,P2
shows predictive performance results of the assessment methodology to classify the new test data as MCI observation (refers to a positive case) or NC observation (refers to a negative case) using its DAS.,P2() scores fitted using the value of parameter set (k1,P2, k2,P2, k3,P2, k4,P2) defined from the training dataset. Predictive performance results are better with the DAS.,P1 than the DAS.,P2 (eg, higher accuracy rate, higher positive and negative predictive values), which is coherent with the increasing difficulty to differentiate NC participants from patients at earlier stages of AD disease.
Assessment based on DAS.,P2
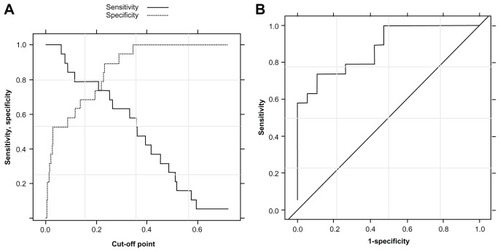
shows evolution of the indexes fitted from all data (n = 38). The first lines (a) represent the ration of efficacy for the two groups (one point represents one patient). The next lines (b, c, d, and e) show the evolution of the index from the ration of efficacy (index 0) to DAS.,P2 score (index 4) with the addition of omission (b), repetition (c), bad achievement (d), and planning mistakes (e). The differentiation between the MCI and NC groups is done progressively with the cumulative impact of parameters k1,P2, k2,P2, k3,P2, and k4,P2. The DAS.,P2 scores differed significantly (P < 0.001) between MCI (DASMCI,P2 = 0.11, 95% CI 0.05–0.16) and NC (DASNC,P2 = 0.36, 95% CI 0.26–0.45). The Spearman correlation coefficients were ρ (DAS.,P2, MMSE) = 0.81, ρ (DAS.,P2, IADL-E) = −0.06, and ρ (DAS.,P2, diagnosis) = −0.66 (diagnosis = 0 refers to NC group, and diagnosis = 1 refers to MCI group) (see ). Based on the measurement of DAS.,P2 scores fitted from all data (n = 38), the test performance provided an area under the ROC of 0.87, 95% CI 0.76–0.99, and for a cutoff point of 0.24 (±0.01), the sensitivity and specificity were 74% and 89% respectively (see ).
Figure 3 DAS.,P2 scores for MCI patients and NC participants for protocol 2 (P2). The first line (A) represents the ratio of efficacy for the two groups (Grey dots for NC and Black dots for MCI). Then the next lines (B–E) show the evolution of the index from ratio of efficacy (index 0) to DAS.,P2 score (index 4) including omission (B), repetition (C), bad achievement of activities (D), and planning errors (E). Measurements represented for each participant j: (A) REff = Index0,P2 (j) (Percentage of time spent in the room to behave directed to perform a listed activities). (B)
(impact of omission mistakes on the REff). (C)
(cumulative impact of omission and repetition (excluding repetition of leisure activities) mistakes on the REff). (D)
(cumulative impact of omission, repetition (excluding repetition of leisure activities) mistakes and bad achievement of activities on the REff). (E) Final DAS score
(cumulative impact of omission, repetition (excluding repetition of leisure activities) mistakes, bad achievements of activities, and planification mistakes on the REff).
![Figure 3 DAS.,P2 scores for MCI patients and NC participants for protocol 2 (P2). The first line (A) represents the ratio of efficacy for the two groups (Grey dots for NC and Black dots for MCI). Then the next lines (B–E) show the evolution of the index from ratio of efficacy (index 0) to DAS.,P2 score (index 4) including omission (B), repetition (C), bad achievement of activities (D), and planning errors (E). Measurements represented for each participant j: (A) REff = Index0,P2 (j) (Percentage of time spent in the room to behave directed to perform a listed activities). (B) Index1,P2(j)=[REff(j)]×k1,P2α1,F2 (j) (impact of omission mistakes on the REff). (C) Index2,P2(j)=[REff(j)]×∏i=12k1,P2a1,F2 (j) (cumulative impact of omission and repetition (excluding repetition of leisure activities) mistakes on the REff). (D) Index3,P2(j)=[REff(j)]×∏i=13k1,P2a1,F2 (j) (cumulative impact of omission, repetition (excluding repetition of leisure activities) mistakes and bad achievement of activities on the REff). (E) Final DAS score Sj,P2 (k1,P2, k2,P2, k3,P2, k4,P2,) (j)=[REff(j)]×∏i=14k1,P2a1,F2 (j) (cumulative impact of omission, repetition (excluding repetition of leisure activities) mistakes, bad achievements of activities, and planification mistakes on the REff).](/cms/asset/fce0e6bb-dbaa-4641-9adf-c67de1345a96/dcia_a_36297_f0003_b.jpg)
Figure 4 Performance evaluation of the assessment methodology to classify observation data as MCI group or NC group. (A) Specificity and sensitivity in function of the cutoff point of DAS.,P2() scores. (B) Receiver operating curve associated with the protocol 2.
Discussion
In the present study, the use of VMS was sought to assess participants during complex daily living activity scenarios. Using VMS, it was possible to determine that in comparison to NC participants, those with AD performed worse on several outcome parameters including the time to achieve the set activities and the number of repetitions of the same activity. These results highlight the importance of executive function in the performance of basic daily activities and are consistent with previous findings.Citation25,Citation26 Esposito et alCitation27 explored executive function and multitasking in daily life using the modified six elements task. In that study, AD patients had significantly more multitasking deficits than NC participants. The VMS method made it possible to define an objective and continuous measure of functional impairment disturbances. It was interesting to note that as the complexity of the DAS score increased, so did the magnitude of the difference between the AD and the NC participants. The complex DAS score included several clinically quantifiable as well as qualitative parameters representative of daily functioning. The complex DAS score was significantly correlated with the MMSE as a marker of global cognitive level. This correlation was strong (0.81) even though the DAS score included specific executive characteristics that were not included in the MMSE, such as repetition, omission, and incorrect order. In addition, the ROC analysis of the DAS score showed 94% sensitivity and 100% specificity for discriminating AD from NC subjects.
Taking these initial results into account, the authors of this present paper designed another scenario aiming to stress more subtle differences between MCI and NC participants. The ROC analysis of the DAS score showed 89% sensitivity and 73% specificity for discriminating MCI from NC participants. More specifically, this second protocol showed that MCI patients had impaired performances on DAS scores and had difficulty correctly reorganizing activities and successfully carrying out the activities. As for the AD patients, the observed impaired performances in the MCI patients highlight the importance of executive and planning parameters in IADLsCitation28 (see ). In fact, there is an increasing call for a stronger consideration of impairment in IADLs in the diagnostic criteria of MCI to improve the prediction of dementia.Citation25 The aim of a recent longitudinal cohort studyCitation29 was to determine the predictive ability of MCI and IADL impairment for incident dementia. As part of the German Study on Ageing, Cognition, and Dementia in Primary Care Patients, a sample of 3327 patients from general practitioners, aged 75 years and older, was assessed with four assessments at 1.5-year intervals over a period of 4.5 years. Results indicate that MCI and IADL are significantly associated with higher conversion to, shorter time to, and better predictive power for future dementia. Regarding IADL, a significant impact was found for impairment in responsibility for one’s own medication, shopping, and housekeeping, and in the ability to use public transport.
Table 7 Ratio of efficacy and qualitative parameters in the two protocols for each diagnosis group
These pilot studies have several limitations. From a logistical point of view, this assessment is not yet reproducible easily in others clinical facilities. In addition, even if the duration of the scenario is relatively short (20 minutes and 15 minutes respectively for the first and second study) the overall duration including preparation of the room and of the patient is too long. From a technical point of view, the main limitation of the computational model in this present study is that it relied on the fact that only the relative position of the participant in the room is automatically processed by computer vision algorithm. Automatic recognition of IADL remains in progress. Therefore, the annotation of timeframe when a participant performs an activity is made manually, which is time consuming for the clinicians. One possible option to have a more automated assessment would be to use other environmental sensors (such as contact sensors) in conjunction with the VMS system to give direct information concerning the correct realization of the activity and the time spent for performing the activity. Finally, a more accurate cognitive assessment for MCI patients to delineate amnesic from non-amnesic MCI patients needs to be proposed.
The next step of the research is to solve most of these technical limitations. These re the objectives of the ongoing European Commission project FP7 Dem@Care devoted to the development of an automatic system providing multiparametric monitoring of daily activity lifestyle behavior in combination with medical data.
In conclusion, this study outlines the interest of a novel tool coming from the ICT world for the assessment of autonomy in AD and MCI. The derived DAS scores provide a pragmatic, ecological, objective measurement which may improve the prediction of future dementia, be used as an outcome measurement in clinical trials, and lead to earlier therapeutic intervention.
Acknowledgments
This study was supported by a grant from the ANR-09-TECS-016-01 – TecSan – SWEET HOME, by the Innovation Alzheimer and ARMEP associations and by the platform patients of the Nice CHU member of the CIU-S.
Disclosure
The authors report no conflict of interests in this work for the past 5 years.
References
- KatzSFordABMoskowitzRWJacksonBAJaffeMWStudies of illness in the aged. The Index of ADL: a standardized measure of biological and psychosocial functionJAMA196318591491914044222
- LawtonMPBrodyEMAssessment of older people: self-maintaining and instrumental activities of daily livingGerontologist1969931791865349366
- AndersenCKWittrup-JensenKULolkAAndersenKKragh-SorensenPAbility to perform activities of daily living is the main factor affecting quality of life in patients with dementiaHealth Qual Life Outcomes200425215383148
- PetersenRCSmithGEWaringSCIvnikRJTangalosEGKokmenEMild cognitive impairment: clinical characterization and outcomeArch Neurol199956330330810190820
- MorrisJCCummingsJMild cognitive impairment (MCI) represents early-stage Alzheimer’s diseaseJ Alzheimers Dis20057323523916006667
- TuokkoHMorrisCEbertPMild cognitive impairment and everyday functioning in older adultsNeurocase2005111404715804923
- ArteroSPetersenRTouchonJRitchieKRevised criteria for mild cognitive impairment: validation within a longitudinal population studyDement Geriatr Cogn Disord2006225–646547017047325
- FariasSTMungasDReedBRHarveyDCahn-WeinerDDecarliCMCI is associated with deficits in everyday functioningAlzheimer Dis Assoc Disord200620421722317132965
- JeffersonALLambeSMoserDJByerlyLKOzonoffAKarlawishJHDecisional capacity for research participation in individuals with mild cognitive impairmentJ Am Geriatr Soc20085671236124318482298
- AlbertMSDeKoskySTDicksonDThe diagnosis of mild cognitive impairment due to Alzheimer’s disease: recommendations from the National Institute on Aging-Alzheimer’s Association workgroups on diagnostic guidelines for Alzheimer’s diseaseAlzheimers Dement20117327027921514249
- SikkesSAVisserPJKnolDLDo instrumental activities of daily living predict dementia at 1- and 2-year follow-up? Findings from the Development of Screening guidelines and diagnostic Criteria for Predementia Alzheimer’s disease studyJ Am Geriatr Soc201159122273228122188074
- RomdhaneRMulinEDerreumeauxAAutomatic video monitoring system for assessment of Alzheimer’s disease symptomsJ Nutr Health Aging201216321321822456775
- Alzheimer Plan 2008–2012 [homepage on the Internet]. Available from: http://www.plan-alzheimer.gouv.frAccessed September 14, 2012
- McKhannGDrachmanDFolsteinMKatzmanRPriceDStadlanEMClinical diagnosis of Alzheimer’s disease: report of the NINCDS-ADRDA Work Group under the auspices of Department of Health and Human Services. Task Force on Alzheimer’s DiseaseNeurology19843479399446610841
- GoetzCGTilleyBCShaftmanSRMovement Disorder Society-sponsored revision of the Unified Parkinson’s Disease Rating Scale (MDS-UPDRS): scale presentation and clinimetric testing resultsMov Disord200823152129217019025984
- FolsteinMFFolsteinSEMcHughPR“Mini-mental state”. A practical method for grading the cognitive state of patients for the clinicianJ Psychiatr Res19751231891981202204
- DuboisBSlachevskyALitvanIPillonBThe FAB: a Frontal Assessment Battery at bedsideNeurology200055111621162611113214
- DuboisBTouchonJPortetFOussetPJVellasBMichelB“The 5 words”: a simple and sensitive test for the diagnosis of Alzheimer’s diseasePresse Med200231361696169912467149
- SunderlandTHillJLMellowAMClock drawing in Alzheimer’s disease. A novel measure of dementia severityJ Am Geriatr Soc19893787257292754157
- AlbercaRSalasDPerez-GilJALozanoPGil-NecigaEVerbal fluency and Alzheimer’s diseaseNeurologia199914734434810570621
- MontgomerySAAsbergMA new depression scale designed to be sensitive to changeBr J Psychiatry1979134382389444788
- YesavageJABrinkTLRoseTLDevelopment and validation of a geriatric depression screening scale: a preliminary reportJ Psychiatr Res198217137497183759
- MathuranathPSGeorgeACherianPJMathewRSarmaPSInstrumental activities of daily living scale for dementia screening in elderly peopleInt Psychogeriatr200517346147416252378
- EfronBGongGA leisurely look at the bootstrap, the jackknife, and cross-validationAm Stat19833713648
- MarshallGARentzDMFreyMTLocascioJJJohnsonKASperlingRAExecutive function and instrumental activities of daily living in mild cognitive impairment and Alzheimer’s diseaseAlzheimers Dement20117330030821575871
- RazaniJCasasRWongJTLuPAlessiCJosephsonKRelationship between executive functioning and activities of daily living in patients with relatively mild dementiaAppl Neuropsychol200714320821417848131
- EspositoFRochatLVan der LindenACApathy and executive dysfunction in Alzheimer diseaseAlzheimer Dis Assoc Disord201024213113720505430
- DechampsAFasottiLJungheimJEffects of different learning methods for instrumental activities of daily living in patients with Alzheimer’s dementia: a pilot studyAm J Alzheimers Dis Other Demen201126427328121502092
- LuckTLuppaMWieseBPrediction of incident dementia: impact of impairment in instrumental activities of daily living and mild cognitive impairment – results from the German Study on Ageing, Cognition, and Dementia in Primary Care PatientsAm J Geriatr Psychiatry Epub June 14, 2012