 ?Mathematical formulae have been encoded as MathML and are displayed in this HTML version using MathJax in order to improve their display. Uncheck the box to turn MathJax off. This feature requires Javascript. Click on a formula to zoom.
Abstract
Dietary intake has been shown to influence the acid–base balance in human subjects; however, this phenomenon is poorly understood and rarely reported for the least well-studied segment of older people in a developing country. The aims of the present study were to: (1) quantify estimates of daily net endogenous acid production (NEAP) (mEq/d) in a sample of otherwise healthy elderly aged 50 years and above; and (2) compare NEAP between the elderly and young to determine the effects of aging, which could contribute to changes in the acid–base balance. Analyses were carried out among 526 elderly and 131 young participants (aged 50–80 and 23–28 years, respectively), all of whom were free of discernible disease, nonsmokers, and not on any chronic medication. Selected anthropometric factors were measured and 24-hour dietary recall was recorded. We used two measures to characterize dietary acid load: (1) NEAP estimated as the dietary potential renal acid load plus organic acid excretion, the latter as a multiple of estimated body surface area; and (2) estimated NEAP based on protein and K. For the young and elderly, the ranges of NEAP were 12.1–67.8 mEq/d and 2.0–78.3 mEq/d, respectively. Regardless of the method used, the mean dietary acid–base balance (NEAP) was significantly higher for the elderly than the young (P = 0.0035 for NEAP [elderly, 44.1 mEq/d versus young 40.1 mEq/d]; and P = 0.0035 for the protein:potassium ratio [elderly, 1.4 mEq/d versus young 1.1 mEq/d]). A positive and significant correlation was found between NEAP and energy, protein, and phosphorus (P < 0.05 for all trends). The findings from this study provide evidence of the relatively higher production of NEAP in older people, possibly as an effect of higher consumption of certain acid-producing foods by the elderly.
Introduction
Acid–base status is becoming increasingly important in geriatric nutrition and related fields, because normal aging has been reported to be associated with an increase in diet-induced acidosis. Acid–base homeostasis is critical to health; examples of the negative health effects of increases in acid loading or acidosis include growth retardation, declines in performance, and increased atrophy and loss of muscle mass.Citation1–Citation4 Frassetto and SebastianCitation5 evaluated a number of previous studies that reported on the levels of hydrogen ions (H+) in the blood of people from age 20 to 100, and found that after age 40, levels of acid-forming H+ ions increased rapidly. These investigators also speculated that progressively worsening metabolic acidosis is likely a product of declining kidney function with increasing age, commonly seen as part of the normal aging process.Citation6 This decline results in a diminished ability to excrete various dietary acids, which may lead to lower blood pH and reduced plasma bicarbonate concentrations.Citation7 Despite their exposure to age-associated increased acid loads, the elderly often consume suboptimal levels of vegetables and fruits, which are potential acid-lowering foods.Citation8,Citation9 This necessarily means that this group of the population is at higher risk of suffering the consequences of dietary acid–base disturbances.
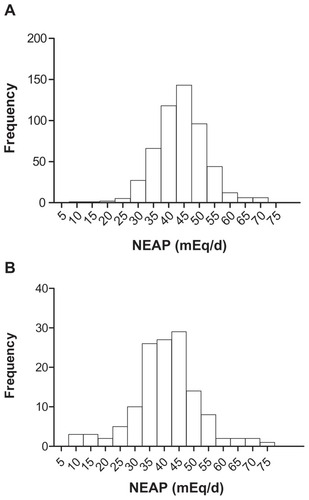
Figure 1 Distribution of the 24-hour recall NEAP by 526 healthy elderly (50–80 years) (A) and 135 young (23–28 years) (B) men.
Abbreviations: NEAP, net endogenous acid production; SD, standard deviation.
Recent shifts in aging demography have resulted in increased numbers of elderly people worldwide. There are certain physical and physiological changes with normal aging resulting in losses of lean tissue mass and gains in adipose tissues,Citation10 which can further add to the effects of age-related dietary changes with consequences for an abnormal acid–base balance. The usual diet of people in Pakistan is dominated by a variety of wheat bread, rice, mutton, and fat. The majority of Pakistanis eat paratha (fat-fried thin bread) in the morning followed by rotti (traditional wheat bread baked in a mud oven), tea, and bread. At lunch and dinner, rotti is the most common food, followed by rice. A majority of Pakistanis eat meals three times a day. The elderly have fixed meal patterns due to social norms, and usually changes towards healthier or balanced diets are very unlikely to happen in this age group.
Nutrition has long been known to strongly influence the acid–base balance in humans.Citation11 A widely accepted and general consensus is that the diet can markedly affect the acid–base status, and that a person’s acid load can be specifically manipulated by dietary means.Citation11–Citation16 Intakes of potassium, magnesium, fruit, and vegetables have been associated with a greater alkaline environment in the human body and a beneficial effect on bone health.Citation17 Most studies on the elderly reporting nutrient intake in relation to the acid–base balance are from Western countries, where diets are generally associated with excess acidity.Citation18–Citation21 To the authors’ knowledge, there have been no data on the dietary habits and nutrient intake in relation to the acid load of the elderly from developing countries, where the differences in socioeconomic and dietary behaviors may have a different impact on the dietary acid load. The present study was conducted to investigate the net acidic excretion (NEAP) from the habitual dietary intake of elderly individuals in Peshawar, who participated in a study of their nutritional and immunological parameters.Citation22,Citation23 The other main objective of the study was to compare the dietary acid load between the young and the elderly in order to establish the effects of age on dietary acid load.
Subjects and methods
Study site, participants, and data collection
The study was conducted in Peshawar, Khyber Pakhtunkhwa Pakistan from 2009–2011. Participants in the current study included a cohort of elderly and young men, who participated in our previous studies conducted for the assessment of anthropometrics, nutritional status, selected blood chemistry values, and immunological parameters.Citation22–Citation25
For the recruitment of the subjects, city registration data were obtained from the local office of the National Database and Registration Authorities in Peshawar. Addresses of the elderly subjects, who fulfilled the age and health criteria for the study, were obtained from the lists provided by the National Database and Registration Authorities. Potential subjects expressing interest in participating in the study were first screened by obtaining a verbal medical history to rule out any health conditions or medication use that could affect their dietary acid loads. Only otherwise medically healthy subjects with no evident disease or infection, and those who were not taking medication on a chronic basis were included.
The subjects were measured for their anthropometric characteristics. Weight and height were measured according to the standardized procedures, and body mass index (BMI) was calculated as weight/height2 according to the standard procedures (kg/m2).Citation22,Citation23
The dietary data were collected using 24-hour dietary recalls (24-hour DR) through face-to-face interviews as we previously reported.Citation22,Citation23 Briefly, a well-structured and extensively validated questionnaire was used for 24-hour DR in face-to-face interviews. During these interview sessions, the subjects were asked to recall what they had eaten during the previous day starting from breakfast in the morning until their last meals at night before sleep. During the 24-hour DR interviews, the intake reported by the subject was verified by someone in the household to avoid over- or underestimation of dietary intake because the elderly might easily forget what they had eaten during the previous 24 hours. Household measures such as cups, bowls, and spoons were used to help estimate quantities of foods consumed. Quantities were recorded according to the amount of food consumed from a particular bowl (for instance, half of the small brown bowl). When interviewees gave answers like, “I used a little or a lot of milk in tea,” they were asked to show this with the cup they used, and the cup volume was later measured to estimate the amount. Nutrient intakes were computed using an in-house nutrient calculator in Microsoft Office Excel 2003 (Microsoft Corporation, Redmond, WA). This calculator is based on data from the food composition tables for Pakistan. Mean and standard deviation (SD) values of energy, protein, selected minerals, and vitamins were determined from dietary intake data.
The current study was approved by the Board of Studies, Department of Human Nutrition, Agricultural University, Peshawar. Written informed consent was obtained from all the participants before the start of study.
Acid–base balance estimation
NEAP of the subjects was estimated indirectly from the participants’ diets using the method of Remer et alCitation2 and Remer and ManzCitation14 using the following equation:Citation2,Citation13,Citation26
Potential renal acid load (PRAL) was calculated directly from dietary intakes using the formula:Citation2,Citation14
Organic acid (OA) was calculated as:Citation2,Citation13,Citation26
Sodium and chloride were not included in the calculation as salt intake was not measured, and these elements tend to balance each other out, as reported by others.Citation27 Calcium was included, although it has been reported to have only a slight effect on the acid–base balance.Citation2 A separate estimate of acid–base balance was arrived at using the method of Frassetto et al,Citation16 which calculates the protein:potassium ratio of the diet expressed as g/mEq.Citation16
Statistical analysis
All anthropometric measurements were made in duplicate and the means of paired values were used in the analyses. The data were statistically analyzed using JMP (version 7.0; SAS Institute, Inc, Cary, NC). The elderly and young were compared for their mean anthropometrics, nutrient intake, and renal acid load values using the Student’s t-test. A multivariable regression model using NEAP as the dependent variable, and age (categorical variable; for example, 1 as the elderly and 0 as the young) as the main independent variable of interest was applied. In this way, the association between NEAP and age was calculated by excluding the potential confounding effects of other variables (eg, weight, as well as protein and phosphorus intake). P < 0.05 was accepted as significant.
Results
gives the age, anthropometric values, nutrient intake, and NEAP of the elderly and young subjects. Compared to the young, the elderly differed significantly in energy, protein, fat, phosphorus, potassium, and magnesium intake (P < 0.05 for all trends). The PRAL and NEAP values in the elderly were significantly lower than in the young (P < 0.05 for all trends).
Table 1 Anthropometrics, nutrient intake, and dietary acid loads of the elderly and young
Correlation analysis
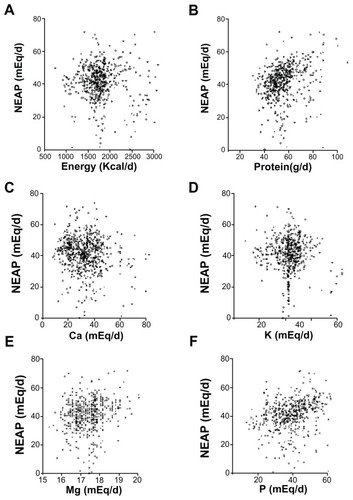
Results were analyzed using both bivariate partial correlation and multiple regressions. Results of partial correlations between NEAP and anthropometrics, as well as macro- and micronutrients are shown in and , respectively. NEAP values were greater at older ages (P = 0.003), and higher BMI (P < 0.0001), greater waist circumference (WC) (P < 0.0001), and greater body fat percentage (%BF) (<0.0001) were also noted. For estimates of NEAP, higher protein (P < 0.0001) and fat (P = 0.0398) were significantly associated with higher acid loads. Higher energy intake was associated with higher acid load, but this did not reach statistical significance (P = 0.2385). Regarding micronutrients, a higher intake of calcium tended to be positively associated with acid load (P = 0.0933); higher phosphorus intake was significantly associated with higher acid load (P < 0.0001), while higher intakes of both magnesium and potassium were significantly associated with lower acid loads (P < 0.05 for all trends). Dietary potassium and magnesium intake are highly interrelated because potassium-rich foods are usually magnesium-rich.Citation28,Citation29
Figure 2 Correlation between NEAP and age and selected anthropometrics. NEAP versus age (A), body mass index (BMI) (B), WC (C), and %BF (D).
Abbreviation: BF, body fat; NEAP, net endogenous acid production; WC, waist circumference.
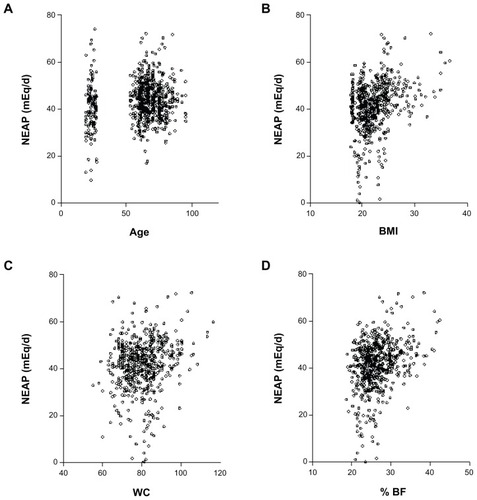
Figure 3 Correlation between NEAP and selected nutrients. NEAP versus energy (A), protein (B), calcium (Ca) (C), potassium (K) (D), magnesium (Mg) (E), and phosphorus (P) (F).
Using multiple regressions, NEAP values were then regressed on the linear combination of age, weight, BMI, WC, %BF, as well as protein and phosphorus intake. The equation containing these variables accounted for 65% of the observed variance in NEAP, F(4, 655) = 21.6, P < 0.05, adjusted R2 = 0.649. Beta weights (standardized multiple regression coefficients) and uniqueness indices were subsequently reviewed to assess the relative importance of these variables in the prediction of NEAP. The uniqueness index for a given predictor indicates the percentage of observed variance in the criterion that is accounted for by this predictor, over and above the variance accounted for by the other predictors. It can also be defined as the squared semi-partial correlation between a criterion variable and the predictor variable of interest, after statistically controlling for the variance that the predictor shares with the other predictors. Age, weight, protein intake, and phosphorus intake displayed significant beta weights (P < 0.05 for all trends), while BMI, WC, and %BF displayed nonsignificant beta weights (P > 0.05 for all trends). Weight demonstrated a somewhat larger beta weight, followed by age, phosphorus intake, and protein intake. Findings regarding the uniqueness indices corresponded to those for beta weights in that age, weight, protein intake, and phosphorus intake displayed significant indices. Age accounted for approximately 28% of the variance in NEAP, beyond the variance accounted for by the other three predictors, F(1, 655) = 68.4; P < 0.05.
Discussion
The major finding of the present investigation was the significantly higher dietary NEAP in the elderly than in the young (P = 0.0112). This is possibly the result of age-associated dietary changes. A positive correlation between age and NEAP (P = 0.0159; ) further supports this notion. These findings are in close agreement with the results of Berkemeyer,Citation30 who reported that 24-hour urinary pH and net acid excretion (5.94, 60.03 mEq/d) in the elderly were significantly lower (P < 0.05) and higher (P < 0.05), respectively, compared to the younger age groups.
In the present study, a wide range of acid–base values was found using both the RemerCitation2,Citation13 and FrassettoCitation16 methods, which provided NEAP and protein/potassium ratios, respectively. For the young and the elderly, ranges of NEAP were 12.1–67.8 mEq/d and 2.0–78.3 mEq/d, respectively. Regardless of the method used, the mean dietary acid–base balance (NEAP) was significantly higher for the elderly than the young; P = 0.0035 for NEAP (elderly, 44.1 mEq/d versus young, 40.1 mEq/d) and P = 0.0035 for the protein:potassium ratio (elderly, 1.4 mEq/d versus young, 1.1 mEq/d) ().
The values for NEAP (elderly, 44.1 mEq/d versus young 40.1 mEq/d) reported in this study are much lower than those reported by Prynne et al (67.8 mEq/d).Citation31 However, since Prynne et alCitation31 only reported acid loads for teenagers in their study, an age effect might be the reason for this difference. Another study on 400 elderly (aged 55–75 years) reported a mean NEAP value of 60 (SD 27.0) mEq/d,Citation32 a value almost identical to that reported in the elderly by Remer and Manz;Citation13 however, this value was larger than the one we found in the present study (elderly, 44.1 mEq/d versus young, 40.1 mEq/d). Given that these other studies were conducted in developed countries (England and the UK), where differences in dietary practices include more acid-forming diets (large amounts of meat, fish, and poultry), this might explain the higher dietary acid loads.Citation33 Another plausible reason for the lower value of NEAP in our study may be that the basic mineral, calcium, has not been excluded from the NEAP equation in our study. Removing calcium from the formula would have resulted in relatively higher NEAP values (elderly, 52.0 mEq/d versus young, 47.4 mEq/d), as also argued by Gannon et al.Citation27 Interestingly, however, LemannCitation34 estimated that the average diet consumed by healthy American adults generates approximately 50 mEq/d, a value very similar to ours. Similarly, our results are also in close agreement with the findings of Gannon et al,Citation27 who reported a median value for an acid load of 47.9 mEq/d in an elderly population living in different geographical areas of the UK.
In our study, most of the results from the correlation analysis between NEAP and both the anthropometric characteristics and nutrients ( and ) are in close agreement with the findings of the above-mentioned study by Gannon et al,Citation27 as well as with a number of other studies (reviewed in BerkemeyerCitation35). The relationships between NEAP and macro- and micronutrients were to some extent, but not entirely, in accordance with what we initially expected, demonstrating the importance of examining how these nutrients may have an impact on dietary acid load. Gannon et alCitation27 reported a significantly positive association between acid load and energy, protein, and phosphorus intake. In the current study, we also noted essentially the same trends insofar as, with an increase in energy intake, there was also an increase in NEAP. Another factor is that the OA component of the equation, which is a major contributor to overall acidity, is predicted from body size, and the data from the current study vary positively in association with energy intake, albeit to a much lesser extent than protein or phosphorus.
In terms of dietary habits, what might explain the relatively higher acid loads noted in the elderly as compared to the young in the present study? There are a number of possibilities. As an example, our dietary survey showed that potatoes were largely consumed by the young, and in a variety of different ways (roasted, baked, boiled, and so on) (data not shown). Potatoes are rich in potassium content,Citation27 which may help to reduce the dietary acid load, as possibly also seen in the present study (lower acid loads among the young). Similarly, young subjects in the present study seemed to consume larger quantities of fruits and vegetables, which the elderly did not (primarily due to chewing and dental problems), and hence this could be another reason for the higher dietary acid loads observed in the elderly as compared to the young. The intake of potassium, magnesium, fruit, and vegetables has been associated with a more alkaline environment in the human body.Citation11 Almost all vegetables and fruits are rich sources of potassium, as previously reported by others.Citation13,Citation31,Citation36,Citation37 One epidemiological study of 384 healthy men and women aged 65 years and above found an association between a higher intake of foods rich in potassium (fruits and vegetables) and greater lean muscle mass.Citation10 The authors of this study speculated that “this association is likely to result from the fact that the ingestion of potassium-rich alkaline foods such as fruit and vegetables relieves the mild metabolic acidosis that occurs with the ingestion of a typical American diet,” and suggested that it is plausible that age-related muscle mass decline and sarcopenia may be prevented by the appropriate intake of alkaline potassium salts.
It has been suggested and argued that food combinations are also very important for the acid–base balance.Citation27 We noted in our study that the elderly had a tendency to eat vegetables (including potatoes, green leafy vegetables, pumpkin, etc), which are alkali-generating, only when cooked and served with meat, fish, and eggs, which may be one of the reasons for the increased dietary acidity. In contrast, the young ate vegetables alone, which were mostly uncooked, in the form of salad, for example. This unique dietary pattern in the elderly is of vital importance as far as their acid–base homeostasis is concerned. Animal protein, grain, and high amounts of milk increases the acidity of the body, whereas foods rich in minerals such as green vegetables and fruit increase the alkalinity.Citation38 A typical Western diet (with high levels of animal protein and low amounts of vegetables) is likely to induce a chronic, low-grade metabolic acidosis.Citation33 Age-associated decline in renal function implies that the capacity of the kidneys to excrete acid is decreased,Citation8 which leads to a lower blood pH in addition to a reduced plasma bicarbonate concentration.Citation7 As the elderly are generally apt to consume lower amounts of fruits and vegetables,Citation8,Citation9 they constitute a risk group for acid–base disturbances and related conditions, and hence they are likely to experience an increased secretion of calcium and possibly magnesium.
Although we did not consider any health consequences in relation to higher or lower dietary acid loads in the present study, overwhelming evidence supports the negative effects of imbalances in acid–base homeostasis across a number of health disorders (for example, bone loss, skeletal muscle atrophy, and nephrolithiasis) in the aging population.Citation1–Citation4,Citation7,Citation39 Interestingly, Wachman and Bernstein hypothesized decades ago that consuming a typical Western diet (high in animal protein, low in vegetables, highly acidic) may result in the lifelong utilization of the buffer salts found in bone, leading to bone fragility and osteoporosis.Citation19,Citation30 Furthermore, Frassetto et alCitation40 have recently demonstrated that plasma bicarbonate concentration and glomerular filtration rate associated with increasing age causes these parameters to fall, whereas blood hydrogen ion concentrations increase with age. This, in turn, leads to an increasingly worsening low grade metabolic acidosis and is reflective of increases in dietary acidity. If the acid–base/skeleton theory is to be believed,Citation41,Citation42 the findings of the present study have important implications with respect to advocating for dietary acid–base advice in the aging population, particularly in elderly women. This could include programs to increase fruit and vegetable consumption in those participants with the highest estimates of NEAP.
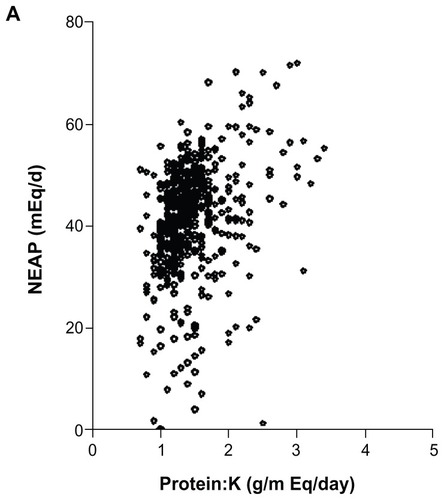
There are some methodological issues relevant to the present work that are worth discussing here. Acid–base effects of foods are determined by a number of methods. Measuring 24 hour urine pH is one way, but it is not practical for large populations. A model based on only five nutrients has been shown to predict renal acid load in children.Citation14 Protein, phosphorus, potassium, magnesium, and calcium were used to calculate PRAL, and this correlated well with urine pH. Remer and ManzCitation13 tested foods and their effect on urine pH, and listed foods according to their PRAL. Accordingly, fats and oils are neutral; fish, meats, eggs, grains, nuts, and dairy products have positive PRALs; and fruits, vegetables, and, to a lesser extent, beverages, have negative PRALs. Another, simpler method has been proposed to estimate dietary acid load by measuring the ratio of the protein:potassium content of food eaten. A study by Frassetto et alCitation16 analyzed 20 diets with protein content ranging from 39 to 193 g per day, and potassium content from 40 to133 mEq/d. The ratio of protein:potassium content varied over a fivefold range, from 0.45 to 2.21, and these ratios correlated very well with the data presented by Remer and Manz.Citation14 These data suggest that acid load can be predicted by simply determining the protein and potassium content of the diet.Citation16 This trend towards close agreement between the two methods has previously been observed by other investigators as well.Citation27,Citation31 In the current study, we used both methods and found a strong correlation between them (r = 0.764; ), suggesting that these methods can be used alternatively.
Figure 4 Comparison of estimates of acid–base balance using NEAPCitation13 and protein:potassium (K) ratio.Citation16
A limitation of the present study is the lack of information on female participants, who are likely to be influenced differently by acid–base balances.Citation27 Also, in our study we could not differentiate between the acidity of the same food types that were prepared differently. It would be interesting to look at the effects of both food preparation and wholegrain versus refined grains on NEAP. This is certainly an area deserving further research, as also suggested by other investigators.Citation27 Body shape, overall size, and body composition are likely to change with age,Citation23 and future work to confirm the predictive value for OA from surface area in different population groups is needed to assess changes in body shape, size, and composition. Nevertheless, we conclude that these analyses provide an insight into the acid generating potential of the diet of a relatively small sample of Pakistani elderly people, showing the diet to be rich in dietary acid precursors, which are higher in the elderly than in the young, and increasing with age. Such trends may also be found in other developing societies with similar diets and, in turn, may have important consequences for this vulnerable group. Although it has been suggested that merely reducing dietary acid load is not sufficient in preventing the age-related worsening of acidosis and the resulting muscle breakdown, the intake of lower acid-producing diets could help slow down this age-related acidogenesis.Citation11
Conclusion
The present study reaffirms the evidence that dietary acid load increases with age, thus putting the elderly at relatively higher risks of dietary acidity. Beside age, BMI and body fat also showed positive correlations with acid loads, which further reaffirms the relationship between weight gain and acid load. Low intakes of vegetables and fruits have been found to be factors associated with higher acid loads in the elderly.
Acknowledgment
We are thankful to the study participants and the students of the Department of Human Nutrition AUP, KPK for their help in collecting these data.
Disclosure
The authors report no conflicts of interest in this work.
References
- GreenhaffPLGleesonMMaughanRJDiet-induced metabolic acidosis and the performance of high intensity exercise in manEur J Appl Physiol Occup Physiol19885755835903396576
- RemerTDimitriouTManzFDietary potential renal acid load and renal net acid excretion in healthy, free-living children and adolescentsAm J Clin Nutr20037751255126012716680
- ManzFHistory of nutrition and acid-base physiologyEur J Nutr200140518919911842944
- MitchWEDuJCellular mechanisms causing loss of muscle mass in kidney diseaseSemin Nephrol200424548448715490416
- FrassettoLASebastianAAge and systemic acid-base equilibrium: analysis of published dataJ Gerontol A Biol Sci Med Sci1996511B91998548506
- HemmelgarnBRZhangJMannsBJProgression of kidney dysfunction in the community-dwelling elderlyKidney Int200669122155216116531986
- FrassettoLMorrisRCJrSebastianAPotassium bicarbonate reduces urinary nitrogen excretion in postmenopausal womenJ Clin Endocrinol Metab19978212542598989270
- FrassettoLMorrisRCJrSellmeyerDEToddKSebastianADiet, evolution and aging – the pathophysiologic effects of the post-agricultural inversion of the potassium-to-sodium and base-to-chloride ratios in the human dietEur J Nutr200140520021311842945
- SlimaniNFaheyMWelchAADiversity of dietary patterns observed in the European Prospective Investigation into Cancer and Nutrition (EPIC) projectPublic Health Nutr200256B1311132812639235
- Dawson-HughesBHarrisSSCegliaLAlkaline diets favor lean tissue mass in older adultsAm J Clin Nutr200887366266518326605
- RemerTInfluence of diet on acid-base balanceSemin Dial200013422122610923348
- DwyerJFoulkesEEvansMAusmanLAcid/alkaline ash diets: time for assessment and changeJ Am Diet Assoc19858578418454008836
- RemerTManzFEstimation of the renal net acid excretion by adults consuming diets containing variable amounts of proteinAm J Clin Nutr1994596135613618198060
- RemerTManzFPotential renal acid load of foods and its influence on urine pHJ Am Diet Assoc19959577917977797810
- RemerTManzFDietary protein as a modulator of the renal net acid excretion capacity: evidence that an increased protein intake improves the capability of the kidney to excrete ammoniumJ Nutr Biochem1995b68431437
- FrassettoLAToddKMMorrisRCJrSebastianAEstimation of net endogenous noncarbonic acid production in humans from diet potassium and protein contentsAm J Clin Nutr19986835765839734733
- NewSARobinsSPCampbellMKDietary influences on bone mass and bone metabolism: further evidence of a positive link between fruit and vegetable consumption and bone health?Am J Clin Nutr200071114215110617959
- RaffertyKHeaneyRPNutrient effects on the calcium economy: emphasizing the potassium controversyJ Nutr20081381166S171S18156419
- TylavskyFASpenceLAHarknessLThe importance of calcium, potassium, and acid-base homeostasis in bone health and osteoporosis preventionJ Nutr20081381164S165S18156418
- Lanham-NewSAThe balance of bone health: tipping the scales in favor of potassium-rich, bicarbonate-rich foodsJ Nutr20081381172S177S18156420
- VormannJRemerTDietary, metabolic, physiologic, and disease-related aspects of acid-base balance: foreword to the contributions of the second International Acid-Base SymposiumJ Nutr20081382413S414S18203912
- AlamILarbiAPawelecGParachaPIA comparison of anthropometrics, biochemical variables and nutrient intake between young and elderly rural Pakistani menJournal of Aging Research and Clinical Practice201212116124
- AlamILarbiAPawelecGNutritional status influences peripheral immune cell phenotypes in healthy men in rural PakistanImmun Ageing2012911622863368
- AlamIGoldeckDLarbiAPawelecGAging affects the proportions of T and B cells in a group of elderly men in a developing country-a pilot study from PakistanAge (Dordr) Epub July 19, 2012
- AlamILarbiAPawelecGParachaPIRelationship between anthropometric variables and nutrient intake in apparently healthy male elderly individuals: a study from PakistanNutr J20111011121992515
- ManzFVecseiPWeschHRenal acid excretion and renal molar load in healthy children and adultsMonatsschr Kinderheilkd19841323163167 German6727889
- GannonRHMillwardDJBrownJEEstimates of daily net endogenous acid production in the elderly UK population: analysis of the National Diet and Nutrition Survey (NDNS) of British adults aged 65 years and overBr J Nutr2008100361562318394215
- TuckerKLHannanMTChenHCupplesLAWilsonPWKielDPPotassium, magnesium, and fruit and vegetable intakes are associated with greater bone mineral density in elderly men and womenAm J Clin Nutr199969472773610197575
- SouciSWFachmannWKrautHDie Zusammensetzung der Lebensmittel Nährwert-Tabellen [Food Composition and Nutrition Tables]Stuttgart, GermanyMedpharm Scientific Publishers1994 German
- BerkemeyerSDietary and Renal Acid Load Across Various Age-Groups [doctoral thesis]BonnUniversity of Bonn2008
- PrynneCJGintyFPaulAADietary acid-base balance and intake of bone-related nutrients in Cambridge teenagersEur J Clin Nutr200458111462147115162137
- FrassettoLAToddKMMorrisRCJrSebastianAWorldwide incidence of hip fracture in elderly women: relation to consumption of animal and vegetable foodsJ Gerontol A Biol Sci Med Sci20005510M58559211034231
- SebastianAFrassettoLASellmeyerDEMerriamRLMorrisRCJrEstimation of the net acid load of the diet of ancestral preagricultural Homo sapiens and their hominid ancestorsAm J Clin Nutr20027661308131612450898
- LemannJJrRelationship between urinary calcium and net acid excretion as determined by dietary protein and potassium: a reviewNephron199981Suppl 118259873210
- BerkemeyerSAcid-base balance and weight gain: are there crucial links via protein and organic acids in understanding obesity?Med Hypotheses200973334735619410381
- BuclinTCosmaMAppenzellerMDiet acids and alkalis influence calcium retention in boneOsteoporos Int200112649349911446566
- BlatherwickNRThe specific role of foods in relation to the composition of the urineArch Intern Med191414409450
- RemerTInfluence of nutrition on acid-base balance – metabolic aspectsEur J Nutr201040521422011842946
- FrassettoLALanham-NewSAMacdonaldHMStandardizing terminology for estimating the diet-dependent net acid load to the metabolic systemJ Nutr200713761491149217513412
- FrassettoLAMorrisRCJrSebastianAEffect of age on blood acid-base composition in adult humans: role of age-related renal functional declineAm J Physiol19962716 Pt 2F111411228997384
- BushinskyDAAcid-base imbalance and the skeletonEur J Nutr200140523824411842949
- ArnettTRegulation of bone cell function by acid-base balanceProc Nutr Soc200362251152014506899