 ?Mathematical formulae have been encoded as MathML and are displayed in this HTML version using MathJax in order to improve their display. Uncheck the box to turn MathJax off. This feature requires Javascript. Click on a formula to zoom.
Abstract
Purpose
The aim of this paper is to investigate whether bioelectrical impedance vector analysis (BIVA) can be a suitable technique for the assessment of sarcopenia. We also investigate the potential use of specific BIVA as an indicator of sarcopenic obesity.
Subjects and methods
The sample comprised 207 free-living elderly individuals of both sexes, aged 65 to 93 years. Anthropometric and bioelectrical measurements were taken according to standard criteria. The “classic” and “specific” BIVA procedures, which respectively correct bioelectrical values for body height and body geometry, were used. Dual energy X-ray absorptiometry (DXA) was used as the reference method for identifying sarcopenic and obese sarcopenic individuals. Bioelectrical and DXA values were compared using Student’s t-test and Hotelling’s T2 test, as well as Pearson’s correlation coefficient.
Results
According to classic BIVA, sarcopenic individuals of both sexes showed higher values of resistance/height (R/H; p < 0.01) and impedance/height (Z/H; p < 0.01), and a lower phase angle (p < 0.01). Similarly, specific BIVA showed significant differences between sarcopenic and nonsarcopenic individuals (men: T2 = 15.7, p < 0.01; women: T2 = 10.7, p < 0.01), with the sarcopenic groups showing a lower specific reactance and phase angle. Phase angle was positively correlated with the skeletal muscle mass index (men: r = 0.52, p < 0.01; women: r = 0.31, p < 0.01). Specific BIVA also recognized bioelectrical differences between sarcopenic and sarcopenic obese men (T2 = 13.4, p < 0.01), mainly due to the higher values of specific R in sarcopenic obese individuals.
Conclusion
BIVA detected muscle-mass variations in sarcopenic individuals, and specific BIVA was able to discriminate sarcopenic individuals from sarcopenic obese individuals. These procedures are promising tools for screening for presarcopenia, sarcopenia, and sarcopenic obesity in routine practice.
Keywords:
Introduction
Physiological aging is associated with large and progressive body composition variations, particularly a decline of fat-free mass (FFM),Citation1 that expose elderly individuals to the risk of geriatric syndromes such as sarcopeniaCitation2 and sarcopenic obesity.Citation3
According to the current consensus on definitions of the syndrome,Citation4–Citation8 sarcopenia is characterized by both muscle-mass reduction and low muscle strength or physical performance.Citation8 The European Working Group on Sarcopenia in Older People (EWGSOP) also defined a “presarcopenia” stage characterized by low muscle mass in reference to the standard population, without muscle strength or functional impairment, and a “severe sarcopenia” stage that appears when the three deficits – muscle mass, strength, and function loss – are present.Citation4
Sarcopenic obesity arises when a low muscle mass is associated with obesity.Citation3 Stenholm et alCitation9 suggested the term “obesity/muscle impairment syndrome,” which is related to the loss of muscle function rather than the loss of muscle mass only. The impact of adipose tissue on sarcopenia is also relevant because of the fat infiltration into muscle observed in older individuals,Citation10 which can be associated with lower muscle performance.Citation11,Citation12 To account for these variations, the simultaneous evaluation of fat and muscle have been recommended.Citation8
The suggested techniques for the assessment of body composition in research and practice are body-imaging techniques, computed tomography (CT), and magnetic resonance imaging (MRI) as the gold standards, and dual energy X-ray absorptiometry (DXA) as the preferred alternative method.Citation4,Citation8 The EWGSOP indicated bioelectrical impedance analysis (BIA) is “a good portable alternative” method.Citation4 With its low cost and because it is quick and simple to use, BIA has also been suggested for the “systematic and repeated evaluation of FFM in clinical practice.”Citation13 However, the traditional approach using prediction equations has been questioned because of the variable level of body hydration between individuals, and the technique has been discouraged for the assessment of sarcopenia.Citation6,Citation8
Bioelectrical impedance vector analysis (BIVA) is an interesting alternative approach to BIA that allows the evaluation of body cell mass and hydration without the need for predictive equations.Citation14 It has been used to evaluate many pathological conditionsCitation15 and is demonstratively sensitive to hand-grip strength variations.Citation16 However, classic BIVA showed low efficacy when evaluating body-fat percentage.Citation17 A recently proposed variant of classic BIVA, “specific” BIVA, has been shown to accurately identify body-fat variations in a sample of elderly Italian aged 65 to 93 yearsCitation17 and in a sample of adults from the US (Buffa et al, unpublished data, 2012).
The aim of this paper is to show that BIVA can be a suitable technique for the assessment of sarcopenia in clinical routine practice by comparing the results with those obtained using DXA. Moreover, we aim to show the potential use of specific BIVA to evaluate fat mass, looking ahead to the use of this new procedure for the assessment of sarcopenic obesity.
Subjects and methods
Subjects
The study group consisted of 207 individuals (132 women and 75 men) aged 65 years and over (mean age 70.8 ± 4.0 in women and 75.8 ± 6.9 in men). All individuals were born and resided in Italy. The volunteers were recruited from public gyms in Padua, Italy. Medical personnel from the Geriatrics Department of Padua University established volunteers’ health conditions using clinical history, clinical examination, and biochemical test results. The following were the exclusion criteria: severe cardiovascular or pulmonary disease, uncontrolled metabolic disease (diabetes, anemia, or thyroid disease), electrolyte abnormalities, cancer, or inflammatory conditions. Moreover, individuals with bioelectrical characteristics indicative of dehydration (four women and one man) on the basis of BIVA were omitted from the analyses.
In accordance with the Helsinki Declaration of 1975, as revised in 2008, all subjects were informed about the objectives and methods of the research, and the individuals consented to participate in the study.
Measurements
Detailed personal information, behavioral information, and medical history were collected by means of a structured interview. Anthropometrical (five variables), bioelectrical (two variables), and DXA (15 variables) measurements were taken in the morning by experienced operators. The anthropometric measurements (weight and height, as well as upper arm, waist, and calf circumferences) were taken in accordance with standard international criteria.Citation18 Body mass index (BMI: weight/height2 [kg/m2]) was also calculated.
The bioelectrical values of resistance (R, Ohm) and reactance (Xc, Ohm) were obtained using the impedentiometer analyzer BIA 101 (Akern, Florence, Italy), according to standard international criteria.Citation19 The phase angle was calculated as arctan Xc/R (degrees) and the impedance (Z, Ohm) as (R2 + Xc2)0.5.
Classic BIVA was applied.Citation14 Individual vectors, adjusted for height (R/H, Ohm/m; Xc/H, Ohm/m) in order to eliminate conductor length effect, can be projected on a Cartesian plane defined by R/H and Xc/H (R/Xc graph). Individual or sample characteristics can be compared with tolerance ellipses (50%, 75%, and 95% of cases) representing the variability of the reference population (in this case, the whole sex-specific sample under study). The major axis refers to hydration status (dehydrated individuals tending towards the upper pole), and the minor axis refers to body cell mass (higher values on the left side).
Specific BIVACitation17 was also applied. In order to compensate for the effect of the whole conductor volume, bioelectrical values were multiplied by a correction factor (A/L, in meters) for which area (A) and length (L) were estimated as follows:
where segment area = C2/4JI, and C (m) is the circumference of the arm, waist, and calf, respectively; L = 1.1 H (m). Coefficients were attributed considering the differential contribution of body segments to the whole body’s resistanceCitation19 and the length proportions.Citation20
These new bioelectrical variables, multiplied by a factor of 100 to obtain the same order of magnitude as the classic values, represent a proxy of resistivity, or specific resistance (R sp, Ohm · cm), and reactivity, or specific reactance (Xc sp, Ohm · cm). Impedivity (Z sp, Ohm · cm) was calculated as follows: (R sp2 + Xc sp2)0.5. Phase angle values remained unchanged with respect to classic BIVA.
Specific resistance has a positive relation with the relative amount of fat mass, which explains the variation along the major axis of specific tolerance ellipsesCitation17 (Buffa et al, unpublished data, 2012), while specific reactance (Buffa et al, unpublished data, 2012), as well as the phase angle,Citation21 are mainly – negatively – related to extracellular/intracellular water (ECW/ICW) ratio.
DXA fan-beam technology (QDR 4500 W; Hologic Inc, Bedford, MA) was used to assess fat mass (FMDXA, kg), fat-free mass (FFMDXA, kg) (ie, the sum of lean soft tissue mass and bone mineral content), the relative amount of fatness (FMDXA%), and the skeletal muscle mass index (SMI) (ie, the sum of lean mass of the four limbs (appendicular skeletal muscle mass [ASM]) corrected for the height squared: ASM/height2 (kg/m2)).Citation22 DXA has good reproducibility in determining soft-tissue composition and a good agreement with other reference methods.Citation23
Statistical analysis
The cut-offs for sarcopenia were defined by the SMI values two standard deviations below the mean of a young sex-specific Rosetta Study group (7.26 kg/m2 for men and 5.45 kg/m2 for women), as suggested by Baumgartner et al.Citation22 The cut-offs for sarcopenic obesity corresponded to the sex-specific median values of the FMDXA%. Both the median FMDXA% values of the Rosetta Study (27% for men and 38% for women)Citation22 and of our sample were applied.
Differences in the anthropometric and body composition characteristics between groups with and without sarcopenia, and between sarcopenic obese and nonobese individuals, were assessed with Student’s t-test. Pearson’s product-moment correlation coefficients between anthropometrical/bioelectrical values and body composition indicators were calculated. Given the sex-related differences, all data analyses were stratified by sex.
The mean impedance vectors of groups with differing sarcopenia status were compared with the Hotelling’s T2 test and graphically compared with the 95% probability confidence ellipses. Mahalanobis distance D was also calculated.
Statistical analyses were performed using the free software R and BIVA. All statistical tests were two-tailed, and statistical significance was assumed for a p-value < 0.05.
Results
On the basis of SMI values,Citation22 sarcopenia was diagnosed in 18 men (24.3% of the male sample) and in five women (3.9% of the female sample).
Sarcopenic individuals of both sexes showed lower weight (p < 0.01), circumference values (p < 0.01), BMI (p < 0.01), and quantities of FMDXA and FFMDXA (p < 0.01), with respect to nonsarcopenic individuals (). Sarcopenic women also showed a lower percentage of FMDXA (p < 0.05) and sarcopenic men a higher age (p < 0.01). Height was not significantly different between groups.
Table 1 Descriptive and comparative statistics: sarcopenic versus nonsarcopenic individuals
Classic BIVA detected significant differences between sarcopenic and nonsarcopenic groups (both sexes) due to the higher values of R/H, Z/H, and the lower phase angle of sarcopenic individuals ( and ), while Xc/H values were not different between groups.
Figure 1 Mean impedance vectors and confidence ellipses from groups with and without sarcopenia.
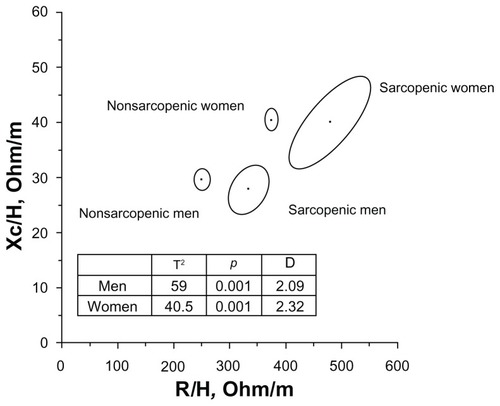
Specific BIVA also recognized significant differences between sarcopenic and nonsarcopenic individuals (men: T2 = 15.7, p < 0.01; women: T2 = 10.7, p < 0.01), with the sarcopenic groups showing lower specific reactance and a lower phase angle ().
Phase angle was significantly correlated with ASM (men: r = 0.51, p < 0.01; women: r = 0.38, p < 0.05) and SMI (men: r = 0.52, p < 0.01; women: r = 0.31, p < 0.01).
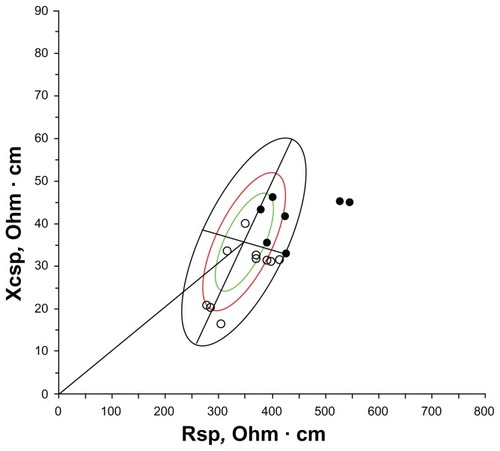
According to the FMDXA% cut-offs of the Rosetta Study (27% for men and 38% for women),Citation22 the number of sarcopenic obese individuals was very low: three men and no woman. Using the median FMDXA% values of the present sample (23.8% for men and 36.4% for women), eight sarcopenic men and one sarcopenic woman had a relative amount of fat higher than the sex-specific cut-offs. Because of the numerical paucity of the female sarcopenic individuals, the subsequent analyses were performed in men only. Sarcopenic obese men showed significantly higher BMI (p < 0.01), waist circumference (WC) (p < 0.01), and SMI (p < 0.01), but nonobese men had similar ages and weights. Specific BIVA, but not classic BIVA, detected significant differences (T2 = 13.4, p < 0.01) between groups ( and ), with specific resistance, reactance, and impedance being higher in the obese group; phase angle was not significantly different. The specific bioelectrical vectors of all sarcopenic-obese individuals were located on the right upper quadrant of the specific tolerance ellipses, with the vectors corresponding to the three men with FMDXA% values higher than 27% (median value of the Rosetta Study)Citation22 outside the 95% ellipse ().
Table 2 Descriptive and comparative statistics: sarcopenic versus sarcopenic obese men
Figure 2 Mean impedance vectors and confidence ellipses from sarcopenic men with FM% higher or lower than the median value of the sex-specific whole sample. (A) Classic BIVA; (B) specific BIVA.
Abbreviations: D, Mahalanobis distance; FM, fat mass; H, height; R, resistance; sp, specific; Xc, reactance.
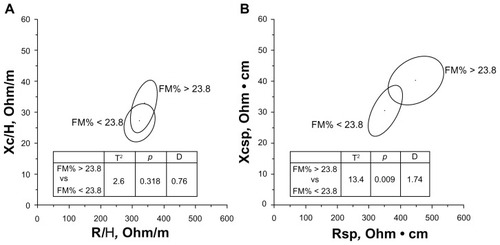
Figure 3 The individual specific vectors of sarcopenic men plotted on the sex-specific bivariate tolerance ellipse.
Abbreviations: R, resistance; sp, specific; Xc, reactance.
Discussion
As shown by both classic BIVACitation14 and the newly proposed specific approach,Citation17 sarcopenic individuals were characterized by peculiar bioelectrical characteristics. In particular, classic BIVA recognized a lower phase angle and a longer impedance vector (due to the higher values of R/H) in sarcopenic individuals than in nonsarcopenic individuals. These results are consistent with the theoretical expectations of BIVA, as the sarcopenic mean impedance vector was located in the region of the RXc graph corresponding to lean individuals.Citation14 In general, a low phase angle is related to a low body cell massCitation14 and to a high ECW/ICW ratio.Citation21 Castillo-Martínez et alCitation24 found a low phase angle and a high R/H (but also, differently from us, low Xc/H values) in cachectic individuals. Norman et alCitation16 obtained a similar displacement of the impedance vector in patients with low hand grip strength. The authors interpreted such vector migration as indicative of low muscle function and suggested the use of BIVA in place of hand-grip strength tests when subjects are not cooperative.Citation16
We cannot exclude the possibility that the peculiar bioelectrical pattern found in sarcopenic individuals could be due to a loss of muscle function, as Norman et alCitation16 suggest. However, it is certainly associated with the lower body cell mass, FFM in particular, of sarcopenic individuals.
Noticeably, the significant relation between phase angle and the reliable biomarkers of body cell mass (ASM and SMI) obtained in this research confirm the expectations of Piccoli et al.Citation14 These results are also in accordance with those of Kyle et al,Citation25 who found a similar positive relation between reactance and ASM, but disagree with those of Pietrobelli et al,Citation26 whose results showed that phase angle does not add significantly to BIA prediction models. Moreover, the lower phase angle of sarcopenic individuals can be related to a higher ECW/ICW ratioCitation21 (Buffa et al, unpublished data, 2012), a parameter that can be associated in relation with BCM,Citation27 which is, in turn, related to muscle mass.Citation28 According to specific BIVA, and in particular on the basis of similar R sp values in sarcopenic and nonsarcopenic individuals, the mean differences in the relative quantity of fat mass were not evident (with a p-value slightly above the significance level in women). In effect, the FMDXA% mean differences were not significant in men, while in women they reached a significance level of p < 0.05 (higher FMDXA% values in nonsarcopenic women).
Interestingly, BMI was significantly higher in the “normal” groups (p < 0.01 in both sexes), showing that, as recently clearly stated by Thibault and Pichard,Citation13 it is more an indicator of body mass than body composition.
Specific BIVA, but not classic BIVA, recognized bioelectrical differences between sarcopenic and sarcopenic obese men, as shown in . The higher values of R sp in sarcopenic obese individuals indicated a greater proportion of fat in their bodies (). Moreover, the impedance vectors of all sarcopenic obese individuals were located in the upper right quadrant (), a region of the specific tolerance ellipses that was recognized as corresponding to obesityCitation17 (Buffa et al, unpublished data, 2012). The validation of appropriate cut-offs in a larger reference sample would confirm the suitability of this procedure for the diagnosis of sarcopenic obesity.
With respect to other standard clinical methods, such as DXA or MRI, BIVA has some methodological advantages. It can easily be performed by a single operator very quickly (less than 10 minutes per patient), is completely safe because no radiation exposure is needed, and has low maintenance and operational costs.
With respect to other simple adiposity indexes, such as WC and BMI, BIVA appears more adequate in recognizing body composition variations. BIVA analyzes electrical properties of tissues and is sensitive to changes of body cell mass and hydration;Citation14,Citation15 specific BIVACitation17 has been shown to accurately evaluate the relative amounts of fat and FFM, so it is probably sensitive to skeletal muscle fat infiltration and inflammatory states. According to Siervo et al,Citation29 BMI and WC showed the worst performance when classifying sarcopenic obesity in a large sample of women. Moreover, the visceral fat distribution detected by WC is a dimorphic character more pronounced in men than in women; in fact, even though in the present research WC showed significant differences between sarcopenic and sarcopenic obese men (), in women the correlation of WC with FM% (r: 0.42, p < 0.01) was lower than the correlation between R sp and FM% (r: 0.62, p > 0.01).
Conclusion
BIVA was confirmed to be a useful technique for detecting muscle-mass variations in sarcopenic individuals, with specific BIVA able to discriminate sarcopenic from sarcopenic obese individuals. These low-cost, simple procedures are promising tools that allow a bicompartmental evaluation of body composition, and they could be used for the screening of presarcopenia (as defined by EWGSOP, 2010), sarcopenia, and sarcopenic obesity in routine practice.
Acknowledgments
The authors thank A Piccoli and G Pastori (Department of Medical and Surgical Sciences, University of Padova, Italy) for providing the BIVA software, and Dr V Succa (Department of Environmental and Life Sciences, University of Cagliari, Italy) for her contribution in preparing the figures.
Disclosure
The authors report no conflicts of interest in this work.
References
- BuffaRFlorisGUPutzuPFMariniEBody composition variations in ageingColl Antropol201135125926521667542
- MorleyJEBaumgartnerRNRoubenoffRMayerJNairKSSarcopeniaJ Lab Clin Med200113723124311283518
- BaumgartnerRNBody composition in healthy agingAnn N Y Acad Sci200090443744810865787
- Cruz-JentoftAJBaeyensJPBauerJMEuropean Working Group on Sarcopenia in Older PeopleSarcopenia: European consensus on definition and diagnosis: Report of the European Working Group on Sarcopenia in Older PeopleAge Ageing20103941242320392703
- FieldingRAVellasBEvansWJSarcopenia: an undiagnosed condition in older adults. Current consensus definition: prevalence, etiology, and consequences. International working group on sarcopeniaJ Am Med Dir Assoc20111224925621527165
- MorleyJEAbbatecolaAMArgilesJMSociety on Sarcopenia, Cachexia and Wasting Disorders Trialist WorkshopSarcopenia with limited mobility: an international consensusJ Am Med Dir Assoc20111240340921640657
- MuscaritoliMAnkerSDArgilésJConsensus definition of sarcopenia, cachexia and pre-cachexia: joint document elaborated by Special Interest Groups (SIG) “cachexia-anorexia in chronic wasting diseases” and “nutrition in geriatrics”Clin Nutr201029215415920060626
- CesariMFieldingRAPahorMInternational Working Group on SarcopeniaBiomarkers of sarcopenia in clinical trials-recommendations from the International Working Group on SarcopeniaJ Cachexia Sarcopenia Muscle20123318119022865205
- StenholmSHarrisTBRantanenTVisserMKritchevskySBFerrucciLSarcopenic obesity: definition, cause and consequencesCurr Opin Clin Nutr Metab Care20081169370018827572
- BorkanGAHultsDEGerzofSGRobbinsAHSilbertCKAge changes in body composition revealed by computed tomographyJ Gerontol19833866736776630900
- VisserMKritchevskySBGoodpasterBHLeg muscle mass and composition in relation to lower extremity performance in men and women aged 70 to 79: the health, aging and body composition studyJ Am Geriatr Soc20025089790412028178
- DelmonicoMJHarrisTBVisserMHealth, Aging, and BodyLongitudinal study of muscle strength, quality, and adipose tissue infiltrationAm J Clin Nutr2009901579158519864405
- ThibaultRPichardCThe evaluation of body composition: a useful tool for clinical practiceAnn Nutr Metab201260161622179189
- PiccoliARossiBPillonLBuccianteGA new method for monitoring body fluid variation by bioimpedance analysis: the RXc graphKidney Int1994465345397967368
- NormanKStobäusNPirlichMBosy-WestphalABioelectrical phase angle and impedance vector analysis – Clinical relevance and applicability of impedance parametersClin Nutr20123185486122698802
- NormanKPirlichMSorensenJBioimpedance vector analysis as a measure of muscle functionClin Nutr2009281788219064305
- MariniESergiGSuccaVEfficacy of specific bioelectrical impedance vector analysis (BIVA) for assessing body composition in the elderlyJ Nutr Health Aging2012
- LohmanTGRocheAFMartorellRAnthropometric Standardization Reference ManualChampaign, ILHuman Kinetics1988
- [No authors listed]Bioelectrical impedance analysis in body composition measurement: National Institutes of Health Technology Assessment Conference StatementAm J Clin Nutr199664524S532S8780375
- MariniEIl Dimorfismo Sessuale Nella Popolazione Della Sardegna Centro-Meridionale [doctoral thesis]CagliariUniversity of Cagliari1992
- ChertowGMLowrieEGWilmoreDWNutritional assessment with bioelectrical impedance analysis in maintenance hemodialysis patientsJ Am Soc Nephrol1995675817579073
- BaumgartnerRNKoehlerKMGallagherDEpidemiology of sarcopenia among the elderly in New MexicoAm J Epidemiol19981477557639554417
- BaumgartnerRNStauberPMMcHughDKoehlerKMGarryPJCross-sectional age difference in body composition in persons 60 years of ageJ Gerontol A Biol Sci Med Sci199550M307M3167583802
- Castillo-MartínezLColín-RamírezEOrea-TejedaACachexia assessed by bioimpedance vector analysis as a prognostic indicator in chronic stable heart failure patientsNutrition201228988689122480798
- KyleUGGentonLHansDPichardCValidation of a bioelectrical impedance analysis equation to predict appendicular skeletal muscle mass (ASMM)Clin Nutr200322653754314613755
- PietrobelliAMoriniPBattistiniNChiumelloGNunezCHeymsfieldSBAppendicular skeletal muscle mass: prediction from multiple frequency segmental bioimpedance analysisEur J Clin Nutr19985275075119683333
- SiervoMFaberPGibneyERUse of the cellular model of body composition to describe changes in body water compartments after total fasting, very low calorie diet and low calorie diet in obese menInt J Obes (Lond)201034590891820142822
- DittmarMReberHNew equations for estimating body cell mass from bioimpedance parallel models in healthy older GermansAm J Physiol Endocrinol Metab20012815e1005e101411595657
- SiervoMStephanBCMNastiGColantuoniAAgeing, adiposity indexes and low muscle mass in a clinical sample of overweight and obese womenObes Res Clin Pract20126e63e70