
Abstract
Background
This study aims to investigate GFR decline in elderly subjects with varying physical conditions and analyze key risk factors impacting renal function changes.
Methods
We obtained data from patients between 2017 and 2019, and matched healthy elderly subjects based on gender and age. Data collected for all subjects included annual measurements of fast blood glucose (GLU), glycated hemoglobin (HbA1c), low-density lipoprotein cholesterol (LDL-c), blood albumin (ALB), blood uric acid (UA), urine protein (UP), and systolic blood pressure (SBP). Additionally, information on coexisting diseases was gathered. The Full Age Spectrum (FAS) equation was used to calculate eGFR.
Results
A total of 162 patients with complete 3-year renal dynamic imaging were included, including 84 patients in the kidney disease group (K group) and 78 patients in the non-kidney disease group (NK group). Ninety individuals were selected as the healthy group (H group). The annual decline rate in the K group was the fastest, which exceeded 5mL/min/1.73m2 (P < 0.05). Group (K group: β=−40.31, P<0.001; NK group: β=−26.96, P<0.001), ALB (β=−0.38, P=0.038) and HbA1c (β=1.36, P=0.029) had a significant negative impact on the eGFR changes. For participants who had negative proteinuria: K group had the most significant annual eGFR decline.
Conclusion
The presence of kidney disease, along with proteinuria nor not, can lead to a marked acceleration in kidney function decline in elderly. We categorize elderly individuals with an annual eGFR decline of more than 5 mL/min/1.73m2 as the “kidney accelerated aging” population.
Introduction
We have been monitoring age-related changes in glomerular filtration rate (GFR) in different populations. The aging kidney undergoes complex changes, making it prone to pathological changes such as podocyte hypertrophy, glomerulosclerosis, tubular atrophy, and progressive microvascular rarefaction. The accumulation of senescent cells can explain inadequate repair and loss of function.Citation1 Theoretically, it is estimated that about 6000 to 6500 nephrons are lost every year after the age of 30; GFR decreases by approximately 5–10% per decade after the age of 35.Citation2,Citation3 Studies have shown that kidneys from healthy donors aged 70 to 75 years are 48% less intact than those from donors aged 18 to 29 years.Citation4 In many cross-sectional studies, it has been observed that GFR steadily declines (approximately 0.75–1.0 mL/min/1.73m2/year on average) in healthy adults as they age.Citation5,Citation6
However, our observations and research have proposed some different views. We analyzed the results of continuous 3-year follow-up of kidney function in 46,708 apparently healthy individuals and found that the estimated GFR (eGFR) of most subjects remained unchanged during the three years. This phenomenon was more common in older people, suggesting that the eGFR of apparently healthy older people is less likely to change over time.Citation7 This is consistent with the results of some well-known longitudinal studies abroad.Citation8,Citation9 This finding may be attributed to the imprecise calculation of eGFR over time and the transient ultrafiltration results that may be related to comorbidities associated with aging.
There are some drawbacks to using the equation-calculated eGFR as a means of assessing kidney function, as the equation includes two main variables: blood creatinine and age. For older adults, even if their kidney function is not impaired, aging alone can lead to a decrease in eGFR. The current diagnostic criteria for chronic kidney disease (CKD)Citation10 seems to result in overdiagnosis of CKD in older adults. Although eGFR is not accurate, the central argument for using eGFR is that it is an independent predictor of adverse events such as death and end-stage kidney disease. Therefore, we are more concerned with whether GFR will decline rapidly.
From a clinical perspective, for elderly patients with kidney disease, the annual decline in GFR increases significantly. Elderly patients with systemic diseases such as diabetes, hypertension, and hyperuricemia, even in the absence of clear evidence of renal impairment, also seem to experience a rapid decline in GFR.
The evaluation of GFR for the elderly has also been in the Discussion stage. The accuracy of the current eGFR evaluation equation is controversial, and the most ideal evaluation method is to measure GFR (mGFR). GatesCitation11 proposed a relatively simple method for mGFR in 1982. Because the existing computer system can calculate GFR at the same time when the patient is undergoing dynamic renal imaging. This method can avoid blood and urine collection and is not affected by the patient’s diet. It has become the most used GFR evaluation method.
Therefore, the purpose of this study is to explore the annual decline in GFR in elderly subjects with different physical conditions and to analyze the main risk factors that affect changes in renal function; to eliminate the influence of age, the GFR measured by renal dynamic imaging is used to analyze the annual changes in kidney function in older adults. We also hope to identify certain traits that cause rapid decline in GFR among older adults with similar clinical presentations.
Methods
Study Design and Participants
This was a retrospective cohort study. We collected data from patients aged ≥ 60 years old with continuous renal dynamic imaging from June 2017 to May 2019, who were admitted to our hospital with various causes. The creatinine level of the patients enrolled in this study were within the normal range (<88.4 μmol/L). We excluded patients with rapidly progressive glomerulonephritis, acute kidney injury, acute heart failure, kidney transplant status, solitary kidney, etc. At the same time, we extracted matched subjects for gender and age from the existing database of apparently healthy individualsCitation7 (examination database, between January 2012 and December 2014). The apparently healthy population was defined as those without obvious symptoms or signs of illness at the time of inclusion in the study. The inclusion criteria were based on the collection of medical history during the subject’s physical examination.
The collected informations included annual data on serum creatinine, fast blood glucose (GLU), glycated hemoglobin (HbA1c), low-density lipoprotein cholesterol (LDL-c), blood albumin (ALB), blood uric acid (UA), urine protein (UP), and systolic blood pressure (SBP). We also collected information on coexisting diseases in the patients, including chronic kidney disease. The detection of urine protein was performed using the dry chemical method (pH indicator protein error method), with a negative definition of <0.15 g/L.
We used full age spectrum (FAS) equation to calculate eGFR in this study according to our previous result in comparison of GFR estimation equations for elderly individuals.Citation7 The FAS equationCitation12 showed higher accuracy in assessing elderly individuals. Measurement of mGFR was performed in the morning for all study participants by dynamic renal imaging using the Gates method. Using the method described by Gates,Citation11 the mGFR (mL/min) was calculated by multiplying the percentage total renal uptake of Tc-99m-DTPA (148 MBq; Beijing Atomic High-Tech Co., Ltd., Beijing, China; radiochemical purity >95%) by the regression coefficient (9.81270) and subtracting the cutoff value (6.82519).
Grouping
Patients were divided into two groups based on whether they had a confirmed diagnosis of kidney disease: the kidney disease group (K group) and the non-kidney disease group (NK group). Apparent healthy subjects who were matched were defined as the healthy group (H group).
Statistical Methods
The data that conformed to a normal distribution were presented as means and standard deviations (SD), and continuous variables with a non-normal distribution were presented as medians (quartiles). Analysis of variance (ANOVA) is used for multiple group comparisons. The linear mixed model is used for risk factor analysis. We evaluated the change in GFR from the first year to the second year using baseline clinical data from the first year. Similarly, we evaluated the change in GFR from the second year to the third year using clinical data from the second year and conducted risk factor analysis using a hierarchical linear model. To reduce the effect of possible selective bias, the control group selected from the apparent healthy population database was matched with the other two groups using a 1:1 propensity score matching (PSM) with a caliper value of 0.02, respectively. The matching factors included gender, age, and serum creatinine. A two-tailed P<0.05 was considered statistically significant. Statistical analysis was performed using SPSS 23.0 (IBM Corp., Armonk, NY, USA) and Stata (StataCorp., Texas, USA).
Results
Basic Information
A total of 162 patients with complete 3-year renal dynamic imaging were included, including 84 patients in the K group and 78 patients in the NK group. Based on PSM, 90 individuals were selected as the H group. The demographic information of the three groups of subjects is shown in . The kidney disease group includes 32 patients with primary kidney disease (9 with IgA nephropathy, 12 with membranous nephropathy, 3 with minimal change disease, 10 with ischemic nephropathy, and 8 with other pathological types) and 40 patients with secondary kidney disease (21 with diabetic nephropathy, 13 with hypertensive renal damage, 2 with multiple myeloma kidney disease, 1 with gouty nephropathy, 2 with lupus nephritis, and 1 with drug-induced renal damage), as well as 12 patients with kidney tumors.
Table 1 Demographic Characteristics and Baseline Examination Outcomes of Participants Upon Enrollment
As shown in , the K group had a significant increase in GLU, but the NK group had the highest glycated hemoglobin. The K group had the lowest blood albumin and the highest urine protein. LDL-c was highest in the H group. There was no significant difference in systolic blood pressure among the three groups.
Changes in GFR
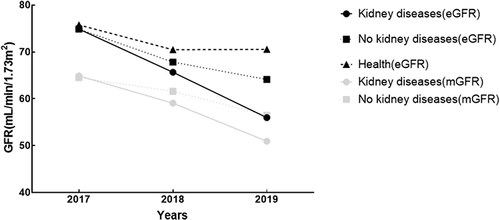
The eGFR situation of each group after 3 years and the mGFR situation of K group and NK group are shown in . Differences of baseline GFR of three groups were statistically not significant. The annual decline rate in the K group was the fastest, which exceeded 5mL/min/1.73m2 (the annual mGFR and eGFR changes were statistically significant, P < 0.05); the GFR changes in NK group and H group were not significant within 3 years ().
Table 2 Three-Year Trends in GFR Levels and Changes Among Three Groups
Figure 1 GFR changes over 3 years in all subjects.
Analysis of Risk Factors Affecting GFR Changes
shows that for the eGFR changes in the three groups, Glu (β=−0.262, P=0.003) and UP (β=−1.482, P<0.001) had a significant negative impact. For the mGFR changes in the two groups, only UP (β=−0.729, P=0.001) had a significant negative impact.
Table 3 Analysis of Factors Influencing Changes in Glomerular Filtration Rate (GFR)
Analysis of Factors Influencing Renal Function Changes in Elderly Participants with Negative Proteinuria
All participants had negative proteinuria: the K group with 20 people, the NK group with 76 people, and the H group with 90 people. The K group had the most significant annual eGFR decline within three years, exceeding 5mL/min/1.73m2. Within 2 years, there was no significant abnormality in the decline of eGFR among the three groups. However, after 3 years, significant differences appeared among the three groups. There were differences in baseline blood glucose, uric acid, and blood albumin among the groups ().
Table 4 Baseline Examination and Trends in Glomerular Filtration Rate (GFR) Among Protein-Negative Subjects
Regression analysis of the annual changes in eGFR in the three groups showed that only baseline blood glucose had a significant negative impact on ΔeGFR. In other words, a high baseline level of blood glucose would lead to a more significant decline in eGFR (Supplementary Table 1).
Discussion
The present study focused on changes in GFR among elderly individuals with different health statuses. The Results showed that patients with confirmed kidney disease had the fastest annual decline in GFR, with mGFR decreasing by 4.65 ± 2.12 mL/min/1.73m2 and eGFR decreasing by 6.31 ± 1.14 mL/min/1.73m2. The second highest decline was observed in elderly patients with other diseases, with mGFR decreasing by 2.67 ± 1.31 mL/min/1.73m2 and eGFR decreasing by 3.59 ± 3.01 mL/min/1.73m2. The GFR of apparently healthy elderly individuals remained stable, with an annual GFR change of −1.74 ± 2.58 mL/min/1.73m2. Given that the GFR of each group was not different at baseline, the subsequent changes in GFR are particularly noteworthy. This reminds us of the need for stratified management of kidney health for different populations. For patients with kidney disease, regular monitoring of kidney function and risk factors is necessary to delay the onset of end-stage renal disease. For healthy elderly individuals, kidney function tends to remain stable, and age-related declines in kidney function have little impact on life expectancy,Citation13 thus there may be no need for excessive concern.Citation14 For elderly individuals with various diseases but without confirmed kidney disease, their kidney reserve has been affected, and clear signs of kidney function decline are evident, highlighting the need to raise the awareness of non-nephrology physicians about kidney protection.
The changes in kidney function in elderly people have their own characteristics: a comprehensive review of the literature reveals that GFR decreases with healthy aging,Citation15 without any apparent compensatory signs (such as an increase in single kidney unit GFR) or kidney damage.Citation16 Compared to young patients with the same eGFR, elderly patients have a much lower risk of progressing to kidney failure.Citation17 The incidence of kidney failure in young people without proteinuria is 0.7/100 person-years, while the incidence in elderly people without proteinuria is so low as to be imperceptible.Citation18 Therefore, blindly performing kidney-related interventions and over-treating elderly people with decreased eGFR is not appropriate. However, identifying the elderly population with a potentially rapid decline in GFR has significant clinical significance.
To avoid age-related confounding factors in eGFR calculation, more reliable methods for studying renal function may be mGFRCitation19 and living donor kidney transplantation:Citation20 GFR declines significantly with age and that the rate of decline in mGFR becomes significant after the age of 40; a large proportion of healthy older adults have mGFR <60 mL/min/1.73 m2. Through observation of mGFR changes, we found that both K and NK groups had age-related declines, with an overall decrease that was lower than eGFR, but the decline rate in the K group was still faster than in the NK group. Unfortunately, we lack mGFR data for the group of apparently healthy older adults. The only longitudinal study using mGFR in a healthy general population is the Renal Iohexol Clearance Survey in Tromsø 6 (RENIS-T6),Citation21 which included a representative sample of 1594 white people aged 50–62 years from the general population without CKD, diabetes, or cardiovascular disease. The authors showed a mean GFR decline rate of 0.84±2.00 mL/min per year.
We paid special attention to the elderly subjects with negative urine protein in the three groups. We wanted to find out if there were any characteristics that could lead to rapid decline in GFR among elderly patients with similar clinical presentations at first diagnosis. These patients all presented with normal serum creatinine and negative urine protein at first diagnosis, but due to different underlying diseases, there were significant differences in the degree of GFR decline. This is also a common challenge for clinical doctors: how to identify high-risk populations and provide individualized treatment. According to the statistical analysis results, GLU at first diagnosis was the factor that affect kidney function. We are also conducting some prospective studies to validate this conclusion, hoping to start interventions for high-risk populations as early as possible. Interestingly, within 2 years, there was almost no difference in eGFR decline among the subjects in these three groups. The significant differences only became evident after 3 years. Therefore, for elderly individuals with combined high-risk factors, it is important not to take it lightly and to continue monitoring the progression of kidney function in the long term.
Based on the above analysis, we believe that for elderly people whose renal state cannot be determined in the initial diagnosis, if their annual eGFR declines by more than 5 mL/min/1.73m2, they can be defined as a “kidney accelerated aging” population. This population exhibits a faster decline in kidney function and may belong to the category of chronic kidney disease, requiring medical monitoring.
We aimed to identify the main risk factors affecting kidney function changes in the elderly. By analyzing a linear mixed effect model, we found that disease status (Grouping) was the main factor leading to accelerated decline in kidney function. In other words, elderly people who are in a diseased state and require hospitalization will experience a faster decline in kidney function, regardless of whether they are clearly diagnosed with kidney disease, while the kidney function of apparently healthy elderly people remains relatively stable over several years. The performance of other risk factors is basically consistent with the reports of scholars in the industry. For all participants, the impact of HbA1c was also very significant. In the negative urine sediment subgroup, traditional risk factors such as blood sugar,Citation22,Citation23 blood pressure,Citation24–26 and uric acidCitation27,Citation28 also showed an impact on kidney function.
Our study had some limitations. The sample size was small, and the observation period was only 3 years. Our study was a single-center study, and the population included in our study was from Beijing, so the conclusions of this study can only represent the situation in northern China. In addition, no renal dynamic imaging was performed in the apparently healthy elderly population, so there was a lack of mGFR data. We are continuing to study renal aging in the elderly, and in future studies, we will expand the sample size, include more regions and races, and introduce new markers.
Conclusion
In summary, we observed age-related changes in elderly people in Beijing: except for apparently healthy elderly individuals, all other patients showed significant age-related declines in GFR; the acceleration of renal function deterioration in disease states was particularly serious in cases of clearly diagnosed kidney diseases; the disease status was also an independent risk factor affecting the progression of kidney function in people with negative urine sediment. We define elderly people whose annual eGFR declines by more than 5mL /min/1.73m2 as the “kidney accelerated aging” population. We recommend that these population be closely monitored and have their internal complications controlled; non-nephrology specialists should increase their awareness of renal function loss; and apparently healthy elderly individuals do not require excessive medical care. This study revealed to us the trends and patterns of renal function changes in elderly individuals in Beijing with varying kidney conditions. It provides a foundation for future research and offers new insights into stratified diagnosis and treatment of kidney aging.
Ethics Approval and Consent to Participate
The study was approved by the Beijing Hospital ethical committee (2022BJYYEC-209-02) and performed in accordance with the Helsinki Declaration. The ethical committee of Beijing Hospital waived the need of ethical approval for informed consent because of the retrospective nature of the analysis.
This study will strictly follow the requirements of relevant Chinese laws and regulations to adopt confidentiality measures, collect information for unlinking processing, and do not include unique information that can identify the subjects when collecting information and publishing research results.
Author Contributions
All authors made a significant contribution to the work reported, whether that is in the conception, study design, execution, acquisition of data, analysis and interpretation, or in all these areas; took part in drafting, revising or critically reviewing the article; gave final approval of the version to be published; have agreed on the journal to which the article has been submitted; and agree to be accountable for all aspects of the work.
Disclosure
The authors declare that they have no competing interests in this work.
Data Sharing Statement
The datasets used and/or analysed during the current study are available from the corresponding author on reasonable request.
Additional information
Funding
References
- Schmitt R, Melk A. Molecular mechanisms of renal aging. Kidney Int. 2017;92(3):569–579. doi:10.1016/j.kint.2017.02.036
- Glassock RJ, Rule AD. The implications of anatomical and functional changes of the aging kidney: with an emphasis on the glomeruli. Kidney Int. 2012;82(3):270–277. doi:10.1038/ki.2012.65
- Glassock RJ, Rule AD. Aging and the kidneys: anatomy, physiology and consequences for defining chronic kidney disease. Nephron. 2016;134(1):25–29. doi:10.1159/000445450
- Denic A, Lieske JC, Chakkera HA, et al. The substantial loss of nephrons in healthy human kidneys with aging. J Am Soc Nephrol. 2017;28(1):313–320. doi:10.1681/ASN.2016020154
- Ebert N, Jakob O, Gaedeke J, et al. Prevalence of reduced kidney function and albuminuria in older adults: the Berlin Initiative Study. Nephrol Dial Transplant. 2017;32(6):997–1005.
- Wetzels JF, Kiemeney LA, Swinkels DW, Willems HL, den Heijer M. Age- and gender-specific reference values of estimated GFR in Caucasians: the Nijmegen Biomedical Study. Kidney Int. 2007;72(5):632–637. doi:10.1038/sj.ki.5002374
- Lengnan X, Aiqun C, Ying S, Chuanbao L, Yonghui M. The effects of aging on the renal function of a healthy population in Beijing and an evaluation of a range of estimation equations for glomerular filtration rate. Aging. 2021;13(5):6904–6917. doi:10.18632/aging.202548
- Muntner P. Longitudinal measurements of renal function. Semin Nephrol. 2009;29(6):650–657. doi:10.1016/j.semnephrol.2009.07.010
- Seliger SL, Wendell CR, Waldstein SR, Ferrucci L, Zonderman AB. Renal function and long-term decline in cognitive function: the Baltimore Longitudinal Study of Aging. Am J Nephrol. 2015;41(4–5):305–312. doi:10.1159/000430922
- Chapter 1: diagnosis and evaluation of anemia in CKD. Kidney Int Suppl. 2012;2(4):288–291. doi:10.1038/kisup.2012.33
- Gates GF. Glomerular filtration rate: estimation from fractional renal accumulation of 99mTc-DTPA (stannous). Am J Roentgenol. 1982;138(3):565–570. doi:10.2214/ajr.138.3.565
- Levey AS, Stevens LA, Schmid CH, et al. A new equation to estimate glomerular filtration rate. Ann Internal Med. 2009;150(9):604–612. doi:10.7326/0003-4819-150-9-200905050-00006
- Denic A, Glassock RJ, Rule AD. Structural and functional changes with the aging kidney. Adv Chronic Kidney Dis. 2016;23(1):19–28. doi:10.1053/j.ackd.2015.08.004
- O’Hare AM, Hotchkiss JR, Kurella Tamura M, et al. Interpreting treatment effects from clinical trials in the context of real-world risk information: end-stage renal disease prevention in older adults. JAMA Intern Med. 2014;174(3):391–397. doi:10.1001/jamainternmed.2013.13328
- Schaeffner ES, Ebert N, Kuhlmann MK, et al. Age and the course of GFR in persons aged 70 and above. Clin J Am Soc Nephrol. 2022;17(8):1119–1128. doi:10.2215/CJN.16631221
- Delanaye P, Jager KJ, Bökenkamp A, et al. CKD: a call for an age-adapted definition. J Am Soc Nephrol. 2019;30(10):1785–1805. doi:10.1681/ASN.2019030238
- Hommos MS, Glassock RJ, Rule AD. Structural and functional changes in human kidneys with healthy aging. J Am Soc Nephrol. 2017;28(10):2838–2844. doi:10.1681/ASN.2017040421
- Obi Y, Kimura T, Nagasawa Y, et al. Impact of age and overt proteinuria on outcomes of stage 3 to 5 chronic kidney disease in a referred cohort. Clin J Am Soc Nephrol. 2010;5(9):1558–1565. doi:10.2215/CJN.08061109
- Yayo E, Ayé M, Yao C, et al. Measured (and estimated) glomerular filtration rate: reference values in West Africa. Nephrol Dial Transplant. 2018;33(7):1176–1180. doi:10.1093/ndt/gfx244
- Pottel H, Hoste L, Yayo E, Delanaye P. Glomerular filtration rate in healthy living potential kidney donors: a meta-analysis supporting the construction of the full age spectrum equation. Nephron. 2017;135(2):105–119. doi:10.1159/000450893
- Melsom T, Mathisen UD, Eilertsen BA, et al. Physical exercise, fasting glucose, and renal hyperfiltration in the general population: the Renal Iohexol Clearance Survey in Tromsø 6 (RENIS-T6). Clin J Am Soc Nephrol. 2012;7(11):1801–1810. doi:10.2215/CJN.02980312
- Halbesma N, Brantsma AH, Bakker SJ, et al. Gender differences in predictors of the decline of renal function in the general population. Kidney Int. 2008;74(4):505–512. doi:10.1038/ki.2008.200
- Xie Y, Lin J, Gallagher M, et al. Prognostic significance of baseline blood glucose levels and glucose variability in severe acute kidney injury: a secondary analysis from the RENAL study. J Clin Med. 2022;12(1). doi:10.3390/jcm12010015
- Xie X, Atkins E, Lv J, et al. Effects of intensive blood pressure lowering on cardiovascular and renal outcomes: updated systematic review and meta-analysis. Lancet. 2016;387(10017):435–443. doi:10.1016/S0140-6736(15)00805-3
- Peralta CA, McClure LA, Scherzer R, et al. Effect of intensive versus usual blood pressure control on kidney function among individuals with prior lacunar stroke: a post hoc analysis of the secondary prevention of Small Subcortical Strokes (SPS3) randomized trial. Circulation. 2016;133(6):584–591. doi:10.1161/CIRCULATIONAHA.115.019657
- Eriksen BO, Stefansson VT, Jenssen TG, et al. Blood pressure and age-related GFR decline in the general population. BMC Nephrol. 2017;18(1):77. doi:10.1186/s12882-017-0496-7
- Hayashino Y, Okamura S, Tsujii S, Ishii H. Association of serum uric acid levels with the risk of development or progression of albuminuria among Japanese patients with type 2 diabetes: a prospective cohort study [Diabetes Distress and Care Registry at Tenri (DDCRT 10)]. Acta Diabetologica. 2016;53(4):599–607. doi:10.1007/s00592-015-0825-x
- Chang YH, Lei CC, Lin KC, Chang DM, Hsieh CH, Lee YJ. Serum uric acid level as an indicator for CKD regression and progression in patients with type 2 diabetes mellitus-a 4.6-year cohort study. Diabetes/Metab Res Rev. 2016;32(6):557–564. doi:10.1002/dmrr.2768